Managing pharmaceutical data is never simple. You must track sales, costs, discounts, margins, regions, therapy areas, and products at the same time. However, when this data stays scattered across multiple Excel sheets, decision-making slows down. As a result, management teams lose visibility, and performance gaps remain hidden.
That is exactly where a Pharmaceuticals Dashboard in Excel becomes a powerful and practical solution.
In this detailed article, you will learn what a Pharmaceuticals Dashboard in Excel is, how it works, why it matters, its complete dashboard structure, advantages, opportunities for improvement, best practices, and frequently asked questions. Moreover, this guide uses clear language, strong transition words, and real business logic so you can apply it confidently.
Click to buy Pharmaceuticals Dashboard in Excel
What Is a Pharmaceuticals Dashboard in Excel?
A Pharmaceuticals Dashboard in Excel is a ready-to-use, interactive reporting solution that converts raw pharmaceutical sales and cost data into clear visuals, KPIs, and trends.
Instead of reviewing thousands of rows manually, you can monitor performance using charts, KPI cards, and slicers. Therefore, sales managers, finance teams, and senior leadership can make faster and more accurate decisions.
This dashboard focuses on:
- Sales performance
- Cost and profitability
- Discounts and pricing
- Regional and therapy-wise analysis
- Product-level insights
- Monthly trends
Because Excel remains familiar to most teams, this dashboard delivers advanced analytics without expensive BI tools.
Why Do Pharmaceutical Companies Need a Dashboard in Excel?
Pharmaceutical businesses operate in a high-volume and high-margin environment. Therefore, even small pricing or cost changes can impact profits significantly.
However, many pharma companies still rely on manual reports. As a result, they face delays, errors, and missed insights.
A Pharmaceuticals Dashboard in Excel solves these challenges by:
- Centralizing all key metrics
- Improving data visibility
- Reducing reporting time
- Supporting strategic decisions
Moreover, Excel dashboards remain flexible, customizable, and easy to share.
What Does the Pharmaceuticals Dashboard in Excel Include?
This ready-to-use dashboard contains multiple analytical sheet tabs. Each tab focuses on a specific business question. As a result, users can navigate insights easily and quickly.
Let us explore each sheet in detail.
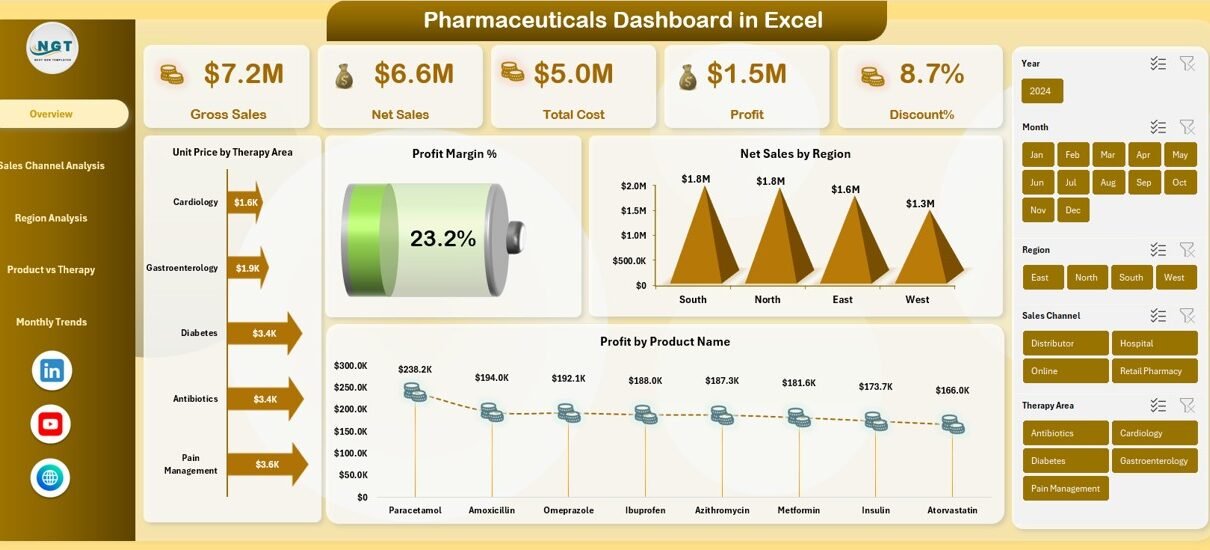
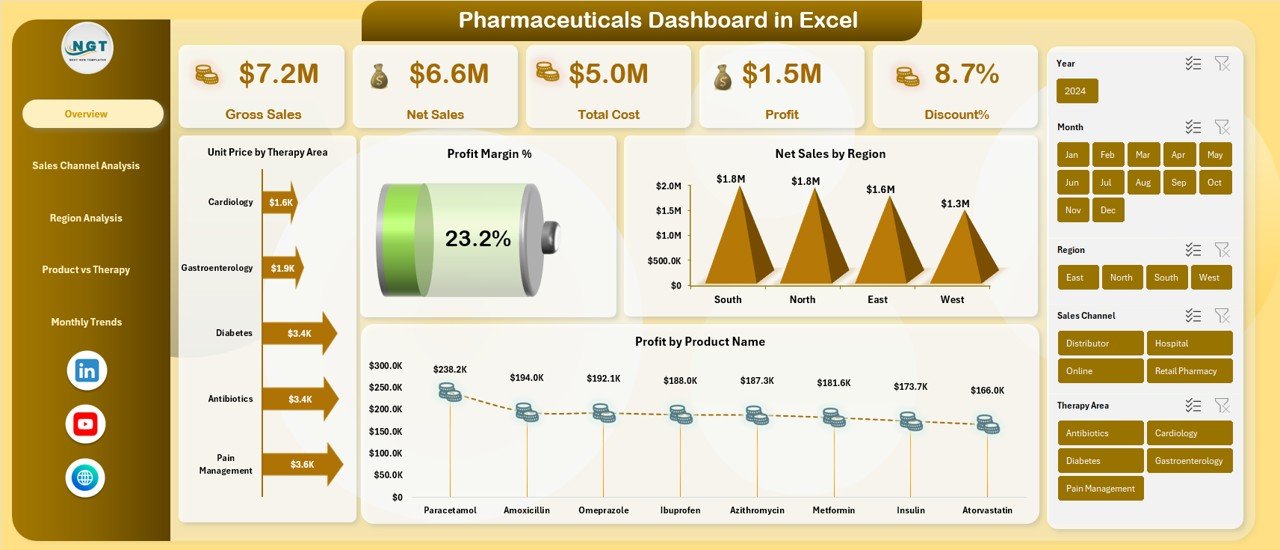
Overview Sheet: How Is Overall Pharma Performance Measured?
The Overview Sheet acts as the control center of the dashboard. It summarizes the most critical KPIs at a glance.
Key KPIs in the Overview Sheet
- Gross Sales
Shows total revenue before discounts and returns. - Net Sales
Reflects actual revenue after discounts and adjustments. - Total Cost
Displays the complete cost associated with sales. - Profit
Calculates earnings after deducting costs from net sales. - Discount %
Highlights pricing pressure and promotional impact. - Profit Margin %
Shows profitability efficiency.
Key Charts in the Overview Sheet
- Unit Price by Therapy Area
Helps compare pricing strategies across therapies. - Net Sales by Region
Identifies high-performing and weak regions. - Profit by Product Name
Highlights top and underperforming products.
Because this sheet offers a snapshot view, decision-makers can identify issues immediately.
Click to buy Pharmaceuticals Dashboard in Excel
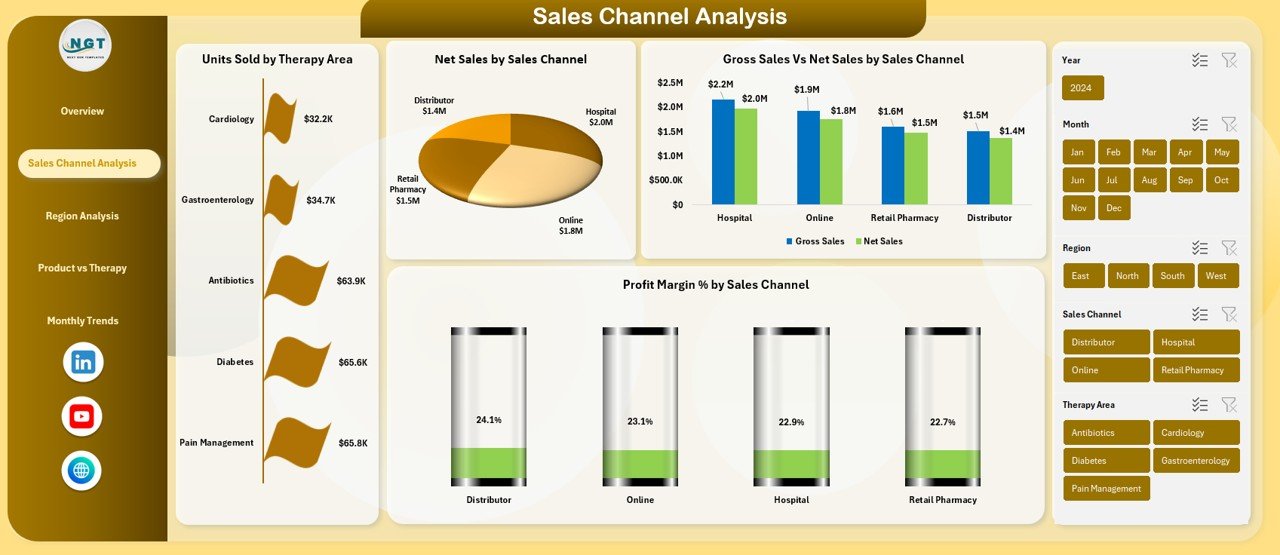
Sales Channel Analysis: Which Channels Drive Pharma Revenue?
Sales channels play a crucial role in pharmaceutical growth. Therefore, this sheet focuses on channel-wise performance.
Key Metrics in Sales Channel Analysis
- Units Sold by Therapy Area
Shows demand patterns across therapies. - Net Sales by Sales Channel
Reveals revenue contribution by channel. - Gross Sales vs Net Sales by Sales Channel
Highlights discount impact per channel.
Why This Analysis Matters
- Identifies high-margin channels
- Detects discount-heavy channels
- Supports channel optimization strategies
As a result, sales leaders can adjust channel focus effectively.
Click to buy Pharmaceuticals Dashboard in Excel
Region Analysis: How Do Regions Perform in Pharma Sales?
Regional performance varies due to market maturity, regulations, and competition. Therefore, this sheet provides deep regional insights.
Key Charts in Region Analysis
- Profit USD by Region
Identifies profit-generating regions. - Gross Sales by Region
Shows revenue strength geographically. - Profit Margin % by Region
Highlights efficiency differences. - Discount % by Region
Reveals pricing pressure by geography.
Business Value of Region Analysis
- Supports regional strategy planning
- Helps allocate sales budgets
- Identifies regions needing corrective action
Because regional insights remain critical, this sheet supports long-term expansion planning.

Click to buy Pharmaceuticals Dashboard in Excel
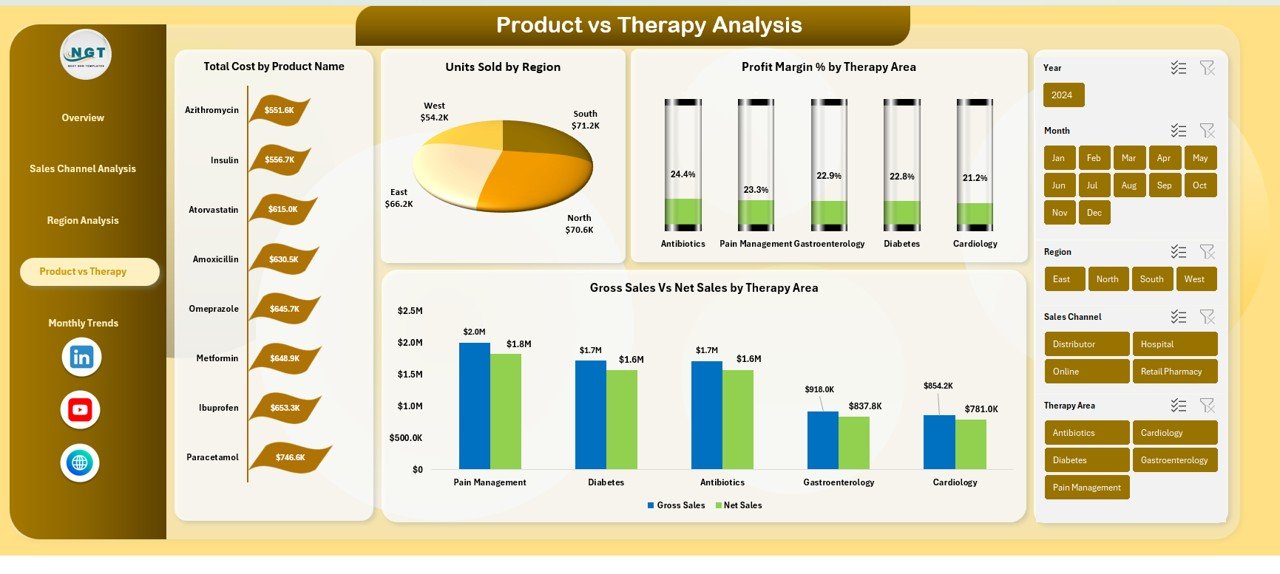
Product vs Therapy Analysis: Which Products and Therapies Perform Best?
Pharma portfolios include multiple products across therapy areas. Therefore, understanding product-therapy interaction becomes essential.
Key Visuals in Product vs Therapy Analysis
- Total Cost by Product Name
Identifies cost-intensive products. - Units Sold by Region
Shows regional demand by product. - Gross Sales vs Net Sales by Therapy Area
Highlights discount impact by therapy.
Why This Analysis Is Important
- Improves product portfolio decisions
- Supports therapy-level pricing strategies
- Helps discontinue or reposition weak products
As a result, management can optimize the product mix effectively.
Click to buy Pharmaceuticals Dashboard in Excel
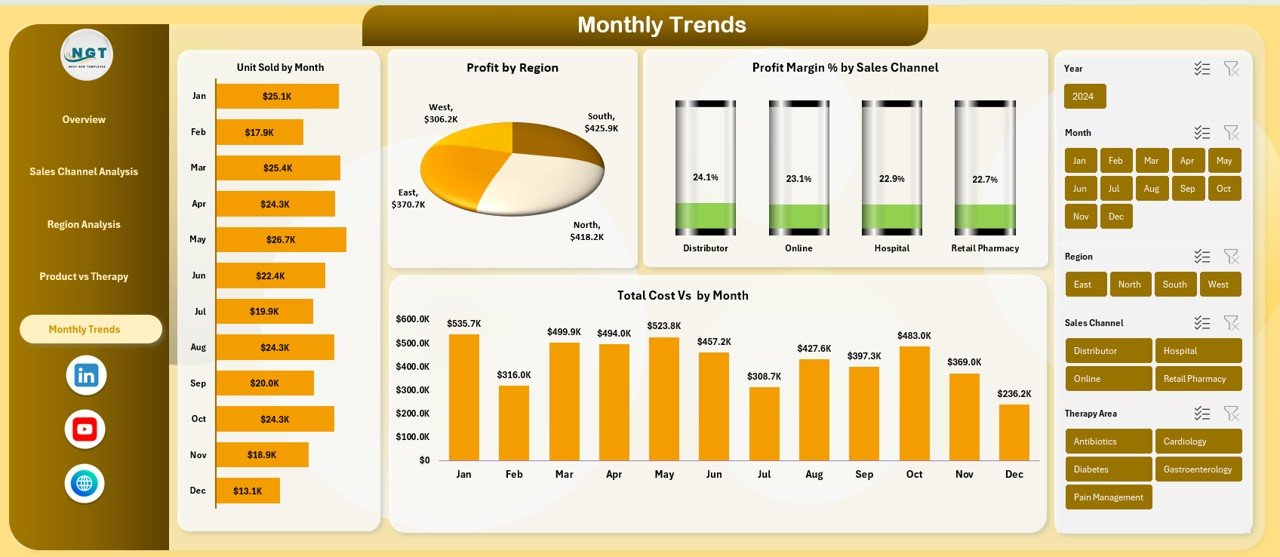
Monthly Trends: How Does Pharma Performance Change Over Time?
Trends reveal patterns that single-month views cannot show. Therefore, the Monthly Trends sheet focuses on time-based analysis.
Key Trend Charts
- Units Sold by Month
Tracks sales volume trends. - Profit by Region (Monthly)
Shows how regional profitability changes. - Profit Margin % by Sales Channel
Identifies improving or declining channels. - Total Cost vs Month
Tracks cost escalation or control.
Strategic Benefits of Trend Analysis
- Detects seasonality
- Supports forecasting
- Helps set realistic targets
Because trends guide future planning, this sheet remains vital for strategy teams.
Click to buy Pharmaceuticals Dashboard in Excel
Advantages of Pharmaceuticals Dashboard in Excel
A Pharmaceuticals Dashboard in Excel delivers strong operational and strategic value.
Key Advantages
- Centralizes pharma sales, cost, and profit data
- Improves visibility across products, regions, and channels
- Reduces manual reporting effort
- Supports faster decision-making
- Works without expensive BI tools
- Allows easy customization and scalability
- Uses familiar Excel environment
As a result, both small and large pharma organizations benefit equally.
Opportunities for Improvement in Pharmaceuticals Dashboards
Although the dashboard delivers strong insights, organizations can improve it further.
Opportunities for Improvement
- Add forecasting models using historical trends
- Integrate inventory and stock-out data
- Include prescription or demand indicators
- Automate data refresh using Power Query
- Add variance analysis against targets
Because continuous improvement drives competitiveness, these enhancements add long-term value.
Best Practices for the Pharmaceuticals Dashboard in Excel
To maximize the impact of this dashboard, follow proven best practices.
Best Practices
- Keep data clean and standardized
- Use consistent date and currency formats
- Update data regularly to maintain accuracy
- Use slicers for region, therapy, and channel filters
- Avoid overloading the dashboard with too many visuals
- Focus on business questions, not just charts
- Validate KPIs with finance and sales teams
By following these practices, teams ensure reliable and actionable insights.
Who Should Use a Pharmaceuticals Dashboard in Excel?
This dashboard supports multiple roles within the pharma ecosystem.
Ideal Users
- Pharmaceutical sales managers
- Finance and controlling teams
- Product managers
- Regional and zonal heads
- Business analysts
- Senior management
Because each role needs clear insights, the dashboard serves cross-functional teams effectively.
How Does This Dashboard Support Decision-Making?
A Pharmaceuticals Dashboard in Excel supports decisions by:
- Highlighting profit leaks
- Identifying high-growth therapies
- Optimizing discount strategies
- Improving regional focus
- Supporting budget planning
As a result, leaders can act proactively instead of reactively.
Conclusion: Why Should You Use a Pharmaceuticals Dashboard in Excel?
A Pharmaceuticals Dashboard in Excel transforms complex pharma data into simple, visual, and actionable insights. Instead of relying on static reports, teams gain real-time visibility into sales, costs, discounts, and profitability.
Moreover, this ready-to-use dashboard improves efficiency, supports smarter decisions, and enhances business performance. Because Excel remains flexible and familiar, organizations can adopt this solution quickly and confidently.
If you want clarity, control, and confidence in pharma analytics, this dashboard delivers exactly that.
Frequently Asked Questions (FAQs)
- What is a Pharmaceuticals Dashboard in Excel?
A Pharmaceuticals Dashboard in Excel is a visual reporting tool that analyzes pharma sales, cost, profit, and performance using Excel charts and KPIs.
- Who can use this dashboard?
Sales teams, finance teams, product managers, analysts, and senior leadership can use it effectively.
- Does this dashboard require advanced Excel skills?
No. Users need basic Excel knowledge to navigate and filter the dashboard.
- Can I customize the dashboard?
Yes. You can modify KPIs, charts, and layouts based on business needs.
- Is this dashboard suitable for small pharma companies?
Yes. Both small and large organizations can use it effectively.
- Can this dashboard support monthly and yearly analysis?
Yes. The Monthly Trends and Overview sheets support both short-term and long-term analysis.
- Does it support region-wise and product-wise analysis?
Absolutely. The dashboard includes dedicated Region Analysis and Product vs Therapy Analysis sheets.
- Can I integrate this dashboard with other Excel data sources?
Yes. You can connect it with Power Query, pivot tables, or external data sources.
Click to buy Pharmaceuticals Dashboard in Excel
Visit our YouTube channel to learn step-by-step video tutorials
Watch the step-by-step video tutorial: