Managing health-sector tenders demands accuracy, transparency, and continuous performance tracking. Hospitals, public health departments, pharmaceutical procurement units, and government healthcare agencies handle high-value tenders every year. Therefore, decision-makers must track tender efficiency, cost control, timelines, and compliance without delays or confusion.
That is exactly where a Health Tender KPI Dashboard in Excel becomes a powerful and practical solution.
In this detailed guide, you will learn what a Health Tender KPI Dashboard in Excel is, why healthcare organizations need it, how it works, its worksheet structure, key KPIs, advantages, best practices, and frequently asked questions. Moreover, this article uses clear language, strong transitions, and real-world healthcare logic so you can apply it confidently in daily operations.
Click to buy Health Tender KPI Dashboard in Excel
What Is a Health Tender KPI Dashboard in Excel?
A Health Tender KPI Dashboard in Excel is a centralized performance monitoring tool designed to track, analyze, and visualize tender-related KPIs in healthcare procurement.
Instead of reviewing multiple spreadsheets, emails, and tender documents manually, this dashboard converts raw tender data into meaningful KPIs, trend charts, and performance indicators. As a result, healthcare procurement teams gain instant visibility into tender performance across months and years.
Moreover, because the dashboard uses Excel, teams can deploy it immediately without investing in expensive BI tools or technical infrastructure.
Why Do Healthcare Organizations Need a Tender KPI Dashboard?
Healthcare tenders involve strict regulations, high financial risk, and public accountability. Therefore, even small inefficiencies can cause budget overruns, delayed supplies, or compliance failures.
Without a structured KPI dashboard, healthcare teams often face:
- Scattered tender data across multiple files
- Delayed performance reviews
- Poor visibility into cost overruns
- Limited comparison with targets and previous years
- Manual reporting errors
However, a Health Tender KPI Dashboard in Excel solves these challenges by offering a single source of truth.
How Does a Health Tender KPI Dashboard in Excel Work?
A Health Tender KPI Dashboard works by combining multiple structured worksheets into one integrated reporting system.
First, users enter actual tender performance data. Then, they input target values and previous year figures. After that, Excel formulas calculate KPI variances automatically. Finally, the dashboard visualizes the results using tables, arrows, and trend charts.
Because of this workflow, teams can monitor performance monthly, quarterly, and yearly with ease.
Worksheet Structure of Health Tender KPI Dashboard in Excel
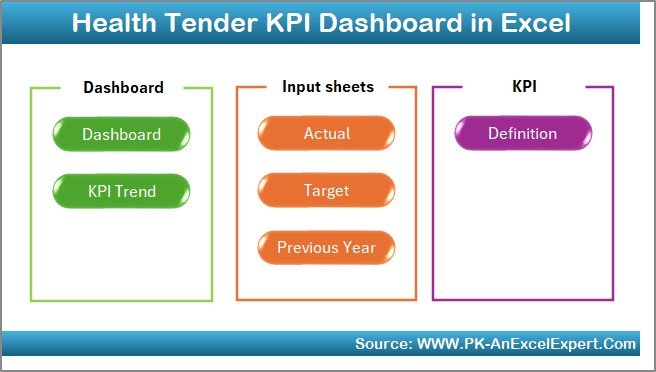
This Health Tender KPI Dashboard in Excel consists of 7 professionally designed worksheets. Each sheet plays a specific role in KPI tracking and analysis.
Summary Page
The Summary Page acts as an index and navigation hub.
- It contains 6 interactive buttons
- Each button links directly to a specific worksheet
- Users can jump between sheets instantly
As a result, navigation becomes smooth and user-friendly, even for non-technical users.
Click to buy Health Tender KPI Dashboard in Excel
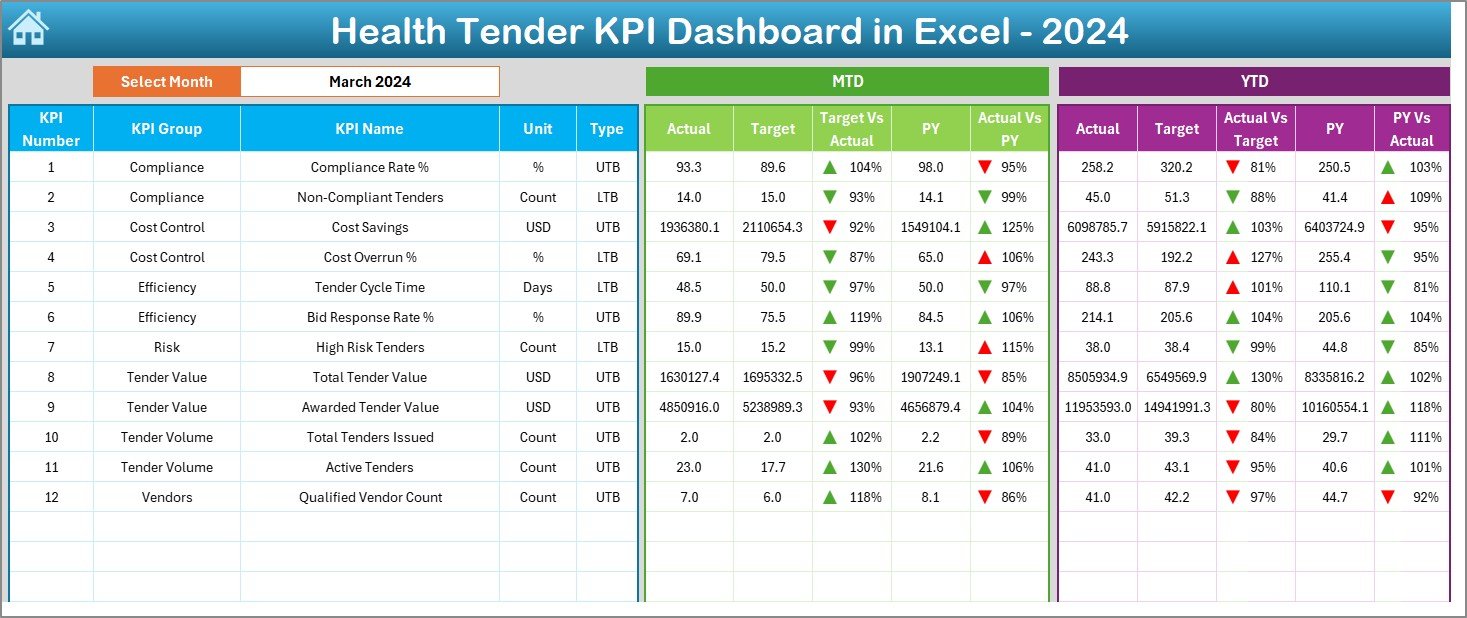
Dashboard Sheet Tab
The Dashboard Sheet is the heart of the entire system.
Here, you can view all KPIs in one place with real-time updates.
Key features include:
- Month selection using a drop-down at cell D3
- Automatic KPI updates when the month changes
- Clear comparison between Actual, Target, and Previous Year values
MTD Performance Display
- MTD Actual
- MTD Target
- MTD Previous Year
- Target vs Actual %
- Previous Year vs Actual %
YTD Performance Display
- YTD Actual
- YTD Target
- YTD Previous Year
- Target vs Actual %
- Previous Year vs Actual %
Additionally, conditional formatting arrows clearly show performance direction. Therefore, decision-makers can identify underperformance instantly.
Click to buy Health Tender KPI Dashboard in Excel
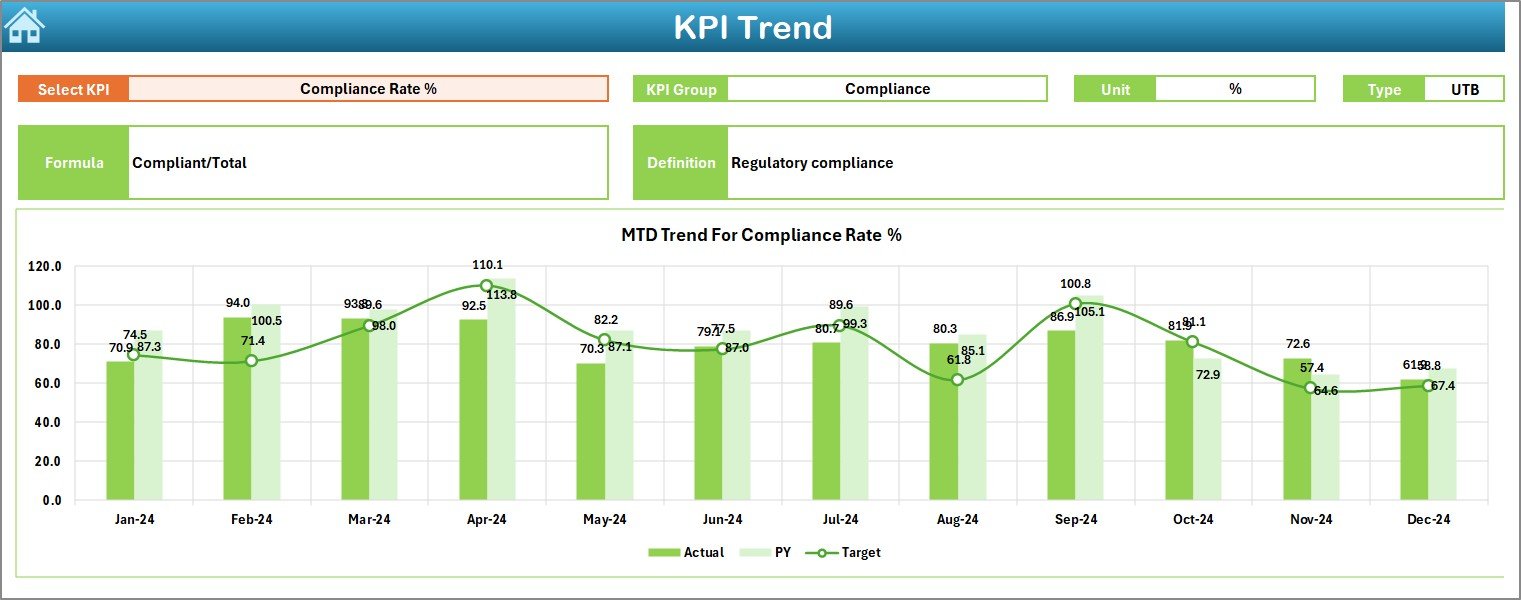
Trend Sheet Tab
The Trend Sheet focuses on detailed KPI analysis.
Here, users can select a KPI name from the drop-down available at cell C3.
Once selected, the sheet displays:
- KPI Group
- KPI Unit
- KPI Type (Lower the Better or Upper the Better)
- KPI Formula
- KPI Definition
Moreover, the sheet shows MTD and YTD trend charts for:
- Actual values
- Target values
- Previous Year values
Because of this structure, teams can analyze performance behavior over time rather than relying on static numbers.
Click to buy Health Tender KPI Dashboard in Excel
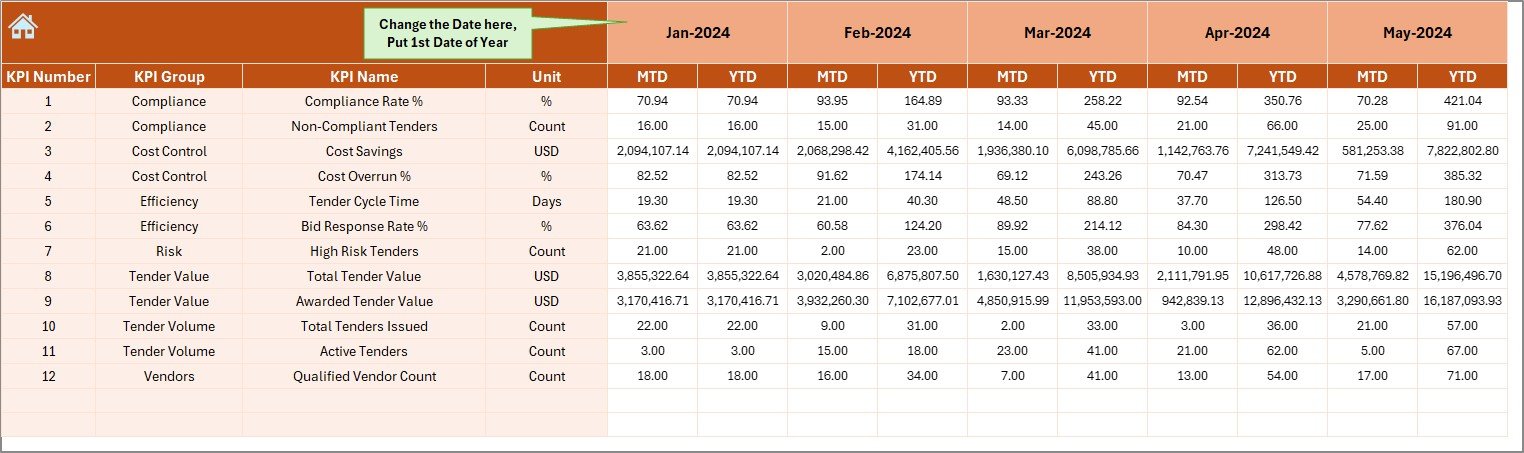
Actual Numbers Input Sheet
This sheet allows users to enter actual performance data.
Key points include:
- Users can change the reporting month from cell E1
- Users input the first month of the year in E1
- MTD and YTD actual values update automatically
As a result, data entry remains simple, controlled, and consistent.
Click to buy Health Tender KPI Dashboard in Excel
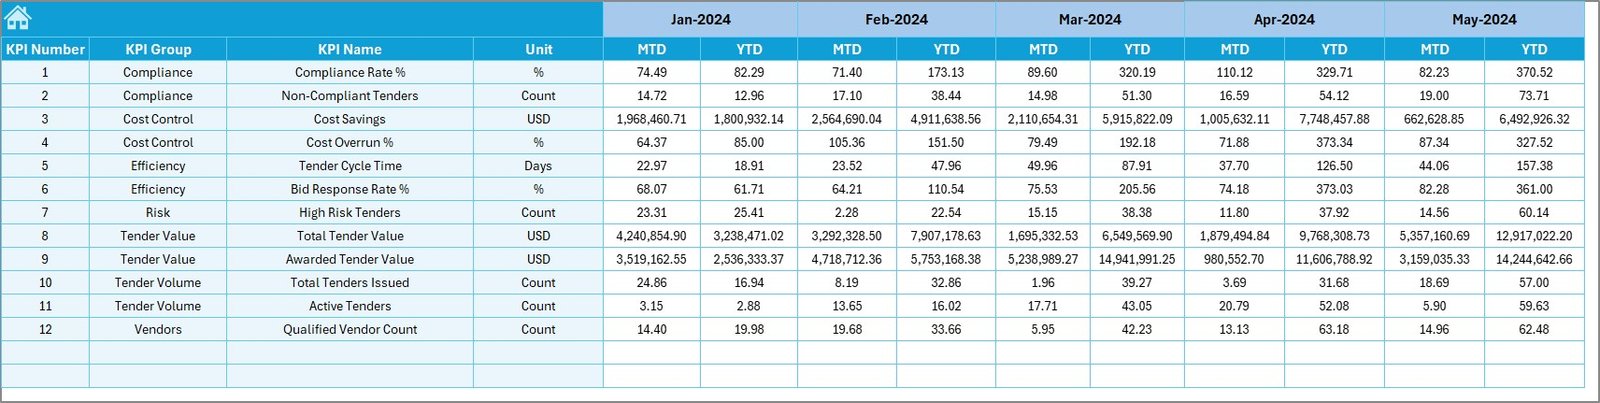
Target Sheet Tab
The Target Sheet stores planned KPI targets.
Here, users enter:
- MTD target values
- YTD target values
- Monthly targets for each KPI
Because the dashboard pulls data from this sheet, performance comparisons remain accurate and transparent.
Click to buy Health Tender KPI Dashboard in Excel
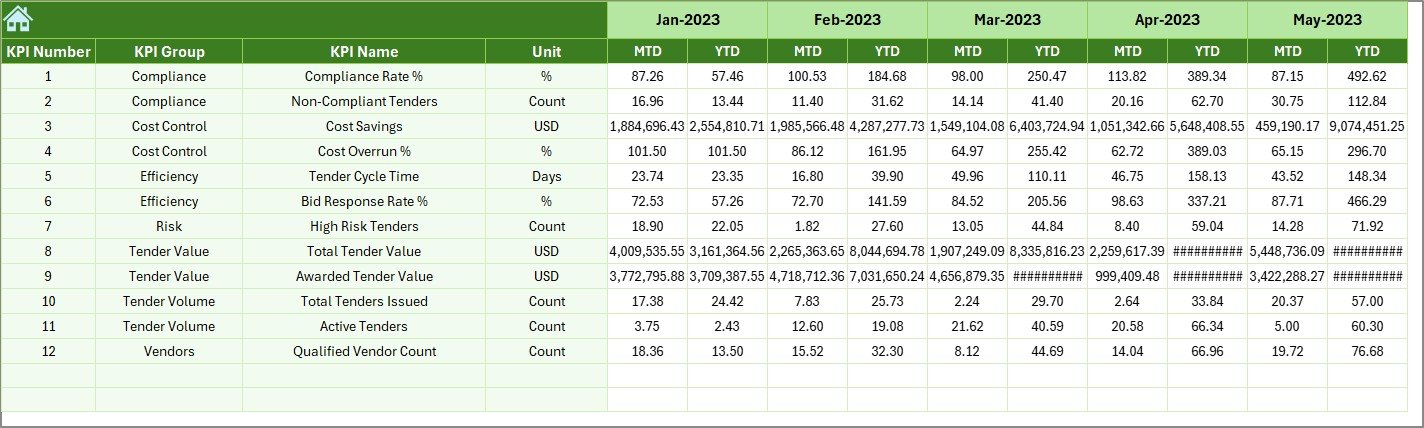
Previous Year Number Sheet Tab
This sheet captures historical performance.
Users enter:
- Previous year MTD values
- Previous year YTD values
Consequently, the dashboard enables strong year-over-year comparisons, which are essential in healthcare tender evaluations.
Click to buy Health Tender KPI Dashboard in Excel
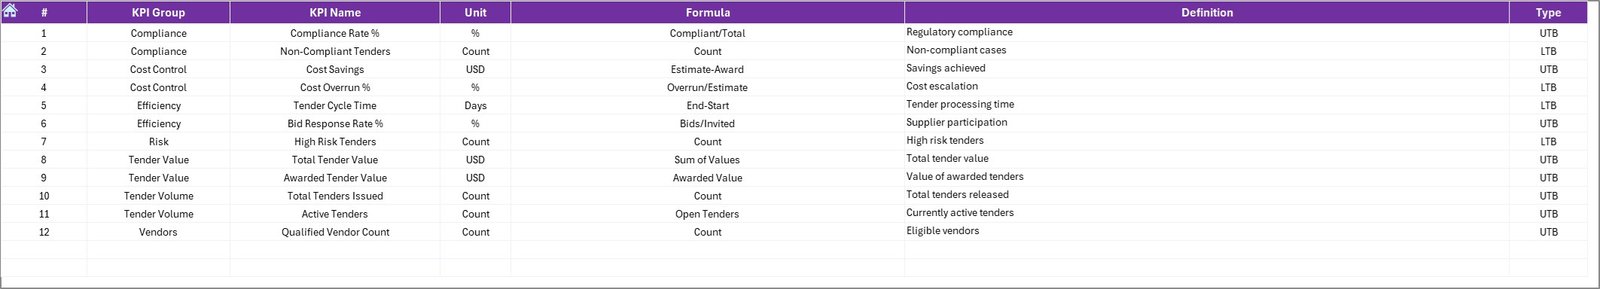
KPI Definition Sheet Tab
The KPI Definition Sheet defines the foundation of the dashboard.
It includes:
- KPI Name
- KPI Group
- KPI Unit
- KPI Formula
- KPI Definition
Because of this sheet, users maintain clarity and consistency across all KPIs.
Click to buy Health Tender KPI Dashboard in Excel
What Are Common KPIs in a Health Tender KPI Dashboard?
A Health Tender KPI Dashboard typically tracks KPIs related to cost, timelines, compliance, and efficiency.
Common KPI categories include:
Tender Efficiency KPIs
- Tender Cycle Time
- Bid Evaluation Duration
- Award Completion Time
Financial KPIs
- Tender Cost Variance
- Budget Utilization %
- Savings Achieved
Compliance KPIs
- Regulatory Compliance Rate
- Documentation Accuracy %
- Audit Findings Count
Supplier Performance KPIs
- Supplier Response Time
- Bid Acceptance Rate
- Contract Fulfillment %
Each KPI supports better governance and decision-making.
Advantages of Health Tender KPI Dashboard in Excel
A Health Tender KPI Dashboard in Excel delivers multiple operational and strategic advantages.
- Centralized Performance Monitoring
- All tender KPIs appear in one dashboard
- No need to review multiple files
- Faster Decision-Making
- Real-time MTD and YTD tracking
- Instant identification of delays or cost overruns
- Improved Transparency
- Clear comparison between Actual, Target, and Previous Year
- Supports audits and reviews
- Cost-Effective Solution
- No need for expensive BI tools
- Uses existing Excel infrastructure
- User-Friendly Design
- Simple drop-downs and buttons
- No advanced Excel skills required
Opportunities for Improvement in Health Tender KPI Tracking
Although Excel dashboards offer powerful insights, teams can improve effectiveness by focusing on the following:
- 📌 Standardizing KPI definitions across departments
- 📌 Automating data entry where possible
- 📌 Reviewing KPI targets quarterly
- 📌 Including risk-based KPIs
- 📌 Training staff on dashboard usage
By applying these improvements, healthcare organizations enhance KPI reliability.
Best Practices for the Health Tender KPI Dashboard in Excel
Following best practices ensures long-term dashboard success.
Data Management Best Practices
- Use consistent units for all KPIs
- Avoid manual overwriting of formulas
- Validate data before monthly updates
Dashboard Design Best Practices
- Limit KPIs to critical metrics
- Use conditional formatting wisely
- Keep layouts clean and readable
Governance Best Practices
- Review KPIs monthly
- Update targets annually
- Document KPI changes clearly
Because of these practices, dashboards remain accurate and decision-ready.
How Does a Health Tender KPI Dashboard Improve Compliance?
Healthcare tenders operate under strict regulations. Therefore, compliance tracking becomes essential.
A Health Tender KPI Dashboard improves compliance by:
- Tracking regulatory KPIs monthly
- Highlighting deviations early
- Supporting audit documentation
- Creating accountability across teams
As a result, organizations reduce compliance risks significantly.
Who Should Use a Health Tender KPI Dashboard in Excel?
This dashboard suits a wide range of healthcare stakeholders:
- Public health departments
- Government hospitals
- Medical procurement units
- Health ministries
- NGO healthcare programs
- Pharmaceutical tender teams
Because Excel remains widely used, adoption becomes fast and smooth.
Conclusion
A Health Tender KPI Dashboard in Excel transforms complex healthcare tender data into actionable insights. Instead of relying on scattered reports, healthcare organizations gain a centralized, transparent, and efficient performance monitoring system.
By using structured worksheets, dynamic dashboards, and trend analysis, teams improve decision-making, cost control, and compliance. Moreover, Excel keeps the solution affordable and accessible.
Therefore, if your organization manages healthcare tenders, implementing a Health Tender KPI Dashboard in Excel becomes a smart and strategic move.
Frequently Asked Questions (FAQs)
What is the purpose of a Health Tender KPI Dashboard in Excel?
The dashboard helps healthcare organizations monitor tender performance, costs, timelines, and compliance in one centralized system.
Can beginners use this dashboard easily?
Yes, the dashboard uses simple Excel features like drop-downs and buttons, making it easy for beginners.
How often should KPI data be updated?
Teams should update KPI data monthly to maintain accuracy and relevance.
Does the dashboard support year-over-year comparison?
Yes, the Previous Year Number Sheet enables strong year-over-year analysis.
Can organizations customize KPIs?
Yes, users can add, modify, or remove KPIs using the KPI Definition Sheet.
Is Excel secure for healthcare tender data?
Yes, when used with proper access controls and password protection, Excel remains secure.
Visit our YouTube channel to learn step-by-step video tutorials
Watch the step-by-step video tutorial:
Click to buy Health Tender KPI Dashboard in Excel