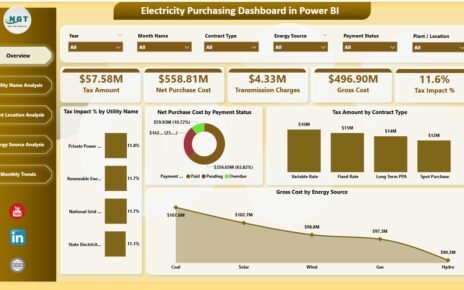
Managing port projects involves large budgets, multiple stakeholders, strict timelines, and high operational risks. Without a centralized reporting system, tracking project cost, progress, profit, and delays becomes extremely difficult. That is why organizations increasingly rely on a Port Project Management Dashboard in Power BI.
This ready-to-use dashboard gives a complete overview of port projects, financial performance, cost control, risk levels, and schedule efficiency. It helps management make faster decisions, reduce cost overruns, and improve project execution.
In this article, you will learn how this dashboard works, what each section represents, and how it helps port authorities and project teams manage performance efficiently.
✅ What Is a Port Project Management Dashboard in Power BI?
Click to Buy Port Project Management Dashboard in Power BI
A Port Project Management Dashboard is a visual analytics solution built in Power BI that tracks project performance across ports, contractors, locations, and timelines.
It helps you monitor:
-
Project progress
-
Budget vs actual cost
-
Revenue and profit
-
Schedule delays
-
Risk and SLA performance
-
Monthly and port-wise trends
Because it uses interactive charts and filters, users can quickly analyze large volumes of project data.
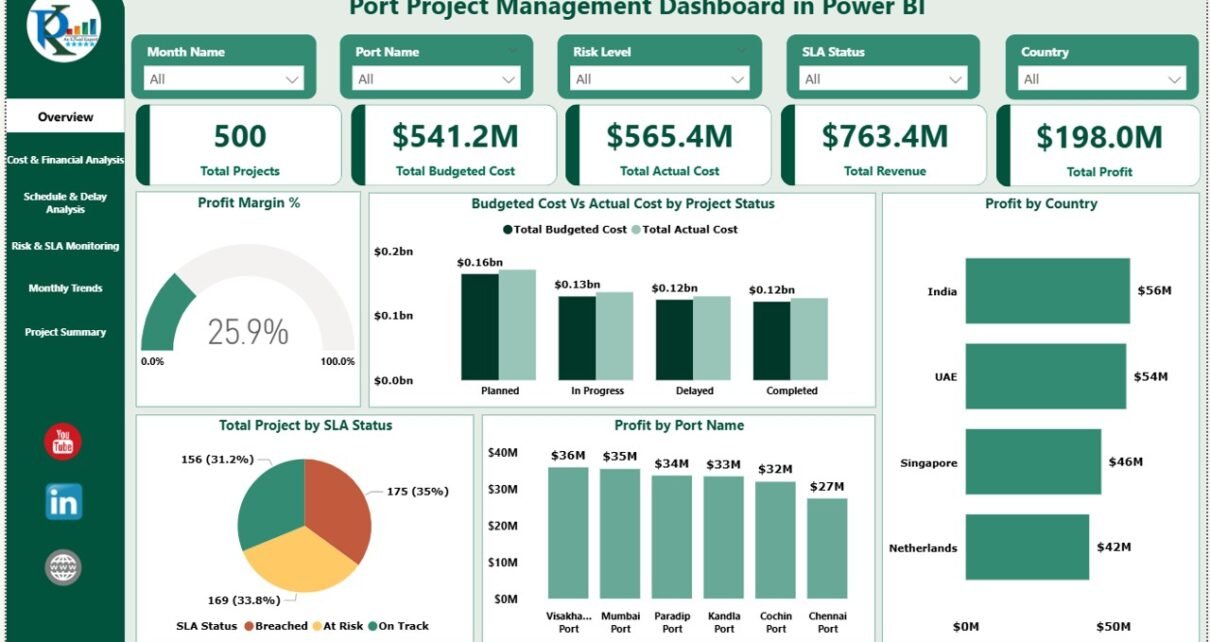
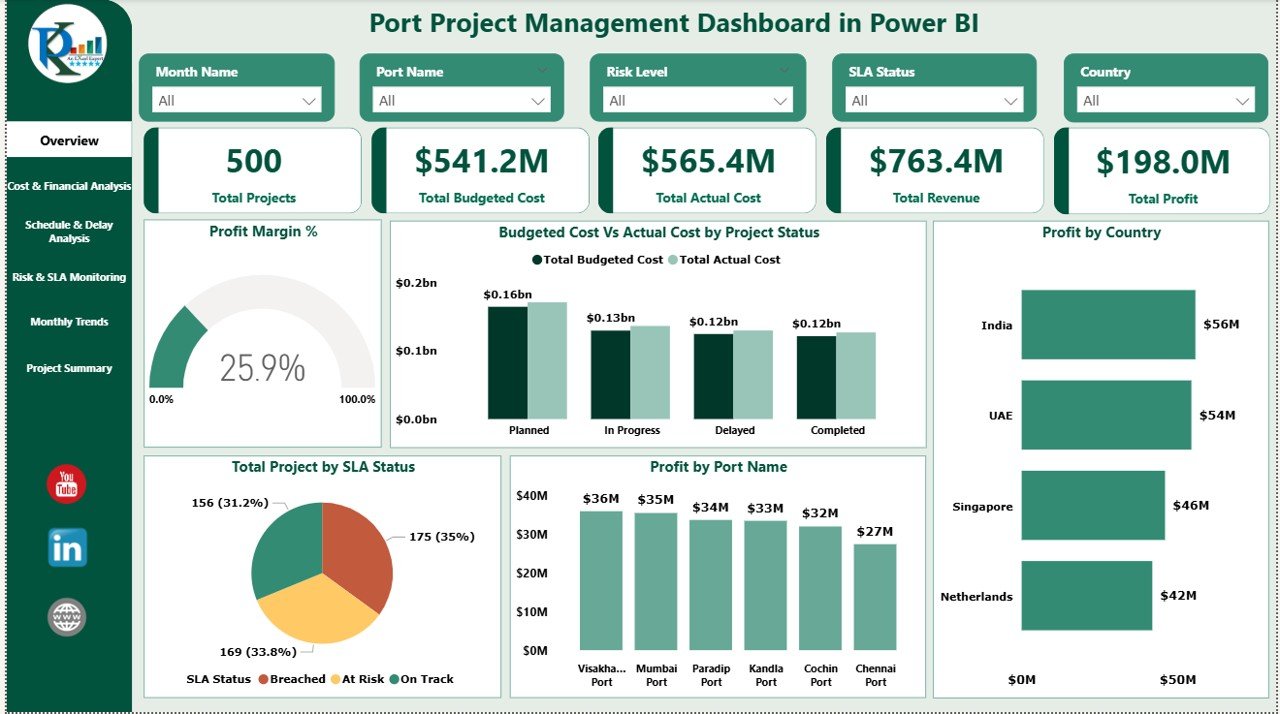
📊 Overview Sheet – Executive Summary
The Overview Sheet provides a high-level snapshot of all projects.
🔹 KPI Cards
These cards show real-time performance indicators:
-
Total Projects
-
Total Budgeted Cost
-
Total Actual Cost
-
Revenue
-
Profit
These KPIs help leadership instantly understand overall project health.
📈 Overview Charts
✔ Profit Margin %
Shows profitability efficiency across projects.
✔ Budgeted Cost vs Actual Cost by Project Status
Helps identify overspending and cost overruns.
✔ Profit by Country
Displays which countries contribute the most to profit.
✔ Profit by Port Name
Helps compare port-wise project profitability.
Click to Buy Port Project Management Dashboard in Power BI
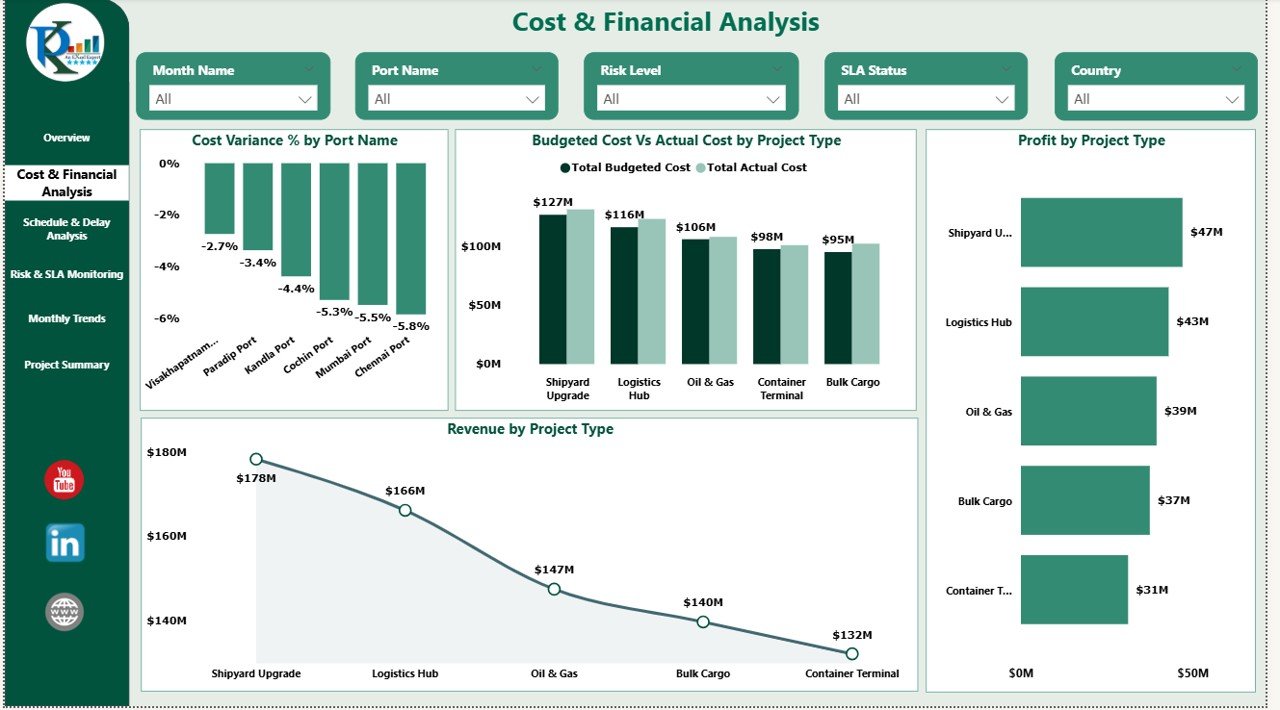
💰 Cost & Financial Analysis
This section focuses on financial control and cost efficiency.
📊 Charts Included:
✔ Cost Variance % by Port Name
Identifies ports with high budget deviation.
✔ Budgeted Cost vs Actual Cost by Project Type
Helps analyze cost performance by project category.
✔ Profit by Project Type
Shows which types of projects generate higher returns.
These insights help finance teams optimize budgets and reduce unnecessary expenses.
Click to Buy Port Project Management Dashboard in Power BI
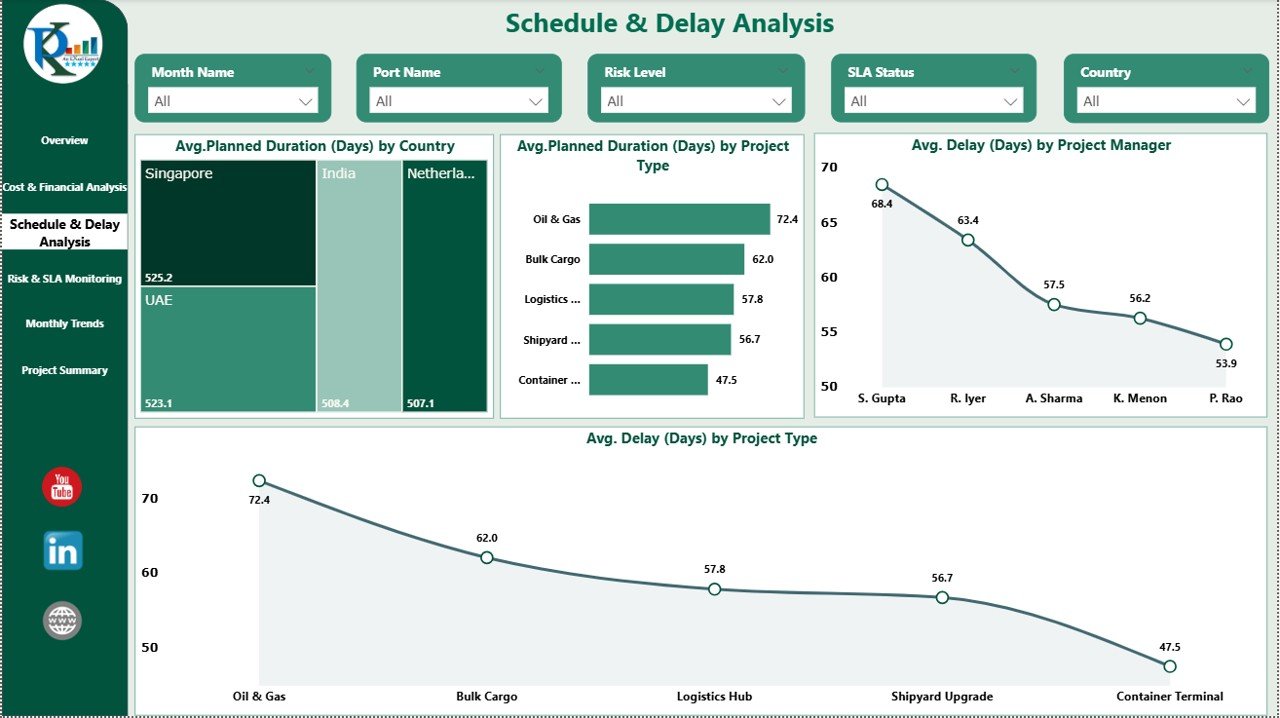
⏱️ Schedule & Delay Analysis
Delays increase costs and impact project delivery. This section highlights time-related KPIs.
📊 Charts Included:
✔ Average Planned Duration (Days) by Country
Shows average project duration across regions.
✔ Average Planned Duration (Days) by Project Type
Helps evaluate complexity by project category.
✔ Average Delay (Days) by Project Manager
Identifies project managers who need schedule support.
✔ Average Delay (Days) by Project Type
Helps prevent recurring delays.
This section improves planning accuracy and accountability.
Click to Buy Port Project Management Dashboard in Power BI
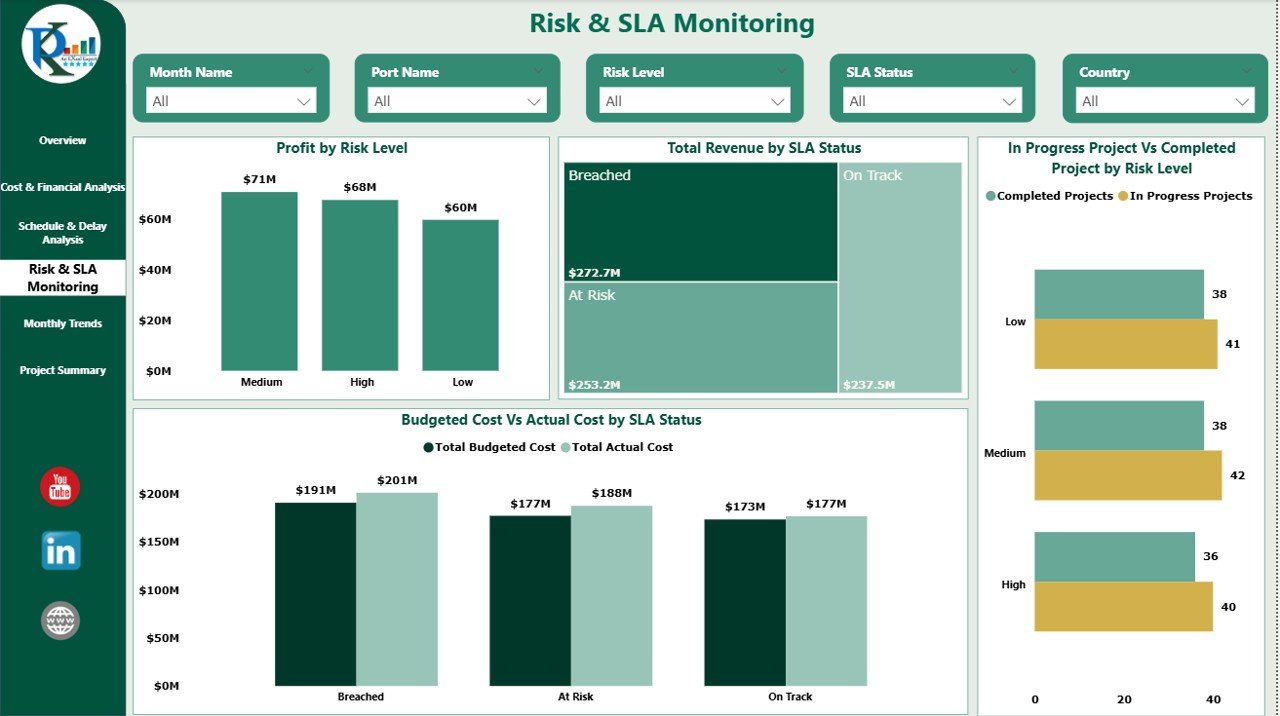
⚠️ Risk & SLA Monitoring
This section tracks operational risk and SLA performance.
📊 Charts Included:
✔ Profit by Risk Level
Shows profitability based on risk classification.
✔ Total Revenue by SLA Status
Highlights revenue performance by SLA compliance.
✔ In Progress vs Completed Projects by Risk Level
Helps assess execution efficiency.
✔ Budgeted Cost vs Actual Cost by SLA Status
Shows how SLA adherence impacts cost.
This section helps leadership manage risk exposure effectively.
Click to Buy Port Project Management Dashboard in Power BI
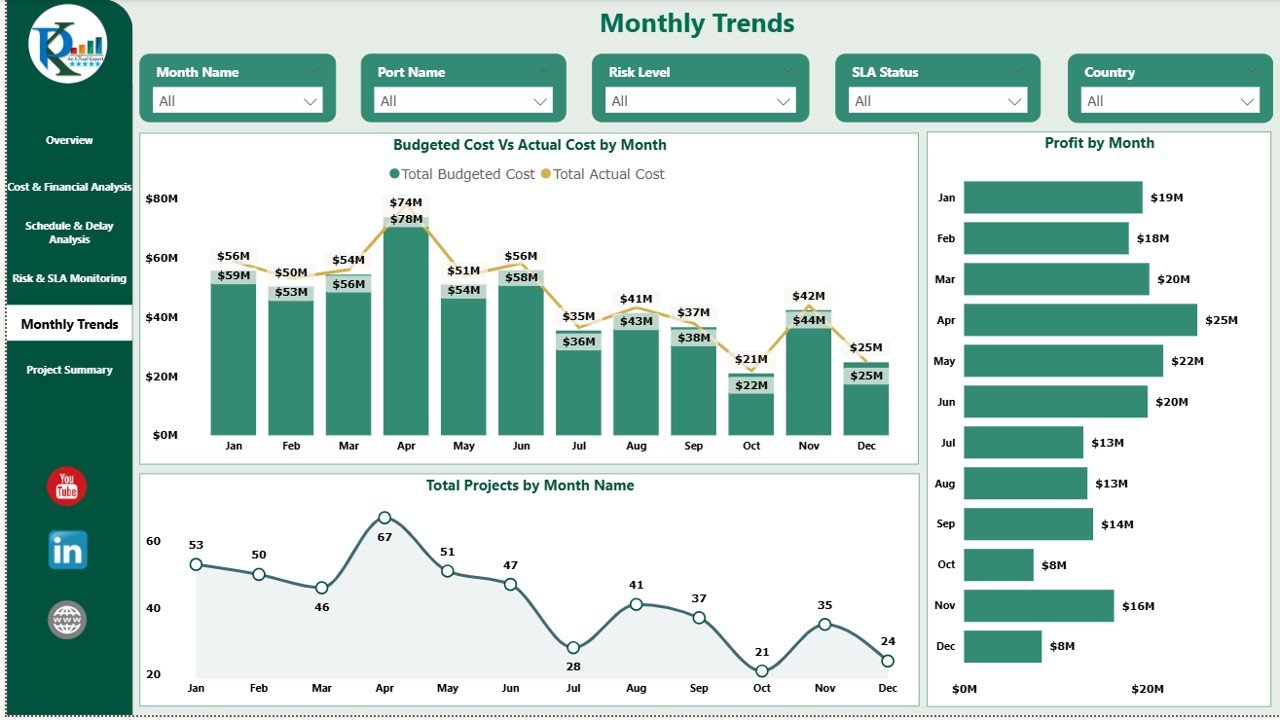
📆 Monthly Trends Analysis
Monthly tracking helps identify seasonal patterns and long-term performance.
📊 Charts Included:
✔ Budgeted Cost vs Actual Cost by Month
Tracks spending trends.
✔ Total Projects by Month
Shows workload distribution.
✔ Profit by Month
Helps evaluate financial performance over time.
Click to Buy Port Project Management Dashboard in Power BI
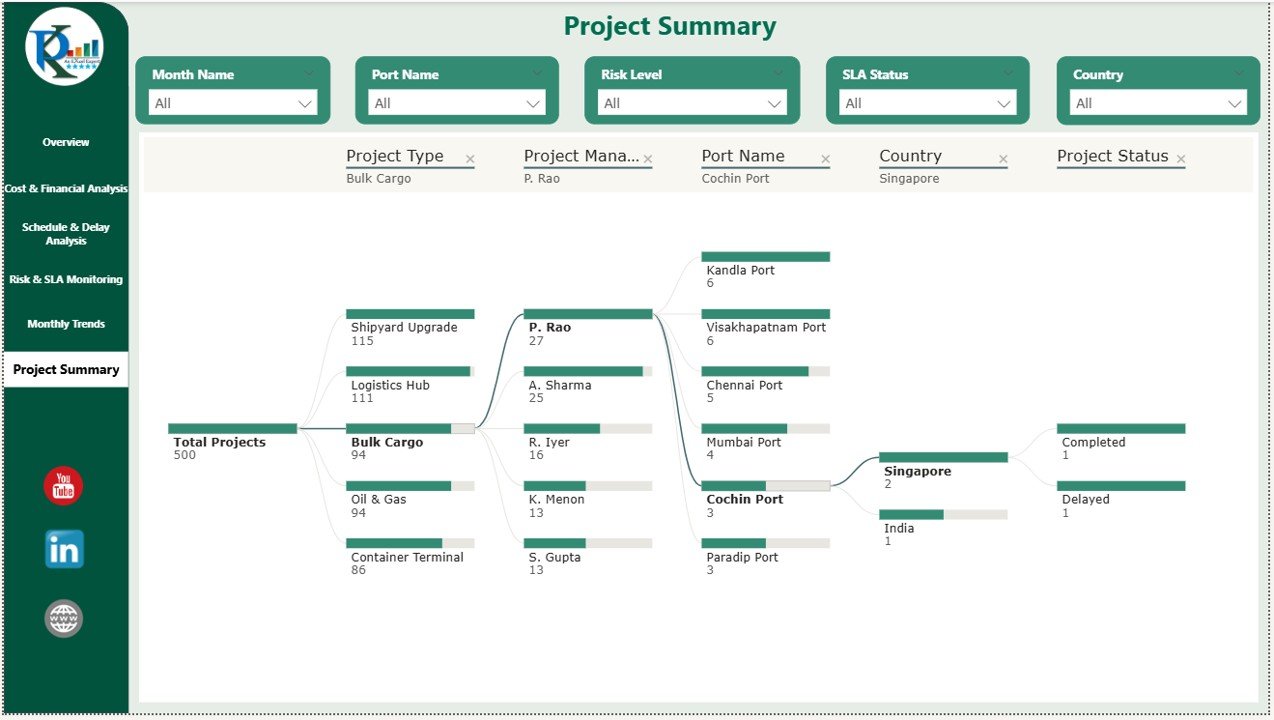
Project Summary – Decomposition View
The dashboard also includes a decomposition tree that allows users to drill down into:
-
Port
-
Country
-
Project Type
-
Risk Level
-
SLA Status
-
Cost or Revenue
This feature allows users to identify the root cause of cost overruns or low profit.
Click to Buy Port Project Management Dashboard in Power BI
Key Benefits of Port Project Management Dashboard
Centralized Project Monitoring
All project data available in one place.
Better Cost Control
Compare planned vs actual costs instantly.
Improved Decision-Making
Visual insights support faster actions.
Risk Identification
Identify high-risk and delayed projects easily.
Enhanced Performance Tracking
Monitor performance across ports, vendors, and managers.
Data-Driven Planning
Improve budgeting and forecasting accuracy.
Why Use Power BI for Port Project Management?
Click to Buy Port Project Management Dashboard in Power BI
Power BI provides:
-
Interactive dashboards
-
Real-time data refresh
-
Drill-down capabilities
-
User-friendly visuals
-
Secure access control
-
Easy integration with Excel & databases
It allows project managers and executives to analyze data without technical complexity.
Best Practices for Using This Dashboard
Update project data regularly
Review cost variance monthly
Track delays early
Monitor SLA compliance
Use filters for deeper insights
Compare monthly and yearly performance
Use dashboard in management reviews
Conclusion
Click to Buy Port Project Management Dashboard in Power BI
The Port Project Management Dashboard in Power BI is a powerful solution for tracking project performance, cost control, risk management, and profitability. It gives decision-makers complete visibility into port operations and ensures better project execution.
By using this dashboard, organizations can:
-
Improve financial discipline
-
Reduce delays
-
Increase profitability
-
Strengthen operational control
If you manage port projects, this dashboard becomes an essential tool for success.
Frequently Asked Questions (FAQs)
Q1. Who can use this dashboard?
Project managers, port authorities, finance teams, and executives.
Q2. Can I customize KPIs?
Yes, all visuals and metrics can be modified.
Q3. Is this dashboard suitable for large projects?
Yes, it works for both small and large port projects.
Q4. Can it handle multiple ports?
Yes, the dashboard supports multi-port analysis.
Q5. Does it support monthly tracking?
Yes, monthly trend analysis is built in.
Watch the step-by-step video tutorial:
Visit our YouTube channel to learn step-by-step video tutorials
Youtube.com/@NeotechNavigators
Click to Buy Port Project Management Dashboard in Power BI