Managing healthcare projects is never simple. Hospitals, healthcare organizations, and medical institutions handle multiple projects at the same time. These projects involve strict timelines, limited budgets, regulatory compliance, and quality standards. Therefore, project managers need a clear system to track performance, measure progress, and make informed decisions.
That is exactly where the Health Project Management KPI Dashboard in Excel becomes essential.
In this detailed guide, you will learn everything about the Health Project Management KPI Dashboard in Excel, including its structure, features, benefits, best practices, and real-world usage. Moreover, this article uses simple language, clear explanations, and practical examples to help you understand how this dashboard improves healthcare project performance.
Click to buy Health Project Management KPI Dashboard in Excel
What Is a Health Project Management KPI Dashboard in Excel?
A Health Project Management KPI Dashboard in Excel is a centralized reporting and performance-tracking tool that helps healthcare organizations monitor project execution, costs, timelines, and efficiency.
Instead of managing multiple spreadsheets, emails, and manual reports, this dashboard combines all project KPIs into a single interactive Excel file. As a result, project managers can analyze performance instantly and take corrective action on time.
Moreover, because the dashboard runs in Excel, teams can use it without learning complex BI tools or software.
Why Do Healthcare Organizations Need a KPI Dashboard?
Healthcare projects involve high responsibility. Delays or errors can affect patient care, budgets, and compliance. Therefore, organizations must track performance carefully.
Here is why a KPI dashboard becomes essential:
- It provides real-time visibility into project performance
- It reduces manual reporting efforts
- It improves accountability across departments
- It supports data-driven decisions
- It ensures better project planning and execution
Additionally, Excel-based dashboards offer flexibility, ease of use, and low implementation cost.
Overview of Health Project Management KPI Dashboard in Excel
This dashboard is designed as a ready-to-use KPI tracking system. It helps project managers monitor progress using structured data, visual charts, and dynamic calculations.
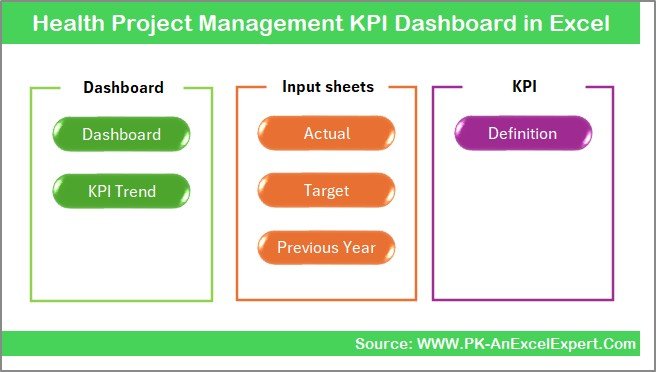
The dashboard includes 7 structured worksheets, each serving a specific purpose. Together, they form a complete project monitoring system.
Dashboard Structure and Worksheet Explanation
Let us understand each sheet in detail so you can use the dashboard effectively.
Summary Page – Central Navigation Hub
The Summary Page acts as the main index of the dashboard.
Key Features:
- Clean and user-friendly layout
- Six navigation buttons
- Easy movement between all dashboard sheets
- Designed for quick access
This page improves usability because users can move between sections without scrolling or searching.
Click to buy Health Project Management KPI Dashboard in Excel
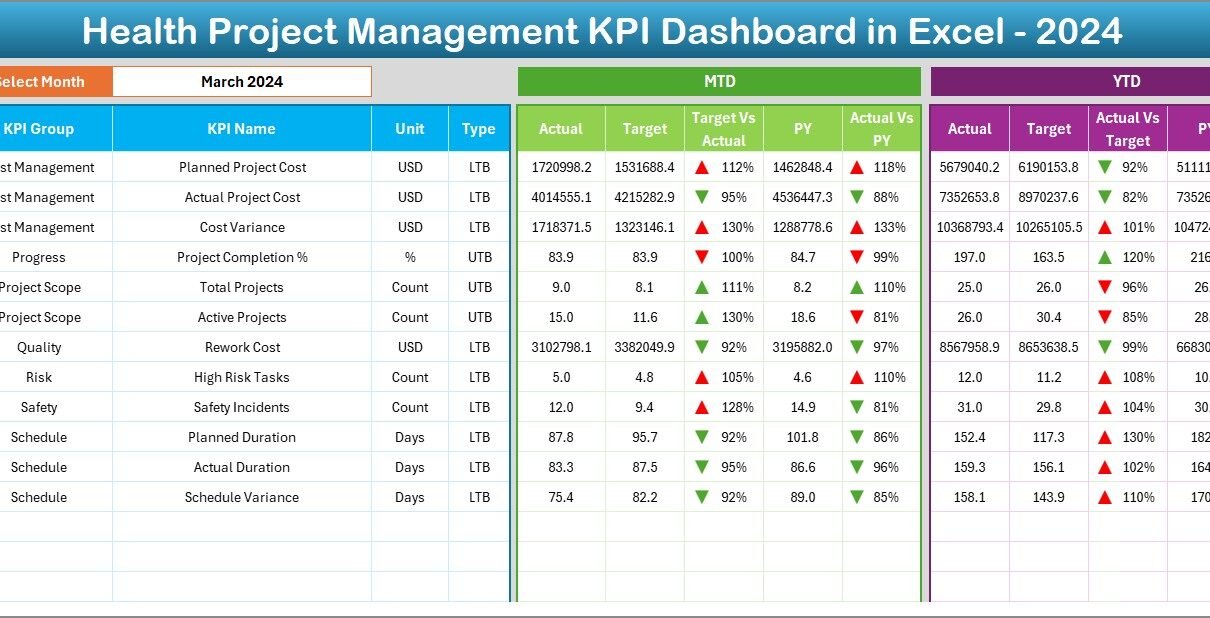
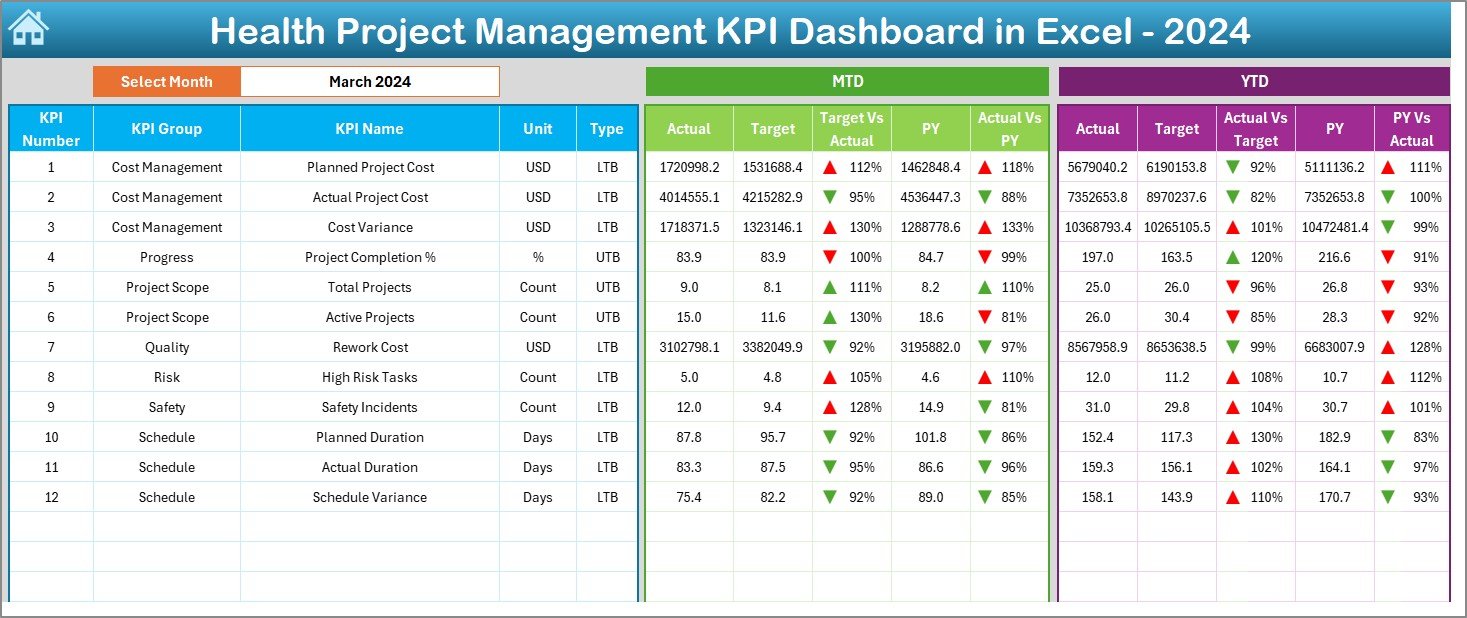
Dashboard Sheet – Main KPI View
The Dashboard Sheet is the most important part of the file. It displays all KPIs in a visual and analytical format.
Key Highlights:
- Month selection dropdown at Cell D3
Automatic data update based on selected month
Displays:
MTD Actual
MTD Target
Previous Year values
Target vs Actual comparison
Previous Year vs Actual comparison
Visual Features:
Conditional formatting arrows
Color-coded performance indicators
Easy-to-read KPI cards
Clear variance analysis
Because of these features, decision-makers can instantly understand performance without reading large data tables.
Click to buy Health Project Management KPI Dashboard in Excel
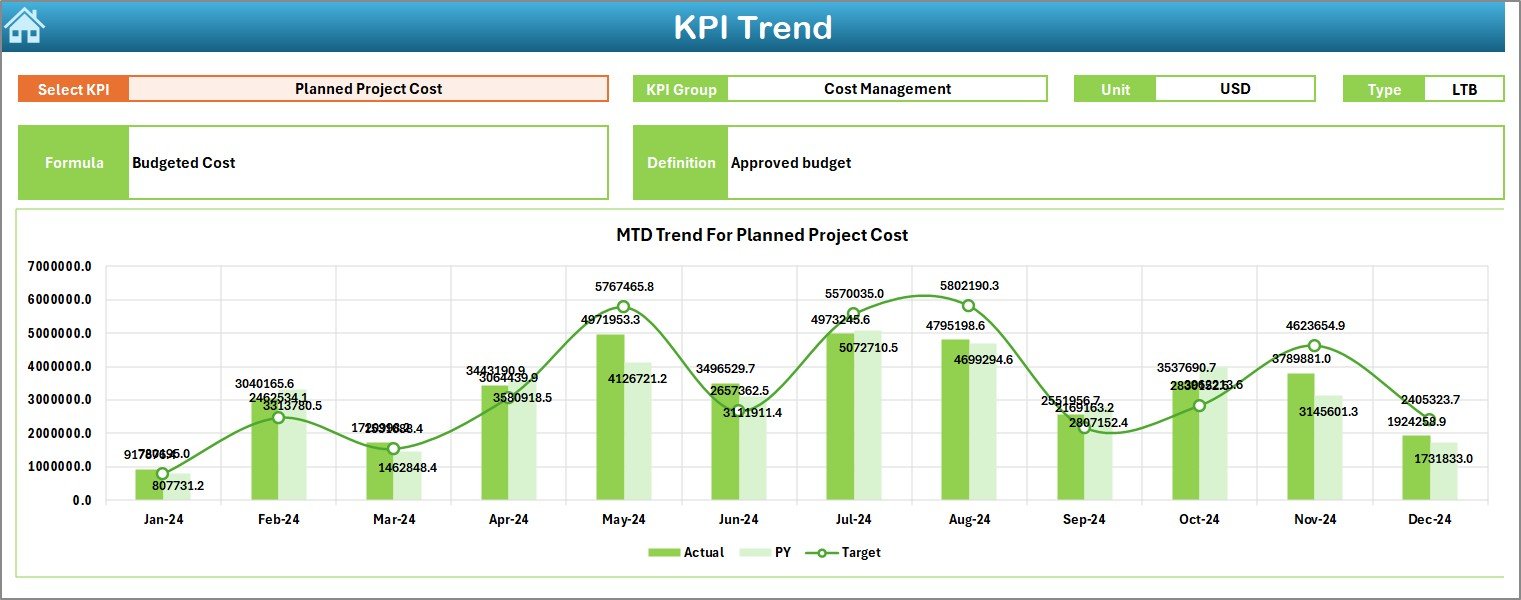
Trend Sheet – KPI Performance Analysis
The Trend Sheet focuses on performance trends over time.
What You Can Do Here:
- Select KPI from dropdown (Cell C3)
- View KPI Group
- See KPI Unit
- Check KPI Type (UTB or LTB)
- Review KPI Formula
- Understand KPI Definition
Visual Analysis:
- MTD Trend Chart
- YTD Trend Chart
- Comparison of Actual, Target, and Previous Year
This sheet helps managers identify improvement patterns, performance drops, and long-term trends easily.
Click to buy Health Project Management KPI Dashboard in Excel
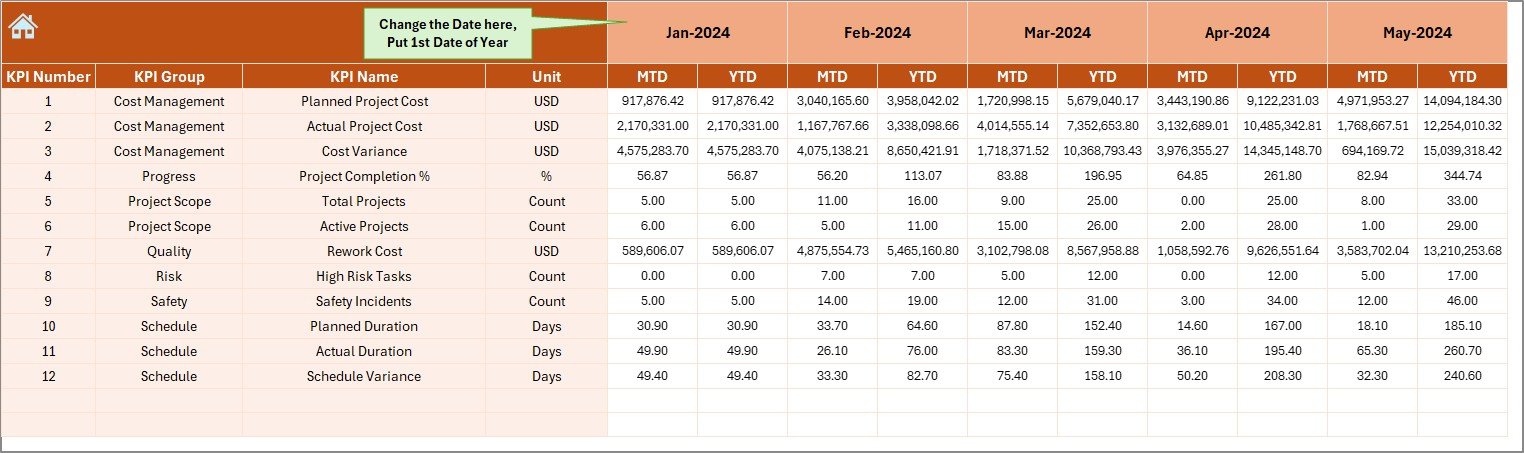
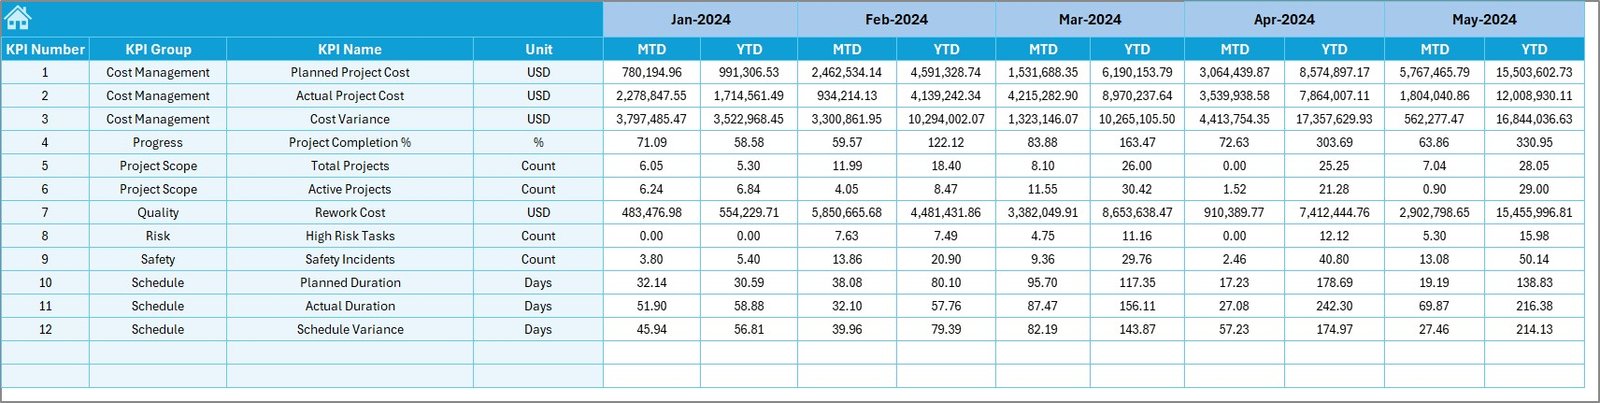
Actual Numbers Input Sheet
This sheet is used to enter actual project performance values.
Key Features:
- Monthly data entry
- MTD and YTD input fields
- Month selection using Cell E1
- Easy data entry layout
You only need to enter data once, and the dashboard updates automatically.
Click to buy Health Project Management KPI Dashboard in Excel
Target Sheet
The Target Sheet allows you to define performance goals.
What You Can Enter:
- Monthly KPI targets
- Year-to-date targets
- KPI-wise targets
This sheet helps organizations align performance goals with business objectives.
Click to buy Health Project Management KPI Dashboard in Excel
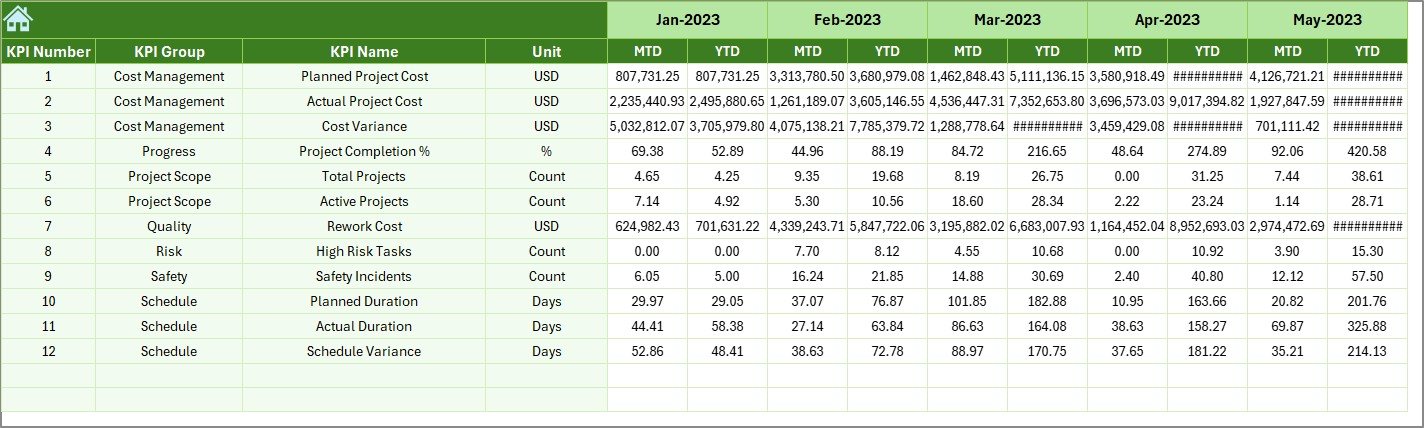
Previous Year Numbers Sheet
This sheet stores historical data for comparison.
Why This Sheet Matters:
- Enables year-over-year analysis
- Helps track performance growth
- Supports benchmarking
- Improves forecasting accuracy
By comparing current data with past performance, teams can identify improvement areas quickly.
Click to buy Health Project Management KPI Dashboard in Excel
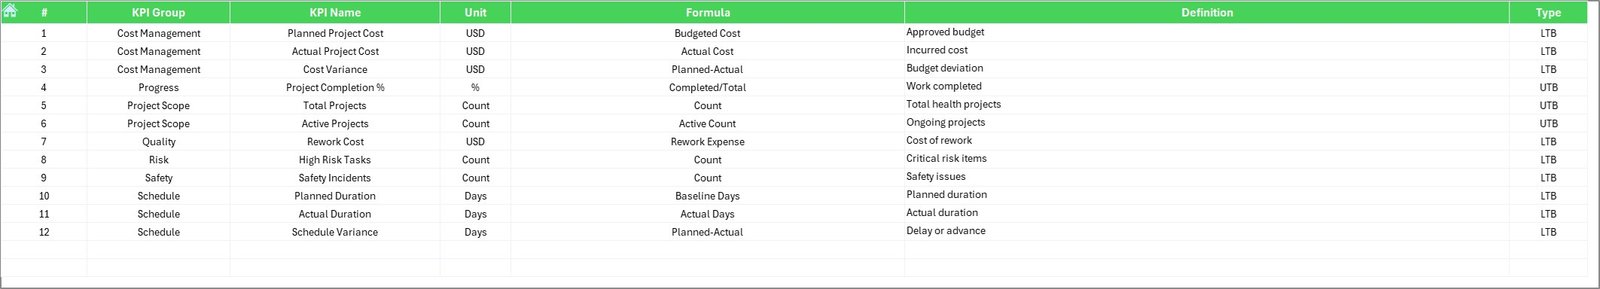
KPI Definition Sheet
The KPI Definition Sheet works as a reference guide.
It Includes:
- KPI Name
- KPI Group
- Unit of Measurement
- KPI Formula
- KPI Definition
This sheet ensures clarity and consistency across teams. Everyone understands what each KPI means and how it is calculated.
Click to buy Health Project Management KPI Dashboard in Excel
What KPIs Can You Track Using This Dashboard?
You can track multiple healthcare project KPIs, including:
- Project Completion Rate
- Schedule Variance
- Cost Variance
- Budget Utilization
- Resource Utilization
- Task Completion Rate
- Delay Percentage
- Project Efficiency Score
- Quality Compliance Rate
- Risk Resolution Rate
Because the dashboard is customizable, you can add or remove KPIs based on your project needs.
Advantages of Health Project Management KPI Dashboard in Excel
Improves Decision-Making
The dashboard provides real-time insights, which help managers make faster and better decisions.
Saves Time
Automated calculations reduce manual reporting effort significantly.
Enhances Transparency
All stakeholders can see project performance clearly.
Improves Accountability
KPI tracking ensures responsibility at every project stage.
Easy to Use
No coding or BI knowledge required.
Cost-Effective
Works entirely in Excel without expensive tools.
Customizable
You can modify KPIs, charts, and layouts easily.
How Does This Dashboard Help Healthcare Organizations?
Healthcare organizations manage complex projects such as:
- Hospital construction
- System upgrades
- Equipment installation
- Digital transformation
- Compliance projects
This dashboard helps by:
- Tracking timelines accurately
- Monitoring budget usage
- Identifying delays early
- Improving communication
- Supporting management reporting
As a result, organizations improve efficiency and reduce risks.
Best Practices for Using Health Project Management KPI Dashboard
Update Data Regularly
Always enter actual and target data on time to keep insights accurate.
Use Standard KPI Definitions
Ensure everyone follows the same KPI definitions to avoid confusion.
Review Dashboard Weekly
Frequent reviews help identify issues early.
Use Conditional Formatting
Visual indicators improve interpretation and decision-making.
Track Trends, Not Just Numbers
Trend analysis helps predict future performance.
Maintain Data Accuracy
Clean and validated data ensures reliable results.
Train Team Members
Ensure all users understand how to read and update the dashboard.
How to Get Maximum Value from This Dashboard
To maximize benefits, follow these steps:
- Define clear project KPIs
- Set realistic targets
- Update data consistently
- Review dashboard weekly
- Use insights for action planning
- Share dashboard with stakeholders
When used correctly, this dashboard becomes a powerful project management tool.
Who Should Use This Dashboard?
This dashboard is ideal for:
- Healthcare Project Managers
- Hospital Administrators
- Healthcare Consultants
- PMO Teams
- Quality Managers
- Operations Managers
- Finance and Planning Teams
It works well for both small clinics and large healthcare institutions.
Conclusion
The Health Project Management KPI Dashboard in Excel is a powerful, practical, and easy-to-use solution for managing healthcare projects efficiently.
It centralizes all project data, simplifies performance tracking, improves transparency, and supports data-driven decisions. Moreover, its Excel-based structure makes it accessible to every organization without additional software costs.
By using this dashboard, healthcare teams can improve productivity, reduce delays, and ensure successful project execution.
Frequently Asked Questions (FAQs)
- What is a Health Project Management KPI Dashboard?
A Health Project Management KPI Dashboard is an Excel-based tool used to track, analyze, and visualize healthcare project performance using key metrics.
- Can I customize the KPIs in this dashboard?
Yes, you can easily add, remove, or modify KPIs based on your project needs.
- Does this dashboard require Excel macros?
No, the dashboard works without macros and uses standard Excel formulas and charts.
- Can I track multiple projects in one dashboard?
Yes, you can manage multiple projects by adding project-specific KPIs and filters.
- Is this dashboard suitable for hospitals and clinics?
Absolutely. It works perfectly for hospitals, clinics, healthcare consultants, and project teams.
- How often should I update the dashboard?
You should update it monthly or weekly, depending on your reporting cycle.
- Can beginners use this dashboard?
Yes, the dashboard is user-friendly and does not require advanced Excel skills.
Visit our YouTube channel to learn step-by-step video tutorials
Click to buy Health Project Management KPI Dashboard in Excel