Managing contracts in a port environment is never simple. Ports deal with multiple vendors, shipping lines, service providers, and regulatory bodies every single day. Because of this, tracking performance manually becomes time-consuming and error-prone. That is exactly where the Port Contract Management KPI Dashboard in Power BI plays a vital role.
In this detailed article, you will learn everything about the Port Contract Management KPI Dashboard in Power BI, including its structure, features, advantages, best practices, and real-world usage. Moreover, this guide explains everything in a simple and easy-to-understand manner so that both beginners and professionals can use it effectively.
Click to buy Port Contract Management KPI Dashboard in Power BI
What Is a Port Contract Management KPI Dashboard in Power BI?
A Port Contract Management KPI Dashboard in Power BI is a dynamic reporting and analytics tool designed to monitor contract performance, compliance, and efficiency across port operations.
Instead of managing multiple Excel files and manual reports, this dashboard brings all contract-related KPIs into a single interactive Power BI report. As a result, port managers can track performance, compare targets, and identify risks in real time.
Moreover, this dashboard uses Excel as a data source, which makes it easy to maintain and update without technical complexity.
Why Do Ports Need a Contract Management KPI Dashboard?
Ports handle hundreds of contracts related to:
- Cargo handling
- Terminal operations
- Equipment leasing
- Maintenance services
- Logistics vendors
- Security and compliance
Because of this complexity, decision-makers need a centralized and visual system to track performance.
Monitor contract performance
Track targets vs actual values
Identify underperforming contracts
Improve compliance
Reduce operational risks
Improve decision-making speed
Therefore, a Power BI–based KPI dashboard becomes an essential management tool.
Overview of the Port Contract Management KPI Dashboard
This ready-to-use Power BI dashboard is designed with clarity and usability in mind. It uses Excel as the backend data source and Power BI for visualization.
Dashboard Structure
The dashboard contains 3 main pages:
- Summary Page
- KPI Trend Page
- KPI Definition Page (Drill-Through)
Each page plays a unique role in analyzing contract performance.
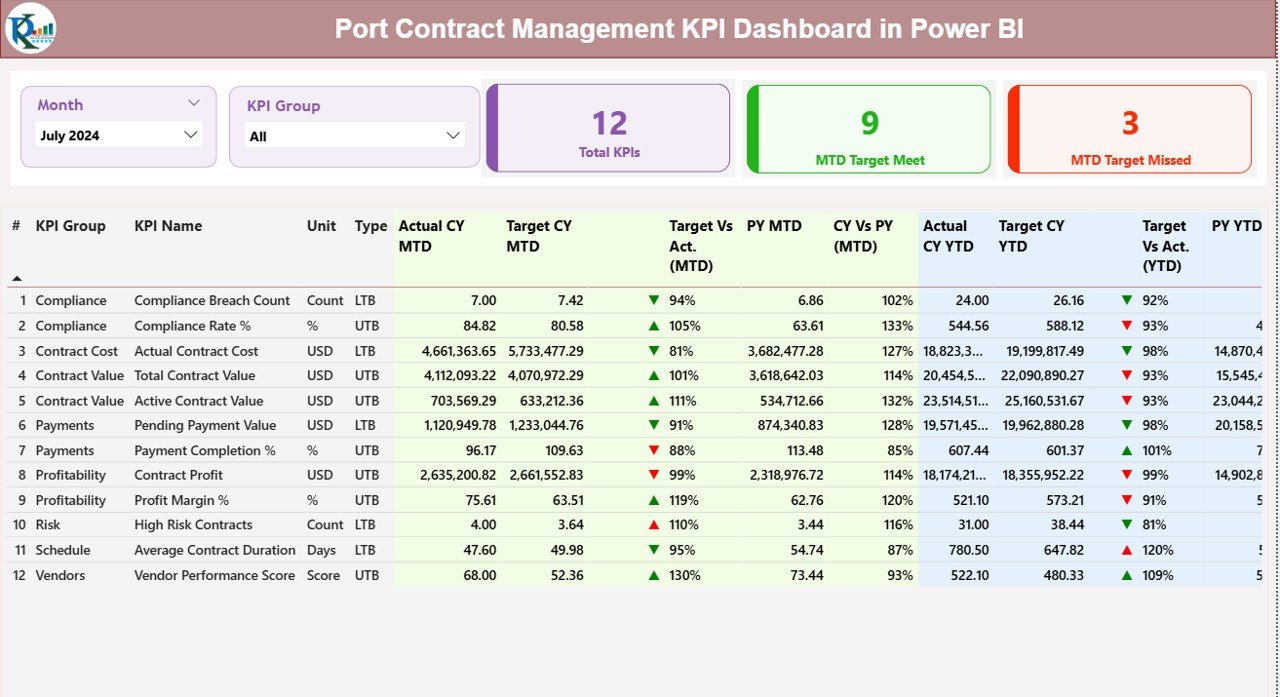
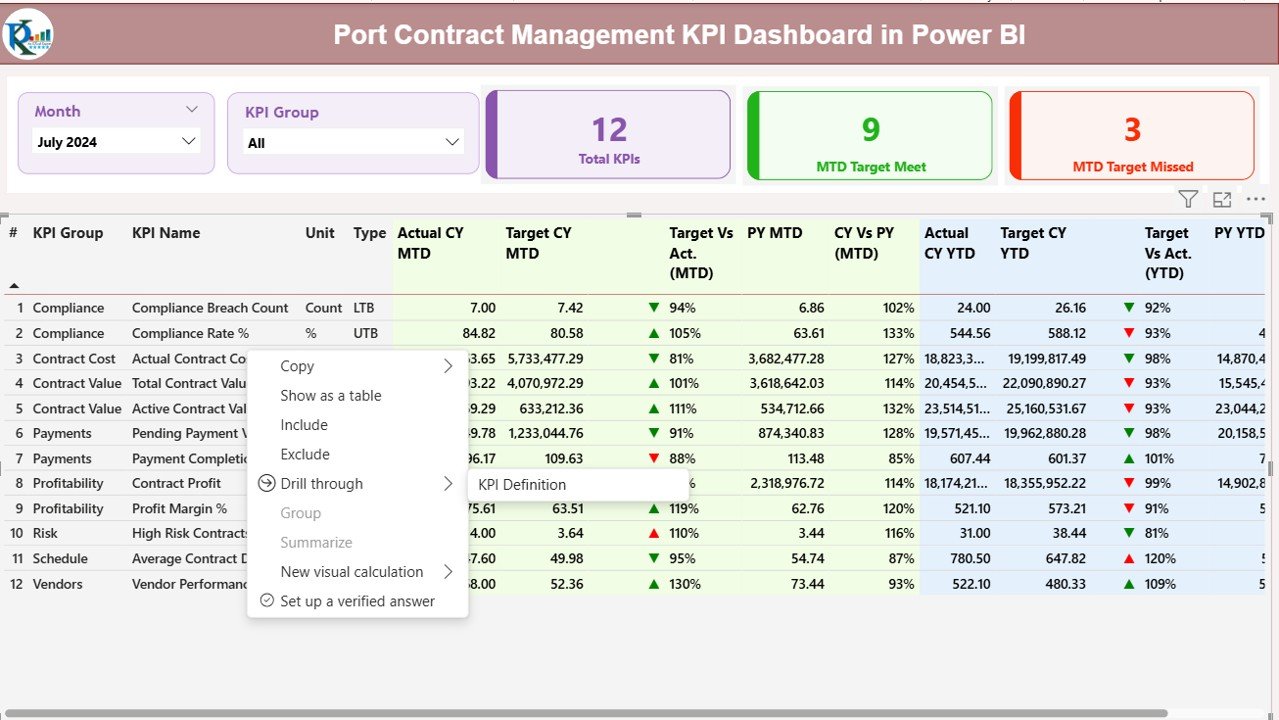
Summary Page – Complete Performance Overview
The Summary Page acts as the main dashboard view. It gives users a quick and clear overview of all KPIs.
Key Elements of the Summary Page
Slicers
- Month Slicer – Select a specific month
- KPI Group Slicer – Filter KPIs by category
These slicers help users analyze data dynamically.
KPI Summary Cards
At the top of the page, you will find three key cards:
- Total KPI Count
- MTD Target Met Count
- MTD Target Missed Count
These cards instantly show how many KPIs are performing well and how many need attention.
Click to buy Port Contract Management KPI Dashboard in Power BI
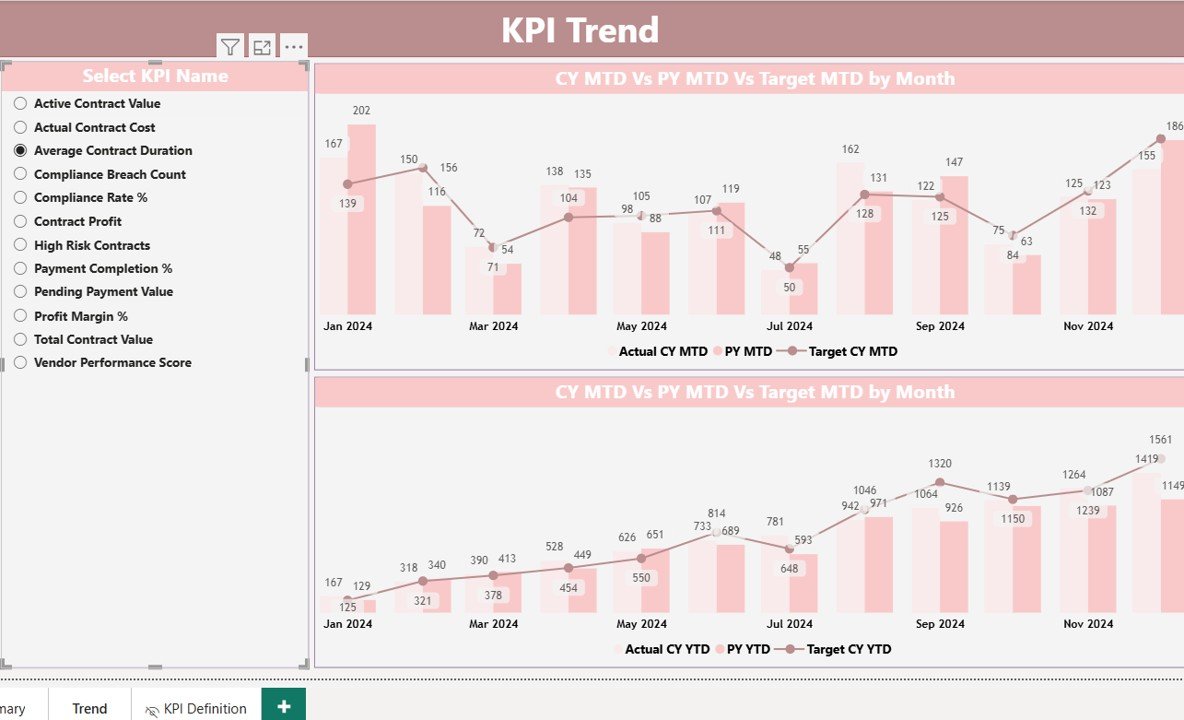
KPI Trend Page – Performance Visualization
The KPI Trend Page focuses on trend analysis.
What This Page Shows
Two interactive combo charts
Actual vs Target comparison
Current Year vs Previous Year analysis
MTD and YTD performance trends
KPI Selector
A slicer on the left allows users to select any KPI. Once selected, all visuals update automatically.
This feature helps decision-makers:
- Identify trends
- Analyze performance changes
- Detect seasonal patterns
- Track improvements or declines
Click to buy Port Contract Management KPI Dashboard in Power BI
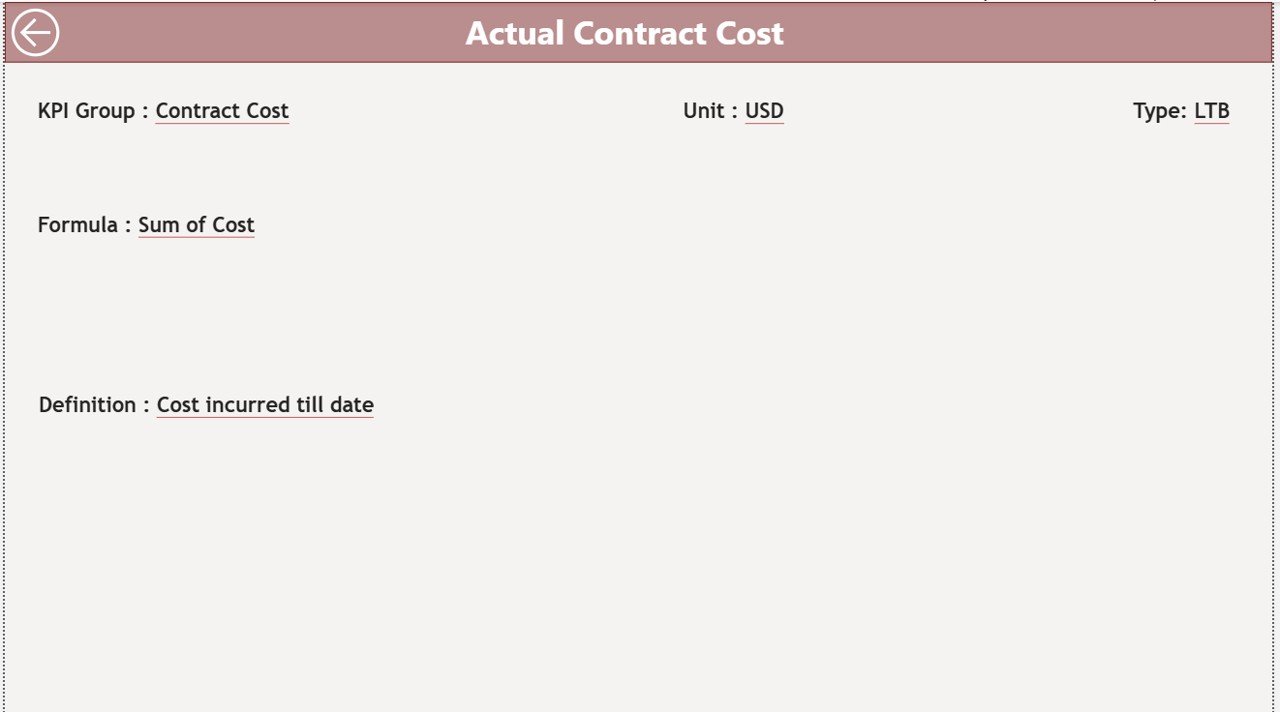
KPI Definition Page – Detailed KPI Explanation
The KPI Definition Page is a hidden drill-through page.
Purpose of This Page
- Shows KPI formula
- Explains KPI meaning
- Displays unit and type
- Provides business context
Users can access this page by right-clicking a KPI from the Summary Page.
Navigation Feature
A Back button allows users to return to the main dashboard easily.
Click to buy Port Contract Management KPI Dashboard in Power BI
Excel Data Structure Used in the Dashboard
The dashboard uses Excel as its data source. This design makes it flexible and user-friendly.
Input_Actual Sheet
This sheet stores actual KPI values.
Fields include:
- KPI Name
- Month (First date of the month)
- MTD Value
- YTD Value
Input_Target Sheet
This sheet stores target values.
Fields include:
- KPI Name
- Month
- MTD Target
- YTD Target
KPI Definition Sheet
This sheet defines KPI logic.
Fields include:
- KPI Number
- KPI Group
- KPI Name
- Unit
- Formula
- Definition
- KPI Type (LTB / UTB)
Click to buy Port Contract Management KPI Dashboard in Power BI
Advantages of Port Contract Management KPI Dashboard in Power BI
Centralized Performance Monitoring
You can view all contract KPIs in one place without switching between files.
Real-Time Insights
Because Power BI updates data dynamically, users always see the latest performance.
Better Decision-Making
Visual charts and indicators help management take faster and smarter decisions.
Improved Accountability
KPI tracking ensures teams remain accountable for performance.
Time-Saving Reporting
Automated dashboards reduce manual reporting effort.
Easy Scalability
You can easily add new KPIs or categories without redesigning the dashboard.
Best Practices for Using Port Contract Management KPI Dashboard
Keep KPI Definitions Clear
Always define KPIs clearly to avoid confusion.
Update Data Regularly
Update Excel data monthly to keep insights accurate.
Use Consistent Units
Maintain consistency in units across KPIs.
Monitor Trends, Not Just Numbers
Always analyze trends instead of only looking at current values.
Review KPIs Monthly
Regular review helps detect issues early.
Limit the Number of KPIs
Focus on critical KPIs instead of tracking too many metrics.
Who Can Use This Dashboard?
This dashboard works perfectly for:
- Port Authorities
- Terminal Managers
- Contract Managers
- Operations Managers
- Logistics Teams
- Performance Analysts
- Senior Management
Why Choose Power BI for Contract Management?
Power BI offers:
Interactive visuals
High performance
Easy integration with Excel
User-friendly interface
Strong data modeling
Secure access
Therefore, Power BI becomes the ideal choice for contract performance tracking.
Conclusion
The Port Contract Management KPI Dashboard in Power BI is a powerful and practical solution for tracking contract performance efficiently. It simplifies complex data, improves visibility, and supports data-driven decisions.
By using this dashboard, port organizations can:
- Improve contract compliance
- Track performance accurately
- Reduce operational risks
- Improve transparency
- Enhance strategic planning
Moreover, its Excel-based data structure makes it easy to maintain and scale.
If you want better control over your port contracts, this dashboard is the perfect solution.
Frequently Asked Questions (FAQs)
- What is a Port Contract Management KPI Dashboard?
It is a Power BI dashboard that tracks contract performance, targets, and trends using KPIs.
- Can I use Excel as a data source?
Yes. The dashboard uses Excel files for input data.
- What KPIs can I track?
You can track MTD, YTD, target vs actual, and year-over-year performance.
- Is this dashboard customizable?
Yes. You can add new KPIs, modify visuals, and change calculations.
- Who should use this dashboard?
Port managers, contract managers, analysts, and operations teams.
- Does it support drill-through analysis?
Yes. You can drill down to view KPI definitions and formulas.
- Can I use it for multiple ports?
Yes. You can extend the model to include multiple port locations.
Visit our YouTube channel to learn step-by-step video tutorials
Watch the step-by-step video tutorial:
Click to buy Port Contract Management KPI Dashboard in Power BI