Managing electricity purchasing without a structured performance system often creates cost overruns, missed savings opportunities, and unclear reporting. Many organizations still rely on multiple Excel sheets, emails, and manual calculations. As a result, decision-makers struggle to track purchasing efficiency and compare performance accurately.
That is exactly why an Electricity Purchasing KPI Dashboard in Excel becomes a powerful and practical solution.
In this detailed article, you will learn everything about the Electricity Purchasing KPI Dashboard in Excel, including its structure, worksheets, advantages, best practices, and real-world use cases. Moreover, this guide explains how Excel dashboards transform complex electricity purchasing data into clear and actionable insights.
Click to buy Electricity Purchasing KPI Dashboard in Excel
What Is an Electricity Purchasing KPI Dashboard in Excel?
An Electricity Purchasing KPI Dashboard in Excel is a structured and interactive reporting tool designed to track, analyze, and monitor key performance indicators related to electricity procurement and purchasing.
Instead of managing scattered files, this dashboard consolidates all purchasing KPIs into one centralized Excel file. Consequently, procurement teams gain instant visibility into costs, targets, trends, and performance gaps.
Because Excel supports formulas, pivot tables, charts, slicers, and conditional formatting, this dashboard delivers powerful insights without complex software or advanced technical skills.
Why Do Organizations Need an Electricity Purchasing KPI Dashboard?
Electricity purchasing involves high costs, long-term contracts, and frequent price fluctuations. Therefore, organizations need continuous performance monitoring to control spending and improve efficiency.
An Electricity Purchasing KPI Dashboard in Excel helps organizations:
- Track electricity purchase costs in real time
- Compare actual spending against targets
- Monitor month-to-date (MTD) and year-to-date (YTD) performance
- Identify cost overruns early
- Improve negotiation and procurement decisions
As a result, procurement teams gain clarity, control, and confidence.
What Are the Key Features of the Electricity Purchasing KPI Dashboard in Excel?
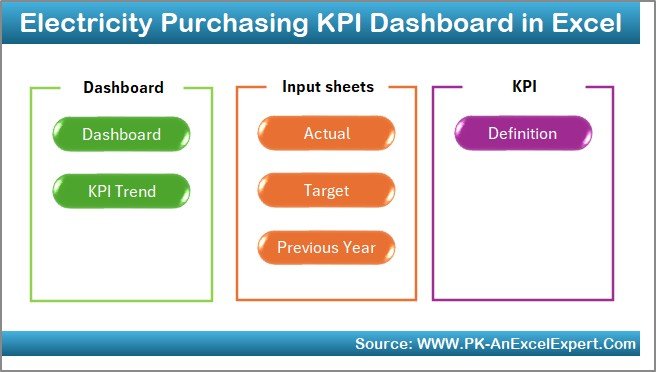
This Electricity Purchasing KPI Dashboard in Excel includes 7 structured worksheets, each designed for a specific purpose. Together, these sheets create a complete performance monitoring system.
Let us explore each worksheet in detail.
What Is the Summary Page in the Electricity Purchasing KPI Dashboard?
Summary Page (Index Sheet)
The Summary Page acts as the navigation hub of the dashboard.
On this sheet:
- You will find 6 interactive buttons
- Each button links directly to a specific worksheet
- Users can move quickly between dashboard sections
As a result, users save time and avoid confusion while navigating the file.
This page improves usability and ensures a smooth dashboard experience.
Click to buy Electricity Purchasing KPI Dashboard in Excel
How Does the Dashboard Sheet Work?
Dashboard Sheet Tab
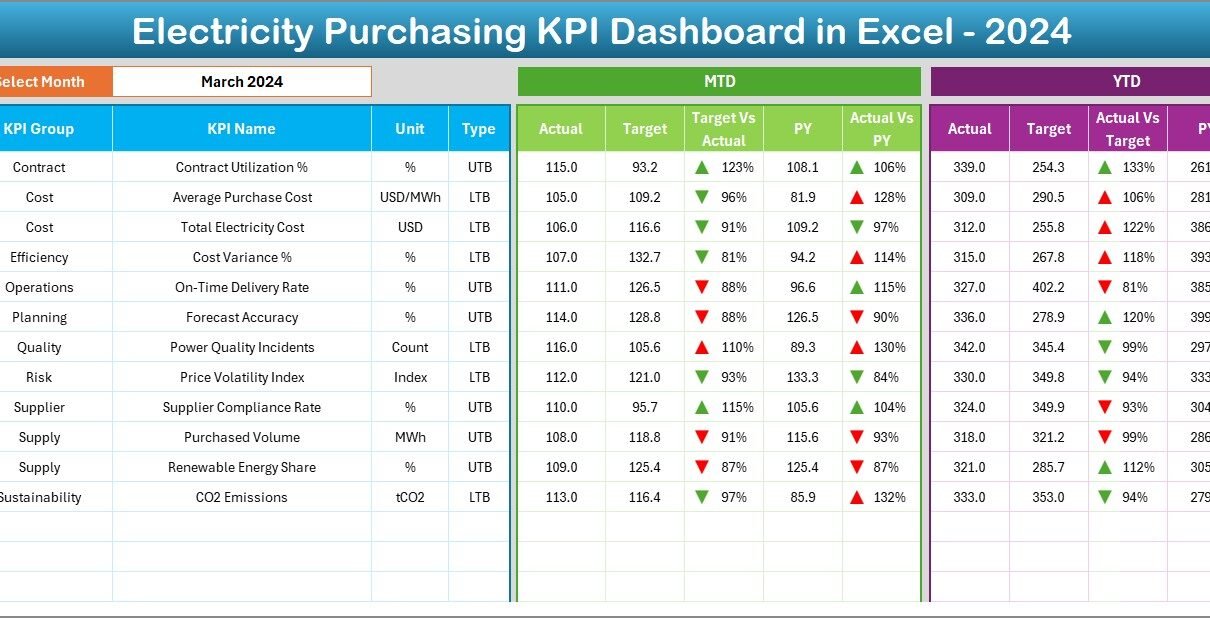
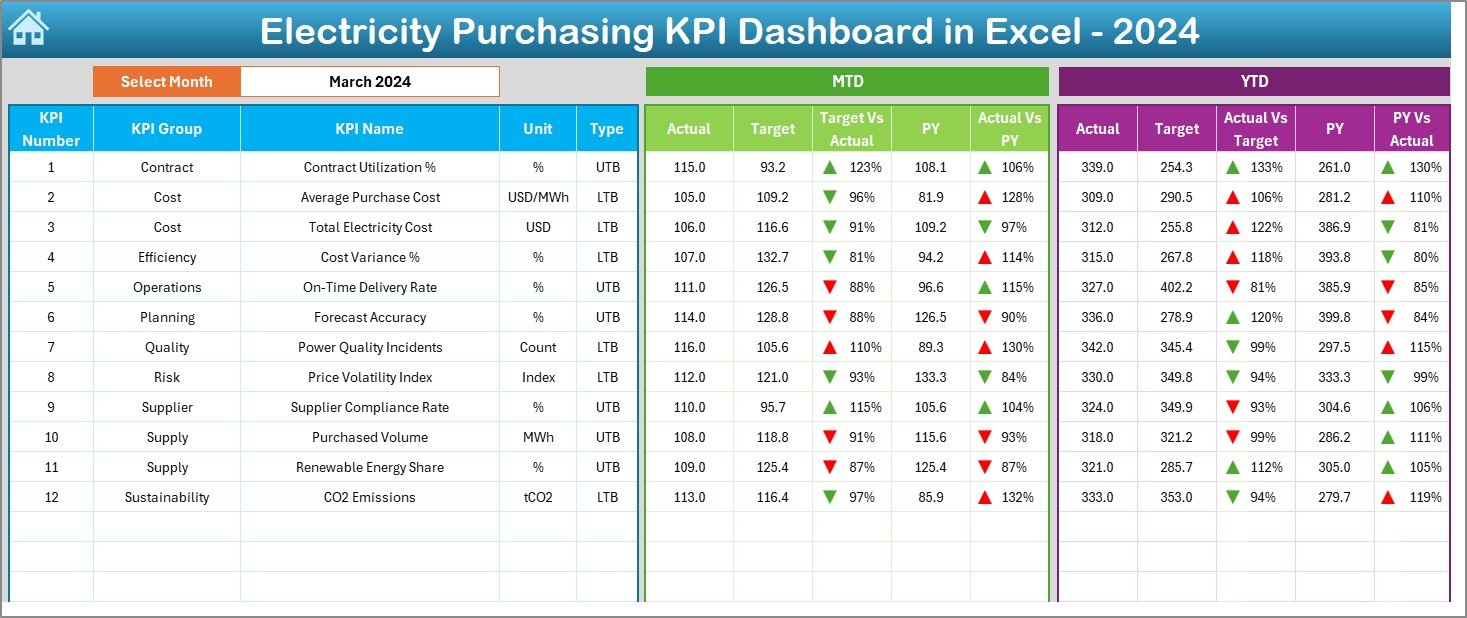
The Dashboard Sheet serves as the main visualization page.
Here, you can see all key KPI information in one place.
Key Highlights of the Dashboard Sheet
- Month selection drop-down available at cell D3
- Dashboard updates automatically when you change the selected month
- Clear comparison of performance metrics
KPIs Displayed on the Dashboard
For each KPI, the dashboard shows:
- MTD Actual
- MTD Target
- MTD Previous Year
- Target vs Actual variance
- Previous Year vs Actual variance
Similarly, the dashboard also displays:
- YTD Actual
- YTD Target
- YTD Previous Year
- Target vs Actual variance
- Previous Year vs Actual variance
Additionally, conditional formatting arrows highlight performance direction. Up arrows indicate improvement, while down arrows indicate underperformance.
As a result, decision-makers can instantly identify problem areas.
Click to buy Electricity Purchasing KPI Dashboard in Excel
How Does the Trend Sheet Help in Performance Analysis?
Trend Sheet Tab
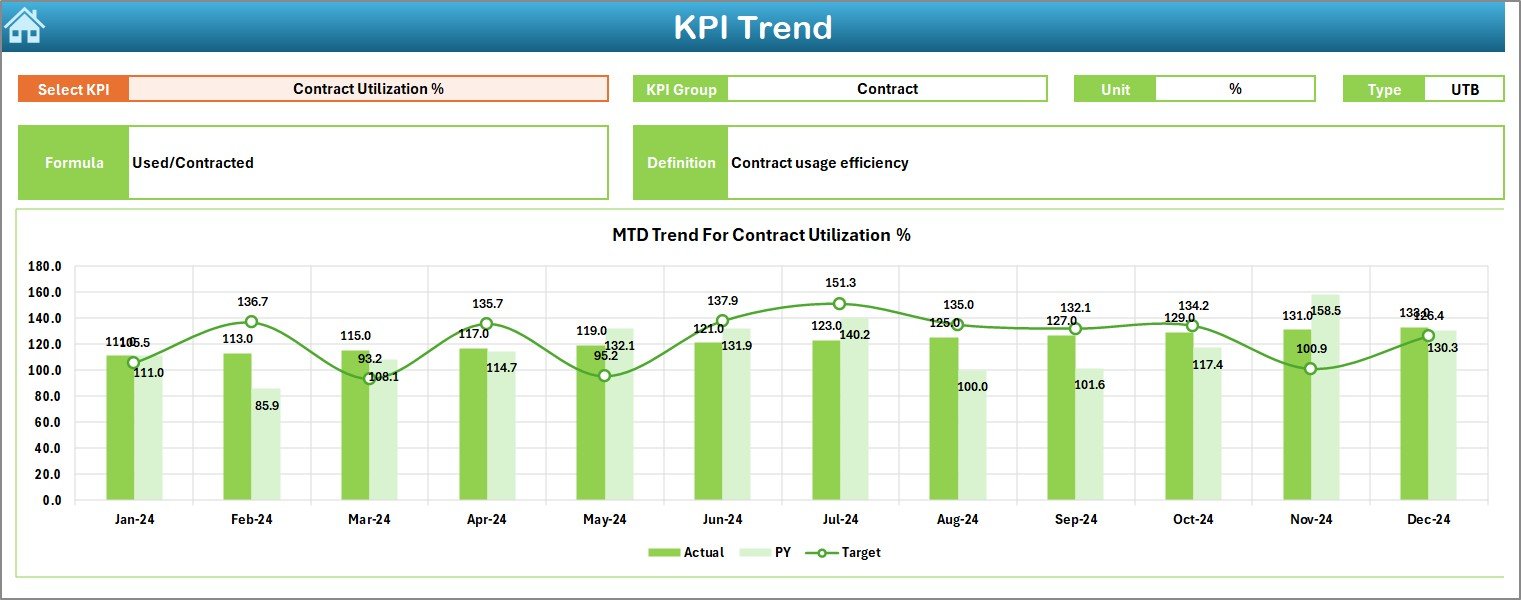
The Trend Sheet focuses on detailed KPI-level analysis.
On this sheet:
- You can select a KPI name from the drop-down at cell C3
- The dashboard automatically displays related KPI details
KPI Information Displayed
For the selected KPI, the sheet shows:
- KPI Group
- KPI Unit
- KPI Type (Lower the Better or Upper the Better)
- KPI Formula
- KPI Definition
Trend Analysis Charts
The Trend Sheet also displays:
- MTD trend chart for Actual, Target, and Previous Year
- YTD trend chart for Actual, Target, and Previous Year
Because of these trend charts, users can easily analyze performance patterns over time.
Click to buy Electricity Purchasing KPI Dashboard in Excel
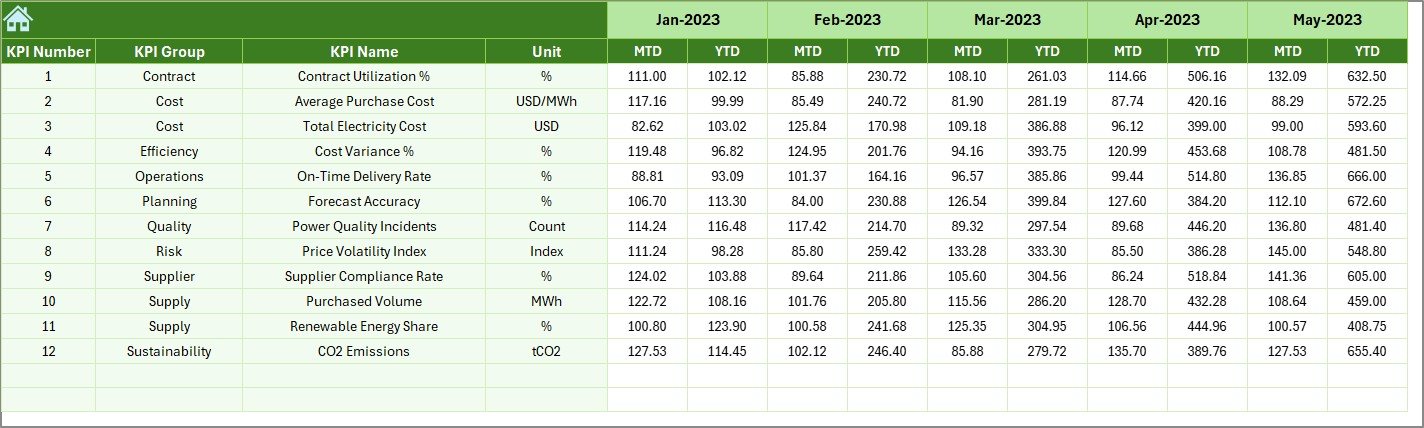
How Do You Enter Actual Numbers in the Dashboard?
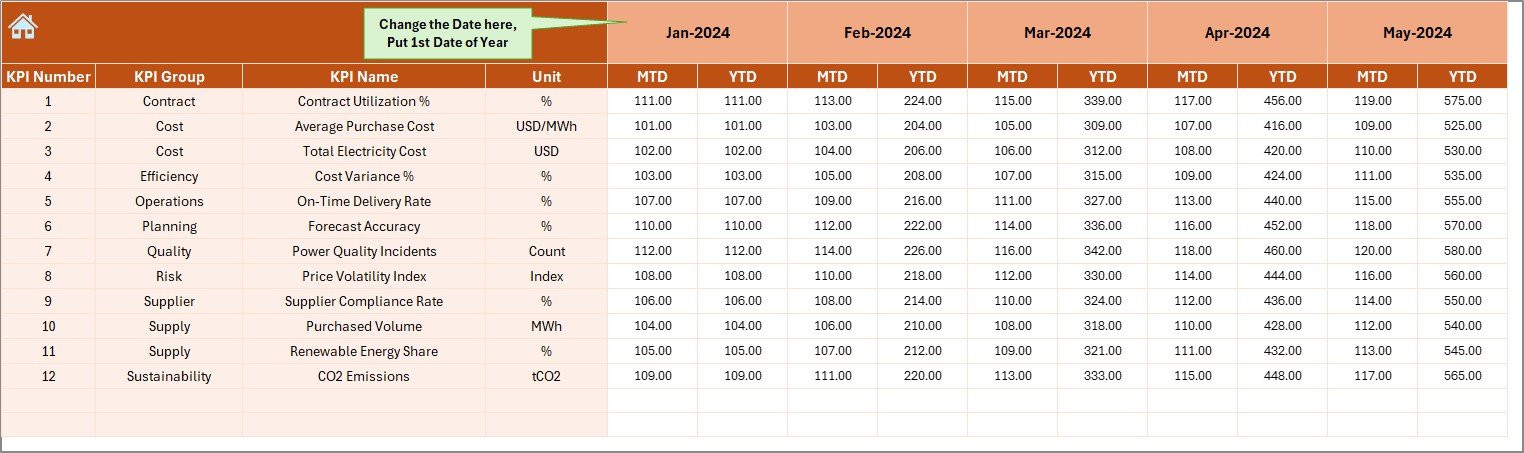
Actual Numbers Input Sheet
The Actual Numbers Input Sheet allows users to enter real purchasing data.
How This Sheet Works
- Enter actual MTD and YTD values for each KPI
- Change the starting month from cell E1
- Input the first month of the financial year in E1
- The dashboard adjusts calculations automatically
This structure ensures accuracy and consistency across all reports.
Click to buy Electricity Purchasing KPI Dashboard in Excel
What Is the Purpose of the Target Sheet?
Target Sheet Tab
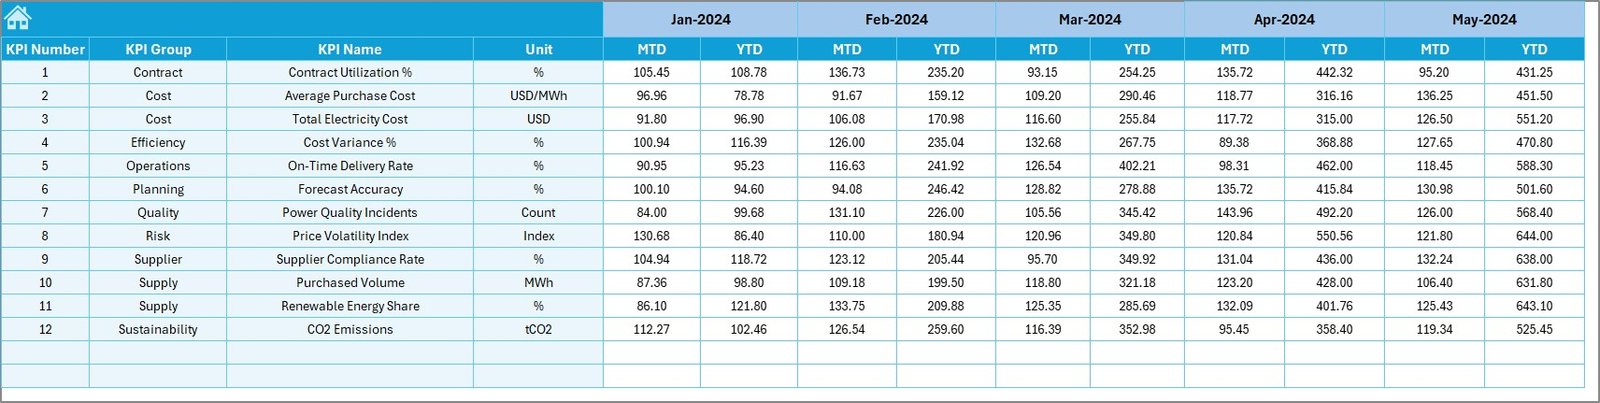
The Target Sheet stores planned performance values.
On this sheet:
- Enter MTD target values for each KPI
- Enter YTD target values for each KPI
- Maintain monthly targets for accurate tracking
As a result, users can easily compare planned versus actual performance.
Click to buy Electricity Purchasing KPI Dashboard in Excel
Why Is the Previous Year Sheet Important?
Previous Year Number Sheet Tab
The Previous Year Sheet stores historical data.
Here, users enter:
- Previous year MTD values
- Previous year YTD values
This data enables year-over-year performance comparisons. Consequently, organizations can identify trends, improvements, and recurring issues.
Click to buy Electricity Purchasing KPI Dashboard in Excel
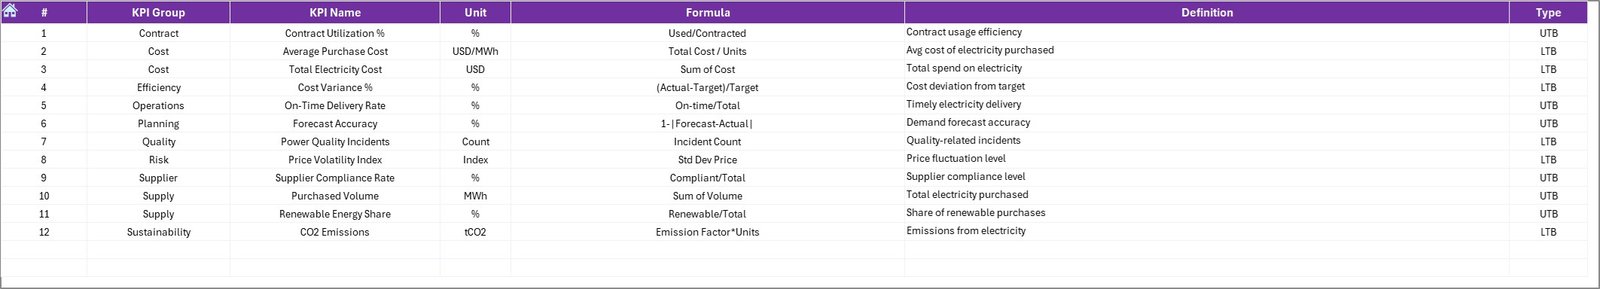
What Is the KPI Definition Sheet Used For?
KPI Definition Sheet Tab
The KPI Definition Sheet acts as the dashboard’s reference guide.
On this sheet, users define:
- KPI Name
- KPI Group
- KPI Unit
- KPI Formula
- KPI Definition
This sheet ensures consistency and clarity across the dashboard. New users can easily understand each KPI without confusion.
Click to buy Electricity Purchasing KPI Dashboard in Excel
Advantages of Electricity Purchasing KPI Dashboard in Excel
Using an Electricity Purchasing KPI Dashboard in Excel delivers several strategic advantages.
- Centralized KPI Management
Instead of managing multiple files, users track all electricity purchasing KPIs in one Excel dashboard.
- Improved Cost Control
The dashboard highlights cost overruns early. Therefore, procurement teams can take corrective actions quickly.
- Clear MTD and YTD Visibility
Users can monitor monthly and yearly performance side by side, which improves planning accuracy.
- Better Decision-Making
Visual charts and indicators simplify complex data. As a result, decision-makers act faster and with confidence.
- Easy Customization
Excel allows full customization. Organizations can add KPIs, charts, or calculations as needed.
- No Additional Software Cost
Since Excel is widely available, organizations avoid expensive BI tools.
Who Can Use an Electricity Purchasing KPI Dashboard in Excel?
This dashboard suits multiple roles and industries.
- Electricity procurement teams
- Finance and accounting departments
- Facility management teams
- Manufacturing organizations
- Utilities and energy-intensive businesses
Anyone responsible for electricity purchasing and cost optimization can benefit.
Best Practices for the Electricity Purchasing KPI Dashboard in Excel
To get maximum value, organizations should follow these best practices.
- Define KPIs Clearly
Always document KPI definitions in the KPI Definition Sheet. Clear definitions prevent misinterpretation.
- Update Data Regularly
Enter actual, target, and previous year data on a monthly basis. Regular updates ensure accurate insights.
- Use Consistent Units
Maintain consistent units for costs, consumption, and savings across all KPIs.
- Review Variances Monthly
Analyze Target vs Actual and Previous Year vs Actual variances every month.
- Use Trend Analysis for Forecasting
Leverage MTD and YTD trends to forecast future electricity purchasing needs.
- Limit KPI Count
Track only meaningful KPIs. Too many KPIs reduce focus and clarity.
How Does This Dashboard Support Strategic Electricity Purchasing?
This dashboard transforms raw electricity purchasing data into actionable intelligence.
It supports:
- Budget planning
- Vendor negotiation
- Cost reduction initiatives
- Performance benchmarking
- Long-term energy strategy
As a result, organizations shift from reactive reporting to proactive decision-making.
Common Challenges Without an Electricity Purchasing KPI Dashboard
Organizations without a structured dashboard often face:
- Delayed reporting
- Inconsistent calculations
- Limited visibility into cost drivers
- Manual errors
- Poor performance tracking
An Electricity Purchasing KPI Dashboard in Excel eliminates these challenges.
Conclusion: Why Should You Use an Electricity Purchasing KPI Dashboard in Excel?
An Electricity Purchasing KPI Dashboard in Excel provides clarity, structure, and control over electricity procurement performance.
By consolidating KPIs, automating calculations, and visualizing trends, this dashboard empowers organizations to manage electricity purchasing efficiently.
If your organization aims to reduce costs, improve transparency, and strengthen decision-making, this dashboard offers a practical and powerful solution.
Frequently Asked Questions (FAQs)
What is the main purpose of an Electricity Purchasing KPI Dashboard in Excel?
The main purpose is to track, analyze, and improve electricity purchasing performance using structured KPIs.
Can small organizations use this dashboard?
Yes, small and medium organizations can easily use and customize this dashboard in Excel.
Does this dashboard require advanced Excel skills?
No, basic Excel knowledge is sufficient to use and maintain the dashboard.
How often should data be updated?
Organizations should update data monthly to ensure accurate MTD and YTD reporting.
Can users add new KPIs to the dashboard?
Yes, users can easily add new KPIs by updating the KPI Definition, Target, and Actual sheets.
Is this dashboard suitable for long-term analysis?
Yes, the dashboard supports year-over-year comparisons and long-term trend analysis.
Visit our YouTube channel to learn step-by-step video tutorials
Watch the step-by-step video tutorial:
Click to buy Electricity Purchasing KPI Dashboard in Excel