Healthcare organizations manage large numbers of tenders every year. These tenders involve medical equipment, pharmaceuticals, infrastructure services, IT systems, and facility management. Because budgets remain tight and compliance requirements remain strict, healthcare procurement teams need strong visibility into tender progress, costs, and savings. However, when teams rely on manual spreadsheets and disconnected reports, decision-making becomes slow and risky.
That is exactly why a Health Tender Dashboard in Excel becomes a powerful and practical solution. This ready-to-use dashboard converts complex tender data into clear, visual, and actionable insights. As a result, healthcare administrators, procurement teams, and finance leaders gain complete control over tender performance without using expensive BI tools.
In this article, we will explain how the Health Tender Dashboard in Excel works, its worksheet structure, cards, charts, and analytical sections. Additionally, we will explore its advantages, improvement opportunities, best practices, and common questions.
What Is a Health Tender Dashboard in Excel?
A Health Tender Dashboard in Excel is an interactive reporting tool designed to monitor and analyze healthcare tender activities. It consolidates tender data such as estimated value, awarded value, savings, tender status, vendor performance, and manager performance into a single Excel file.
Because the dashboard is built in Microsoft Excel, it offers:
-
Easy deployment
-
Familiar interface
-
Automated calculations
-
Interactive charts
-
Quick decision support
Moreover, the dashboard helps healthcare organizations improve transparency, reduce cost overruns, and ensure better vendor and manager accountability.
Key Features of the Health Tender Dashboard
This ready-to-use Excel dashboard includes:
-
Overview-level KPIs
-
Tender analysis views
-
Vendor performance tracking
-
Cost and savings analysis
-
Manager performance monitoring
-
Clean and structured visuals
Each section supports better tender governance and financial control.
Overview Sheet Tab – Executive Summary
Click to Buy Health Tender Dashboard in Excel
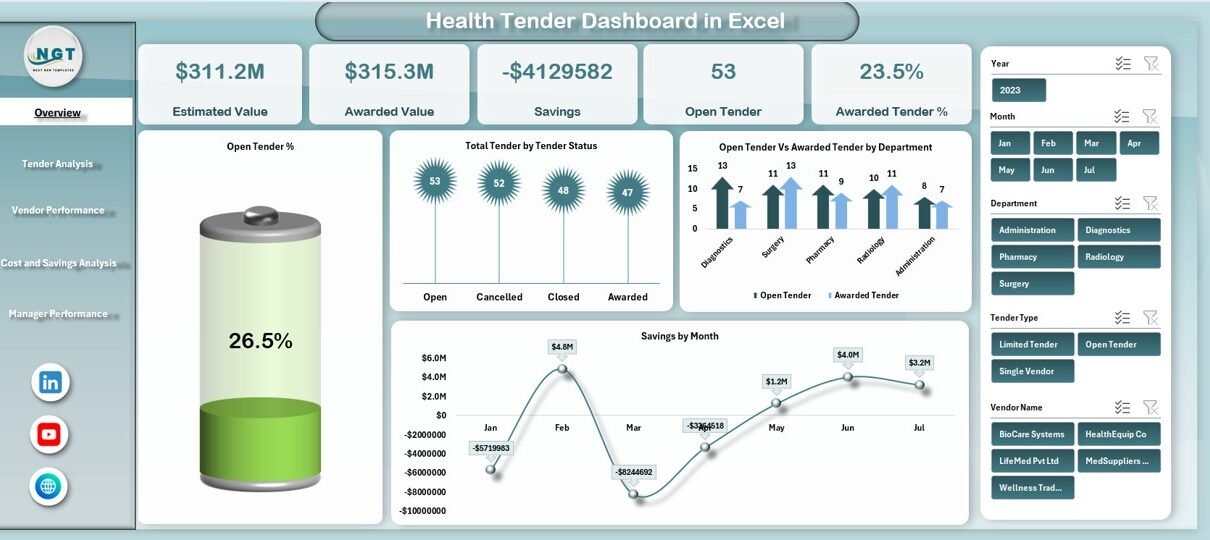
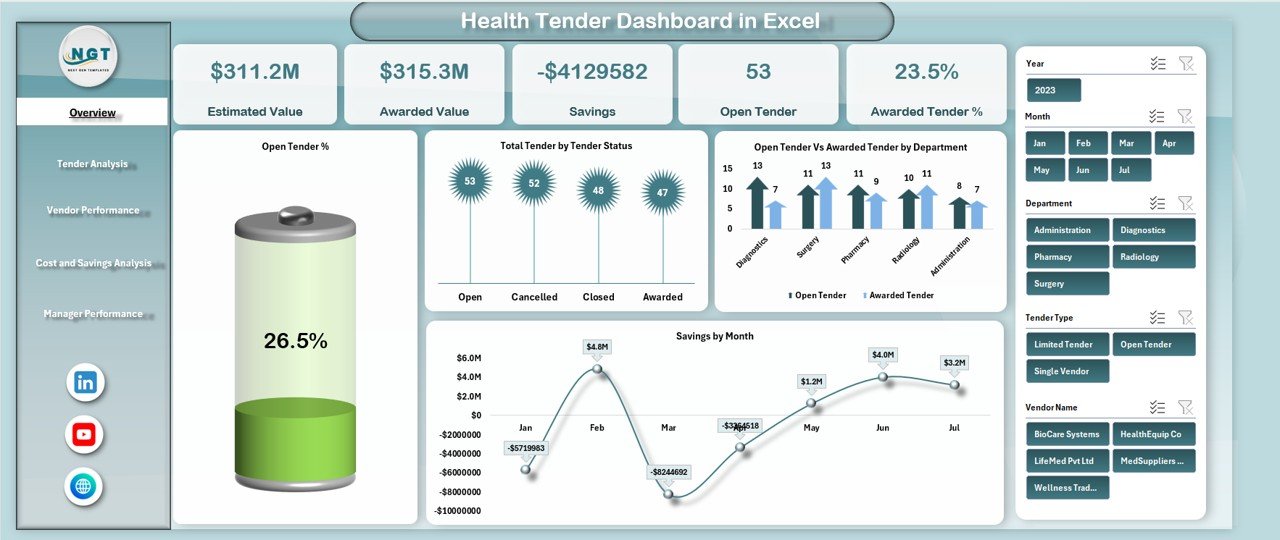
The Overview sheet acts as the main control panel of the dashboard. It gives decision-makers an instant snapshot of tender performance.
KPI Cards in the Overview Sheet
The dashboard displays the following cards:
Estimated Value
Shows the total estimated cost of all tenders.
Awarded Value
Displays the total value of awarded tenders.
Savings
Calculates the difference between estimated value and awarded value.
Open Tender
Shows the total number of tenders still open.
Awarded Tender %
Indicates the percentage of tenders successfully awarded.
These cards provide a quick understanding of cost efficiency and tender progress.
Charts in the Overview Sheet
Open Tender %
This chart shows the proportion of open tenders. It helps teams track workload and identify pending procurement activities.
Total Tender by Tender Status
This chart categorizes tenders by status such as Open, Awarded, Cancelled, or Closed. It highlights overall tender distribution.
Open Tender vs Awarded Tender by Department
This comparison chart shows how each department performs in closing tenders. It helps identify departments facing delays.
Savings by Month
This chart tracks monthly savings trends. It helps finance teams understand when cost optimization improves.
Click to Buy Health Tender Dashboard in Excel
Tender Analysis Section
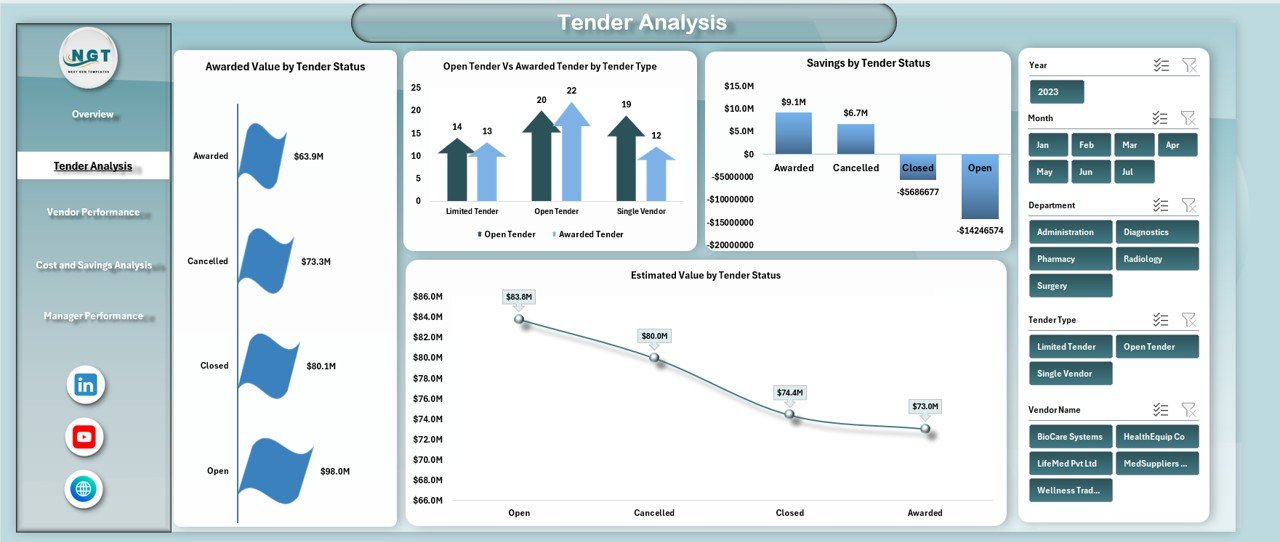
The Tender Analysis section focuses on tender-level performance across different dimensions.
Charts in Tender Analysis
Awarded Value by Tender Status
Shows how awarded value distributes across tender statuses.
Open Tender vs Awarded Tender by Tender Type
Compares tender completion across categories such as medical equipment, pharmaceuticals, IT, or services.
Savings by Tender Status
Highlights which tender statuses generate the highest savings.
Estimated Value by Tender Status
Shows how estimated costs distribute across open, awarded, and cancelled tenders.
This section helps teams understand which tender types and statuses perform best.
Click to Buy Health Tender Dashboard in Excel
Vendor Performance Analysis
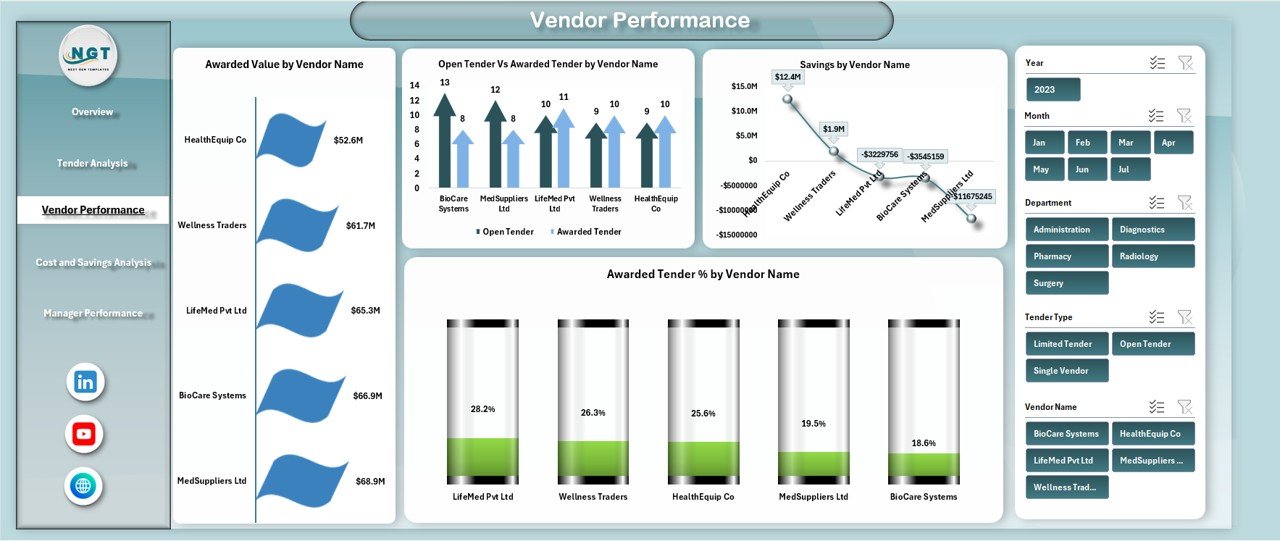
Vendor performance plays a major role in healthcare procurement success. This section focuses on supplier-level insights.
Charts in Vendor Performance
Awarded Value by Vendor Name
Displays total awarded value for each vendor.
Open Tender vs Awarded Tender by Vendor Name
Compares how efficiently vendors convert tenders into awards.
Savings by Vendor Name
Shows which vendors contribute the most savings.
Awarded Tender % by Vendor Name
Highlights vendor success rates.
These insights help healthcare organizations choose reliable and cost-effective vendors.
Click to Buy Health Tender Dashboard in Excel
Cost and Savings Analysis
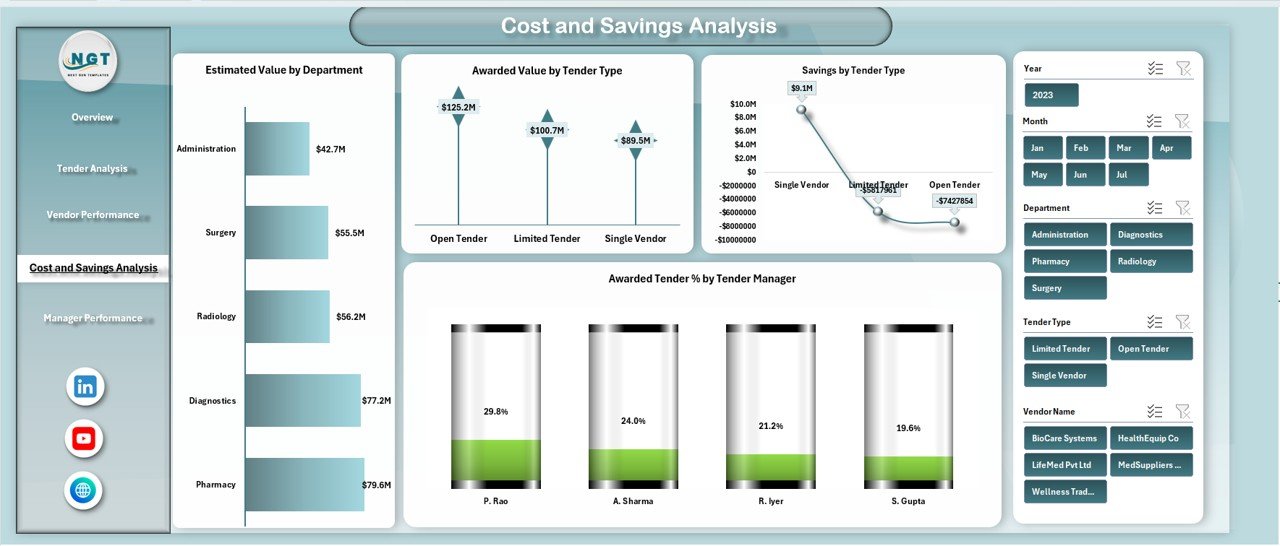
This section focuses on financial efficiency across departments and tender types.
Charts in Cost and Savings Analysis
Estimated Value by Department
Shows how departments contribute to total estimated costs.
Awarded Value by Tender Type
Highlights spending across different tender categories.
Savings by Tender Type
Identifies tender types delivering maximum cost savings.
Awarded Tender % by Tender Manager
Measures success rates of individual tender managers.
This section supports budgeting, forecasting, and financial planning.
Click to Buy Health Tender Dashboard in Excel
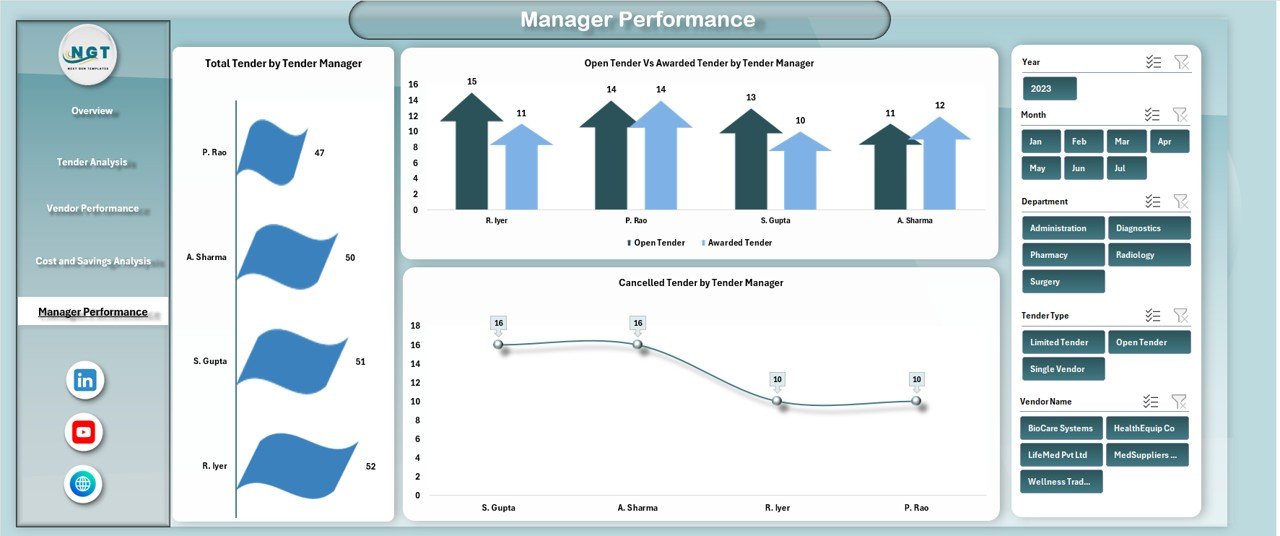
Manager Performance Analysis
Tender managers play a key role in procurement efficiency. This section tracks their performance.
Charts in Manager Performance
Total Tender by Tender Manager
Shows how many tenders each manager handles.
Open Tender vs Awarded Tender by Tender Manager
Compares workload and completion rates.
Cancelled Tender by Tender Manager
Highlights cancellation trends by manager.
This analysis helps leadership improve accountability and training.
Click to Buy Health Tender Dashboard in Excel
Advantages of Using a Health Tender Dashboard in Excel
1. Centralized Tender Visibility
All tender data stays in one structured dashboard.
2. Improved Cost Control
Savings tracking helps reduce unnecessary spending.
3. Better Decision-Making
Visual insights support faster and smarter decisions.
4. Vendor Accountability
Vendor performance metrics improve supplier selection.
5. Manager Performance Monitoring
Clear metrics promote accountability.
6. No Additional Software Cost
Excel makes the dashboard affordable and accessible.
Opportunities for Improvement in Health Tender Dashboards
Click to Buy Health Tender Dashboard in Excel
Although the dashboard is powerful, further improvements can enhance its value.
Add SLA tracking
Measure tender cycle time and delays.
Introduce risk scoring
Identify high-risk tenders early.
Automate data refresh
Use Power Query or ERP integration.
Include compliance indicators
Track regulatory adherence for health tenders.
Add forecast analysis
Predict future tender budgets and savings.
Best Practices for Using the Health Tender Dashboard
Click to Buy Health Tender Dashboard in Excel
Update tender data regularly
Frequent updates keep insights accurate.
Standardize tender status definitions
Consistency improves reporting quality.
Review savings monthly
This helps improve negotiation strategies.
Monitor vendor trends
Long-term vendor analysis improves partnerships.
Use the dashboard in review meetings
Visual reports improve communication.
Conclusion
A Health Tender Dashboard in Excel provides healthcare organizations with transparency, control, and actionable insights into tender management. It simplifies complex procurement data and transforms it into clear visuals that support cost savings and accountability. Because the dashboard is ready to use and built in Excel, it becomes an ideal solution for hospitals, health departments, and medical institutions.
With structured analysis, powerful charts, and executive-level summaries, this dashboard supports smarter procurement decisions and stronger financial governance.
Frequently Asked Questions (FAQs)
Click to Buy Health Tender Dashboard in Excel
1. Who should use a Health Tender Dashboard?
Healthcare procurement teams, finance teams, administrators, and auditors.
2. Can the dashboard handle large tender volumes?
Yes, Excel supports large datasets with proper structuring.
3. Is the dashboard customizable?
Yes, you can add new charts, KPIs, or departments.
4. Does it support monthly and yearly analysis?
Yes, it supports trend analysis and time-based reporting.
5. Can it track multiple hospitals or units?
Yes, with department or location fields.
6. Does it reduce manual reporting work?
Yes, automated calculations save time and reduce errors.
Visit our YouTube channel to learn step-by-step video tutorials
Watch the step-by-step video tutorial:
Click to Buy Health Tender Dashboard in Excel