Ports handle massive purchasing volumes every day. From equipment and spare parts to fuel, services, and infrastructure materials, every purchase affects operational efficiency, cost control, and delivery timelines. However, when purchasing data stays scattered across spreadsheets and static reports, port authorities struggle to gain visibility. As a result, delays increase, costs rise, and decision-making slows down.
That is exactly why a Port Purchasing Dashboard in Power BI becomes a powerful solution. This ready-to-use dashboard transforms raw purchasing data into clear, visual, and actionable insights. It helps port procurement teams monitor costs, quantities, delivery performance, vendor efficiency, and risk indicators from one centralized dashboard.
In this article, we will explain how the Port Purchasing Dashboard in Power BI works, what insights it delivers, how each section supports decision-making, and why it is essential for modern port operations.
What Is a Port Purchasing Dashboard in Power BI?
Click to Buy Port Purchasing Dashboard in Power BI
A Port Purchasing Dashboard in Power BI is an interactive business intelligence solution designed to analyze and monitor purchasing activities in port operations. It consolidates purchase orders, delivery data, supplier information, costs, and delays into a single visual platform.
Because the dashboard is built in Power BI, it offers:
-
Real-time and interactive visuals
-
Drill-down analysis by port, vendor, item, and category
-
Automated calculations and trends
-
Easy filtering and slicing
-
Enterprise-level reporting without manual effort
This dashboard enables procurement managers, finance teams, and operations leaders to make faster and smarter purchasing decisions.
Key Objectives of the Port Purchasing Dashboard
The dashboard focuses on helping ports:
-
Control purchasing costs
-
Track ordered vs received quantities
-
Monitor delivery delays
-
Evaluate vendor performance
-
Identify savings opportunities
-
Reduce procurement risks
By tracking these areas visually, ports gain full control over their purchasing ecosystem.
Overview Section – High-Level Purchasing Performance
Click to Buy Port Purchasing Dashboard in Power BI
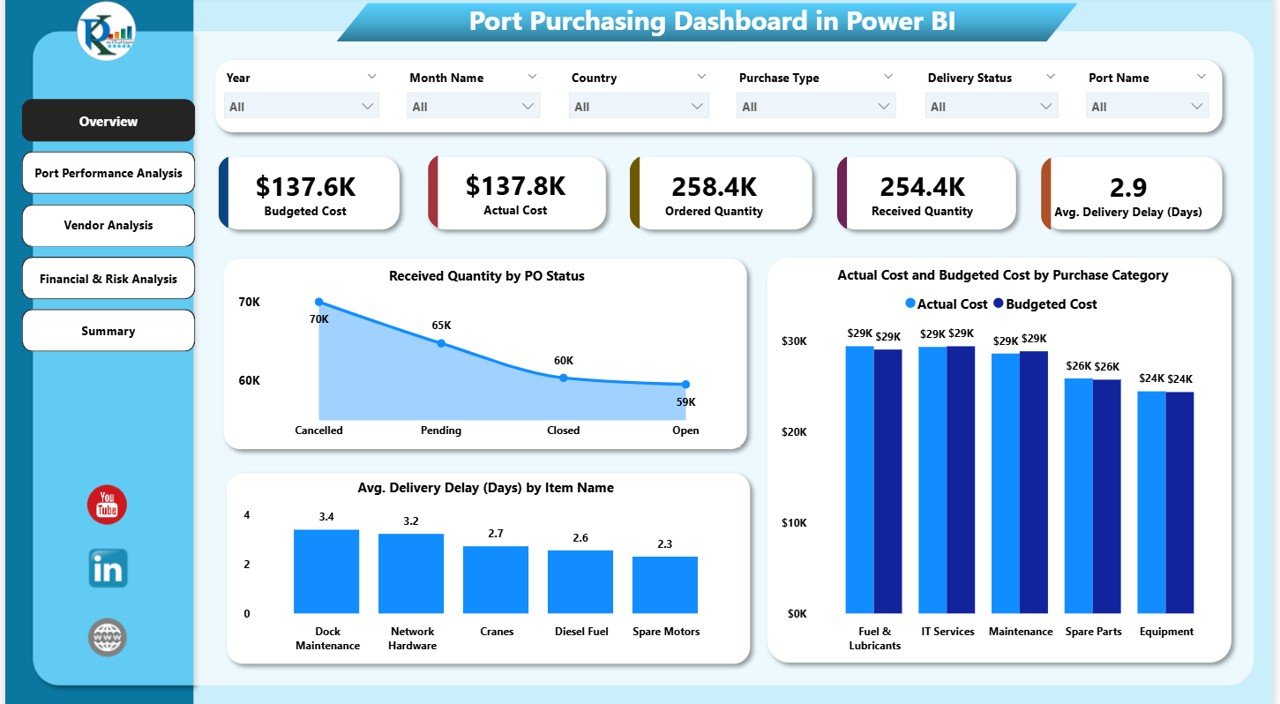
The Overview section provides an instant snapshot of purchasing health using KPI cards and summary charts.
KPI Cards in the Overview Section
The cards highlight the most critical purchasing metrics:
-
Budgeted Cost – Planned purchasing cost
-
Actual Cost – Real cost incurred
-
Ordered Quantity – Total quantity ordered
-
Received Quantity – Quantity received at the port
-
Average Delivery Delay (Days) – Average delay across all deliveries
These KPIs allow leaders to assess performance within seconds.
Overview Charts
Received Quantity by PO Status
This chart shows how much quantity is received based on purchase order status. It helps teams identify pending, partially received, and completed orders quickly.
Actual Cost vs Budgeted Cost by Purchase Category
This comparison highlights overspending or savings by category. As a result, finance teams can identify cost overruns early.
Average Delivery Delay (Days) by Item Name
This chart identifies items that cause frequent delays. It helps procurement teams renegotiate timelines or find alternate suppliers.
Click to Buy Port Purchasing Dashboard in Power BI
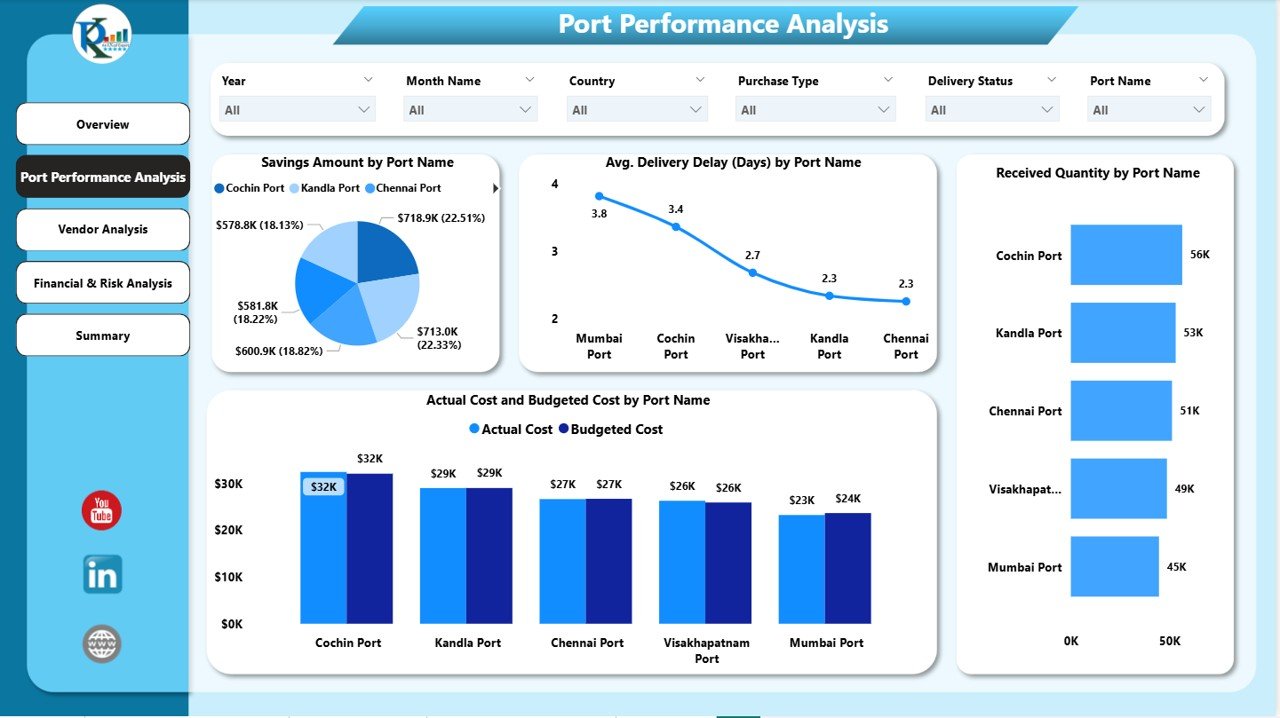
Port Performance Analysis – Port-Wise Insights
The Port Performance Analysis section evaluates purchasing efficiency at individual port locations.
Charts in Port Performance Analysis
Savings Amount by Port Name
This chart shows how much each port saves compared to planned cost. High savings indicate strong procurement control.
Average Delivery Delay (Days) by Port Name
This view highlights which ports experience the longest delivery delays, allowing operations teams to investigate root causes.
Received Quantity by Port Name
This chart compares incoming quantities across ports and supports capacity planning.
Actual Cost vs Budgeted Cost by Port Name
This visual reveals cost overruns or under-utilized budgets at the port level.
Click to Buy Port Purchasing Dashboard in Power BI
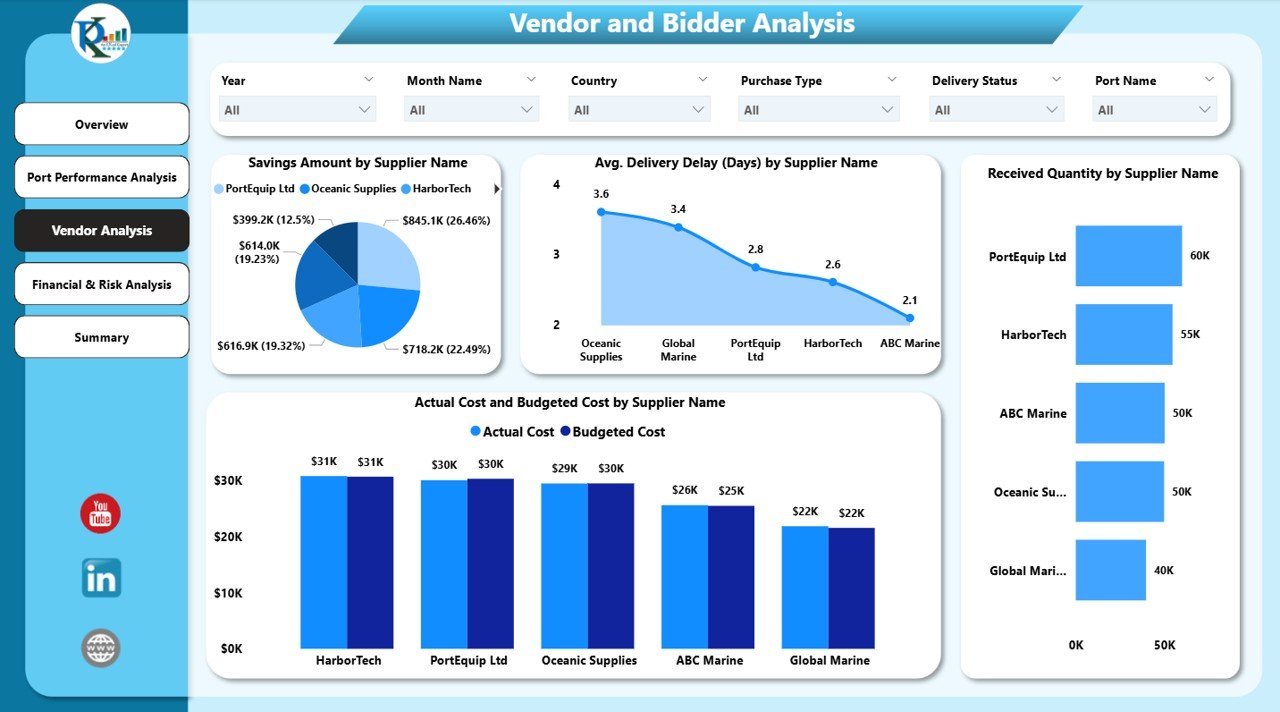
Vendor Analysis – Supplier Performance Monitoring
Vendor reliability plays a major role in port purchasing success. The Vendor Analysis section evaluates supplier performance clearly.
Vendor Analysis Charts
Savings Amount by Supplier Name
This chart shows which suppliers contribute the most savings. It helps prioritize long-term partnerships.
Average Delivery Delay (Days) by Supplier Name
This analysis identifies suppliers who frequently miss delivery timelines.
Received Quantity by Supplier Name
This chart highlights supplier contribution to total procurement volume.
Actual Cost vs Budgeted Cost by Supplier Name
This comparison helps detect pricing inconsistencies and negotiation gaps.
Click to Buy Port Purchasing Dashboard in Power BI
Financial & Risk Analysis – Cost and Risk Visibility
The Financial & Risk Analysis section focuses on cost exposure and procurement risks.
Charts in Financial & Risk Analysis
Budgeted Cost by Purchase Type
This chart shows planned spending distribution across purchase types.
Actual Cost by Delivery Status
This visual reveals how delivery performance impacts spending.
Budgeted Cost by Supplier Name
This chart highlights financial dependency on specific suppliers, which supports risk diversification planning.

Click to Buy Port Purchasing Dashboard in Power BI
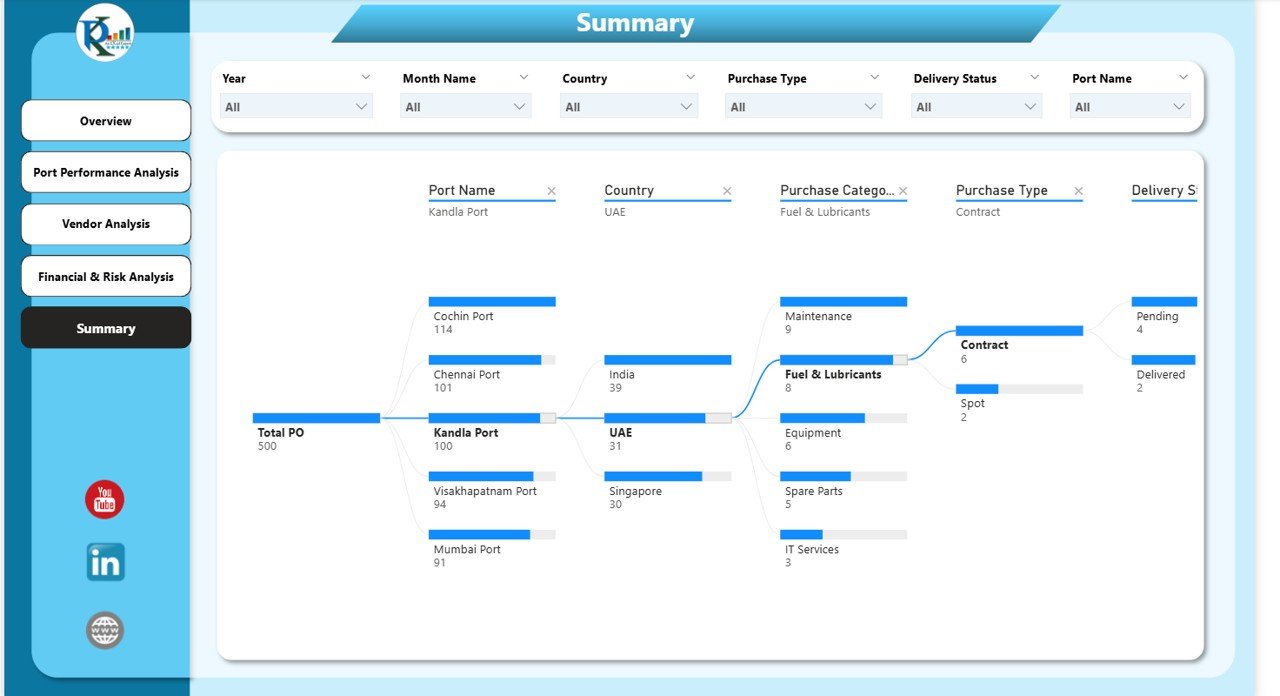
Summary Section – Decomposition View
The Decomposition Tree in the Summary section allows users to break down purchasing performance by multiple dimensions such as:
-
Port
-
Supplier
-
Purchase Category
-
Delivery Status
-
Item Name
This interactive view enables deep root-cause analysis and supports strategic decision-making.
Click to Buy Port Purchasing Dashboard in Power BI
Why Ports Need a Purchasing Dashboard in Power BI
Ports operate in complex environments with high procurement volumes and strict timelines. A Power BI dashboard helps because it:
-
Centralizes purchasing data
-
Improves transparency
-
Reduces manual reporting
-
Highlights delays and cost overruns
-
Supports vendor accountability
-
Enables proactive decision-making
Without such visibility, ports risk inefficiencies, higher costs, and operational disruptions.
Advantages of the Port Purchasing Dashboard in Power BI
Click to Buy Port Purchasing Dashboard in Power BI
1. Centralized Purchasing Visibility
All procurement metrics stay in one dashboard.
2. Better Cost Control
Cost overruns become visible before they escalate.
3. Improved Delivery Performance
Delay patterns help teams take corrective actions.
4. Strong Vendor Evaluation
Supplier comparisons improve negotiation and selection.
5. Faster Decision-Making
Interactive visuals reduce reporting delays.
6. Scalability
The dashboard works for small terminals and large port authorities.
Opportunities for Improvement in Port Purchasing Analytics
Click to Buy Port Purchasing Dashboard in Power BI
Ports can further enhance the dashboard by adding:
-
Contract compliance tracking
-
SLA breach alerts
-
Forecasted purchasing costs
-
Risk scoring for vendors
-
Inventory integration
-
AI-based delay prediction
These enhancements improve long-term procurement maturity.
Best Practices for Using the Port Purchasing Dashboard
-
Update purchasing data regularly
-
Review delivery delay trends weekly
-
Monitor vendor performance monthly
-
Compare actual vs budgeted costs consistently
-
Use decomposition views during review meetings
-
Share insights across procurement and operations teams
Following these practices ensures maximum dashboard value.
Conclusion
Click to Buy Port Purchasing Dashboard in Power BI
A Port Purchasing Dashboard in Power BI provides ports with complete visibility into purchasing costs, quantities, delivery timelines, and supplier performance. It transforms complex procurement data into actionable insights and supports smarter decisions across finance, procurement, and operations teams.
With interactive visuals, clear KPIs, and deep analytical capabilities, this dashboard becomes an essential tool for modern port authorities aiming to reduce costs, improve delivery reliability, and strengthen vendor relationships.
Watch the step-by-step video tutorial:
Visit our YouTube channel to learn step-by-step video tutorials
Click to Buy Port Purchasing Dashboard in Power BI