Introduction
The Market Research KPI Scorecard is a comprehensive and ready-to-use template designed to streamline how businesses track and analyze their key performance indicators (KPIs) related to market research. With this Scorecard, you gain clarity on actual versus target metrics, monitor trends, and make informed strategic decisions that drive business growth.
Key Features of Market Research KPI Scorecard
- User-Friendly Interface: Designed with simplicity and ease of use in mind, helping users focus on insights rather than wrestling with complex formulas.
- Multiple Data Views: Allows selection between monthly, Month-to-Date (MTD), and Year-to-Date (YTD) perspectives to provide flexible performance analysis.
- Comprehensive KPI Tracking: Offers detailed views including actual values, targets, and visual performance indicators to accelerate decision-making.
- Dynamic Trend Analysis: Visual charts for trending KPIs help identify growth patterns and areas needing improvement.
- Input Flexibility: Simple data entry sheets make updating KPIs quick and efficient for continuous monitoring.
- KPI Definition Repository: Centralized definitions and formulas for all KPIs promote consistency in understanding and reporting.
Dashboard Pages Explanation
Click to Buy Market Research KPI Scorecard in Excel
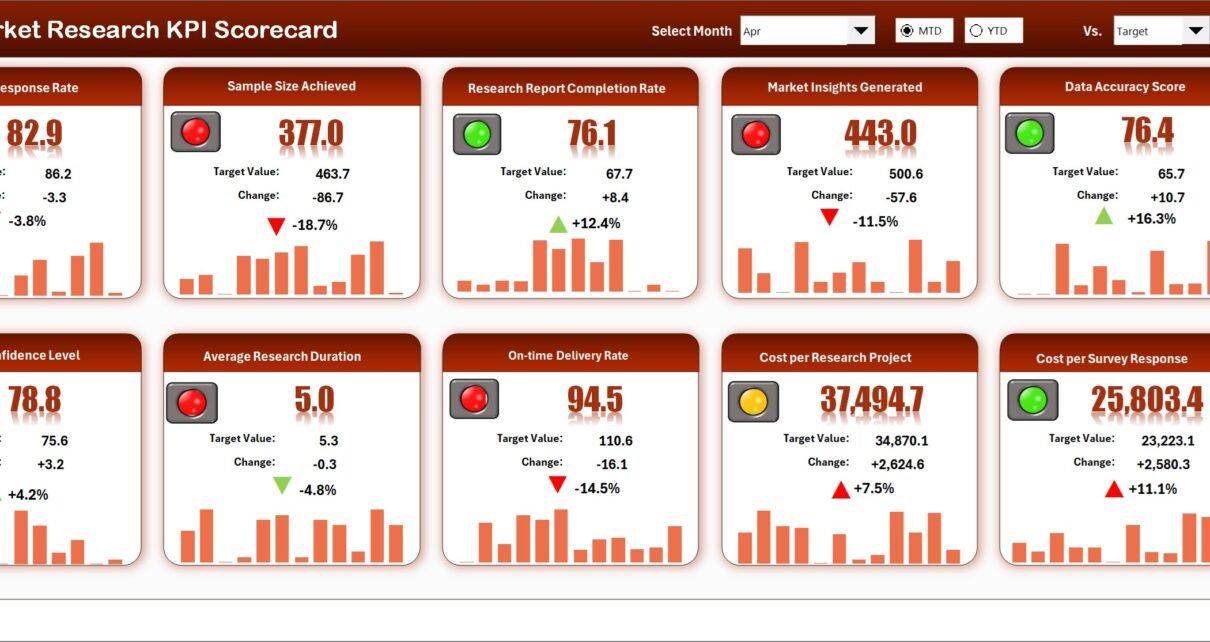
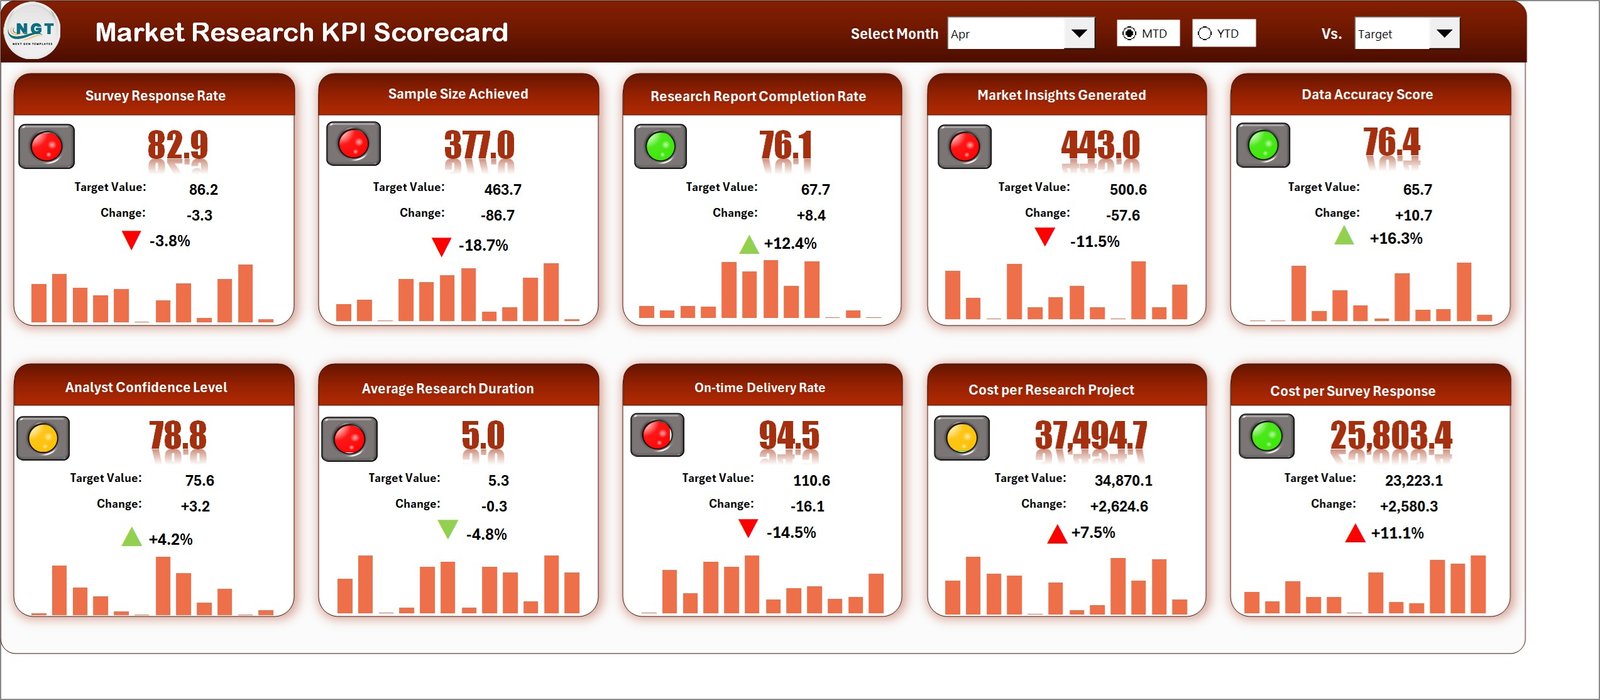
1. Scorecard Sheet
The Scorecard Sheet acts as the main dashboard where overall KPI performance is displayed and analyzed.
- Dropdown Menus: Choose the desired month and toggle between MTD or YTD for flexible performance review.
- Actual vs Target Values: Easily compare how your KPIs are performing against set objectives.
- Visual Indicators: Color-coded formatting visually highlights strong and underperforming areas.
- Comprehensive KPI Overview: Presents a full display of KPIs along with MTD and YTD comparisons.
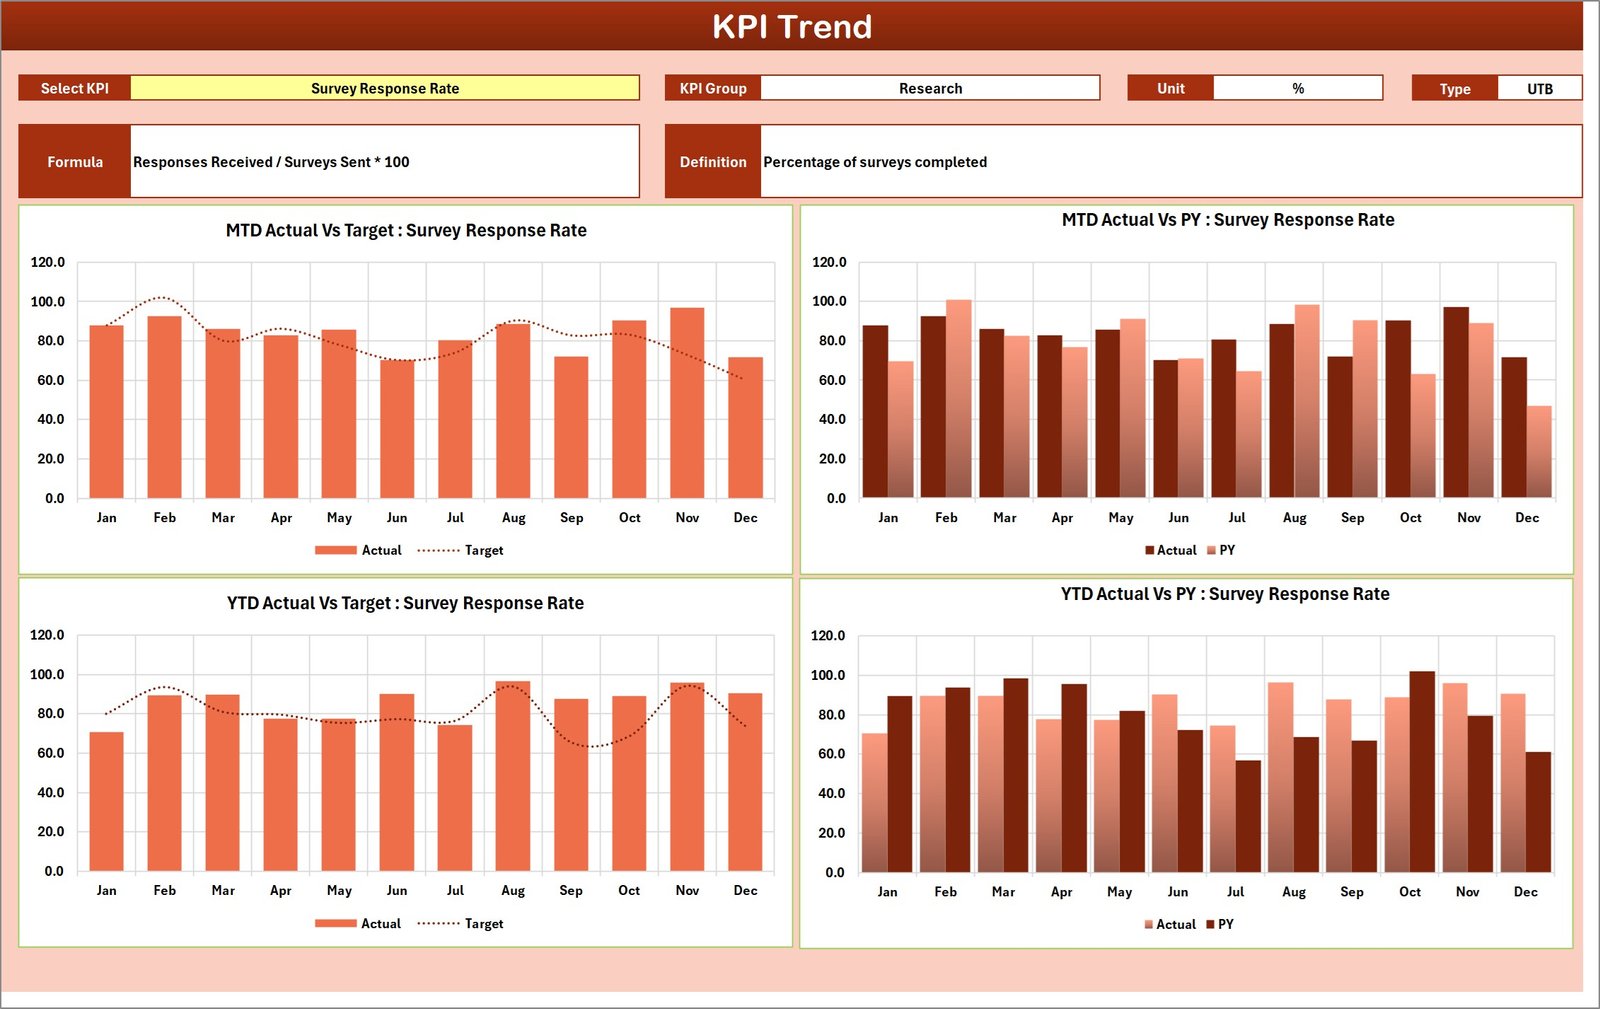
2. KPI Trend Sheet
This sheet allows users to select a KPI from a dropdown at cell C3 and view detailed attributes and trends.
- KPI Details: Displays KPI Group, Unit of Measurement, whether lower or upper values are preferable, formula, and detailed definition.
- Trend Visualization: MTD and YTD charts illustrating Actual, Target, and Previous Year (PY) performance metrics.
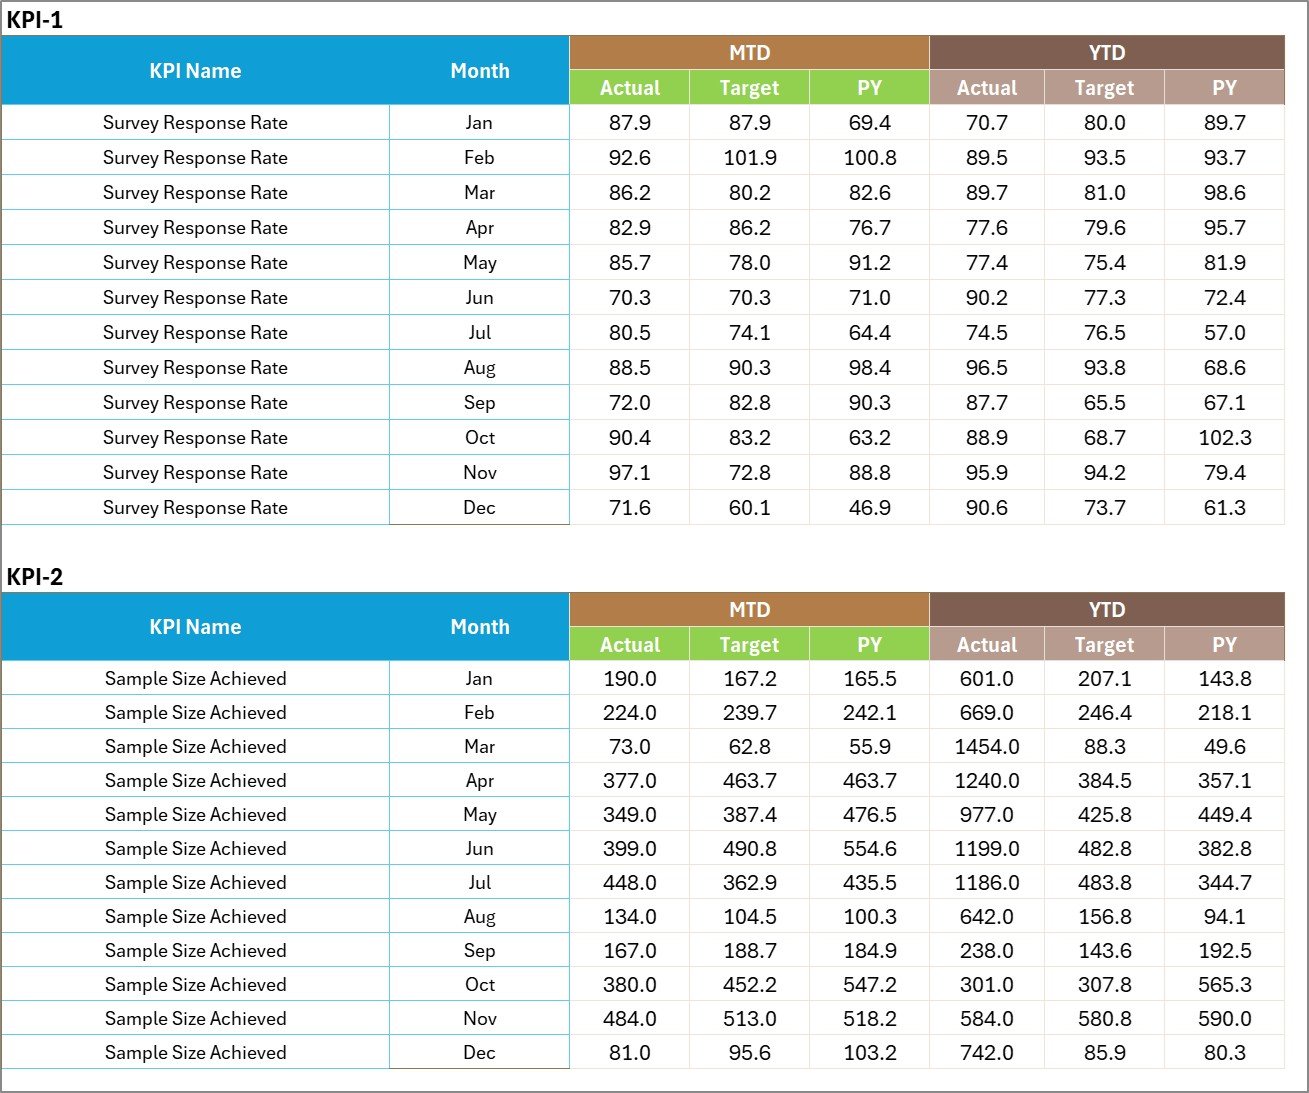
3. Input Data Sheet
The Input Data Sheet is where all actual KPI values, target values, and relevant metrics are recorded. This sheet is vital for keeping your KPI scorecard current and accurate.
- Data Entry: Streamlined interface for entering monthly or periodic KPI figures.
- Flexibility: Easily update as new data becomes available without affecting other calculations.
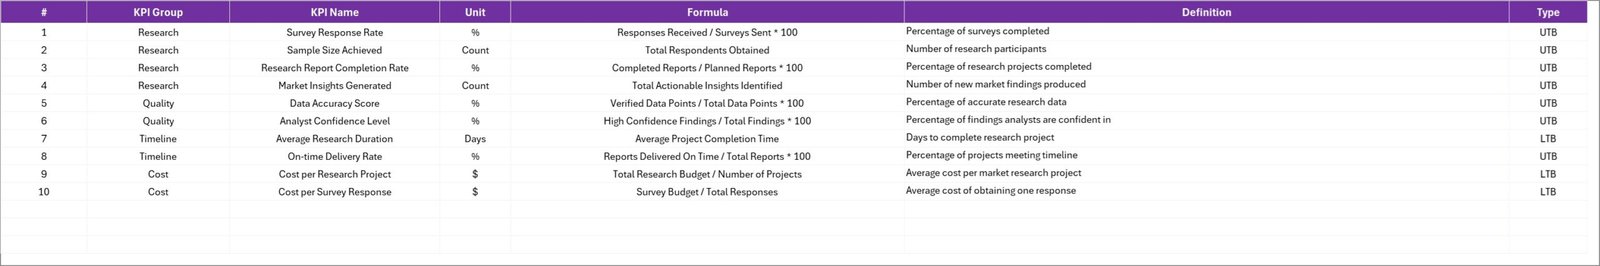
4. KPI Definition Sheet
This sheet serves as the master reference for all KPI definitions. It contains:
- KPI Name
- KPI Group
- Unit of Measurement
- Formula
- Detailed KPI Definition
Advantages of Market Research KPI Scorecard
- Improved Decision Making: Immediate access to KPI performance helps prioritize efforts and resources effectively.
- Time-Saving: Automated calculations and visual indicators reduce time spent generating reports.
- Accuracy: Centralized data input reduces errors and ensures consistent KPI measurement.
- Customizable: Adaptable to different industries or specific organizational KPI requirements.
- Transparency: Clear presentations enhance understanding across departments, fostering collaboration.
Opportunities for Improvement
- Integration with Live Data: Connect with CRM or market research tools to automate data updates in real-time.
- Mobile Compatibility: Optimize for on-the-go access and updates.
- Advanced Analytics: Incorporate predictive analytics and AI for deeper market insights.
- User Training: Provide detailed tutorials or webinars to maximize user adoption and scorecard impact.
Best Practices
- Regularly update input data to keep analyses relevant and actionable.
- Review KPI definitions periodically to align with evolving business goals.
- Use the visual indicators to quickly identify and address performance gaps.
- Encourage cross-functional teams to collaborate around the scorecard for holistic market insights.
- Leverage trend sheets to forecast market shifts and adjust strategies accordingly.
FAQs
Click to Buy Market Research KPI Scorecard in Excel
- What is the primary purpose of the Market Research KPI Scorecard?
- It is designed to monitor and evaluate key performance indicators related to market research to help businesses make informed decisions.
- Can I customize the KPIs in this Scorecard?
- Yes, the template allows modifications to KPI names, formulas, and definitions to suit your specific requirements.
- How frequently should I update the data?
- Ideally, update the data monthly or as often as new performance figures become available for accurate tracking.
- Is this Scorecard suitable for beginners?
- Absolutely! The template is user-friendly with dropdowns and visual aids that make it easy for users of all skill levels.
- Does the template support Year-to-Date and Month-to-Date analysis?
- Yes, the Scorecard includes dropdowns to toggle between MTD and YTD views for flexible performance assessment.
Conclusion
Click to Buy Market Research KPI Scorecard in Excel
The Market Research KPI Scorecard is an essential tool that empowers businesses to track, analyze, and optimize their market research efforts efficiently. Its intuitive design, coupled with comprehensive features like KPI trend analysis, data input flexibility, and detailed KPI definitions, makes it indispensable for driving data-driven strategies. By adopting this Scorecard, you ensure that your market research initiatives stay aligned with your business goals and deliver measurable growth.
For more detailed demonstrations and step-by-step guides, visit our YouTube channel to watch the demo.
For further information on KPI scorecards and market research analytics, consider exploring resources on Microsoft Excel Support.
Click to Buy Market Research KPI Scorecard in Excel