Introduction
The Palliative Care KPI Dashboard is a powerful and user-friendly tool designed to help healthcare professionals monitor and improve the quality of palliative care services. By tracking key performance indicators (KPIs), this dashboard provides actionable insights empowering teams to make data-driven decisions that enhance patient care and operational efficiency.
Key Features of Palliative Care KPI Dashboard
- Comprehensive tracking of critical KPIs relevant to palliative care.
- Interactive month selection allowing dynamic data updates.
- Multiple sheets organized for seamless navigation and data input.
- Visual indicators through conditional formatting and trend charts to quickly identify performance gaps.
- Definition and formula references for each KPI ensuring clarity and consistency.
- Ready-to-use Excel template tailored specifically to meet palliative care needs.
Dashboard Pages Explanation
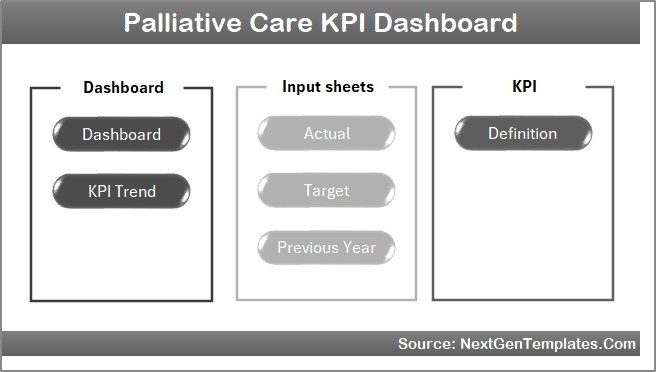
1. Home Sheet
The Home sheet acts as the dashboard’s index, featuring six clearly labeled buttons to navigate efficiently across different sheets. It provides a centralized starting point for users.
 Home Page
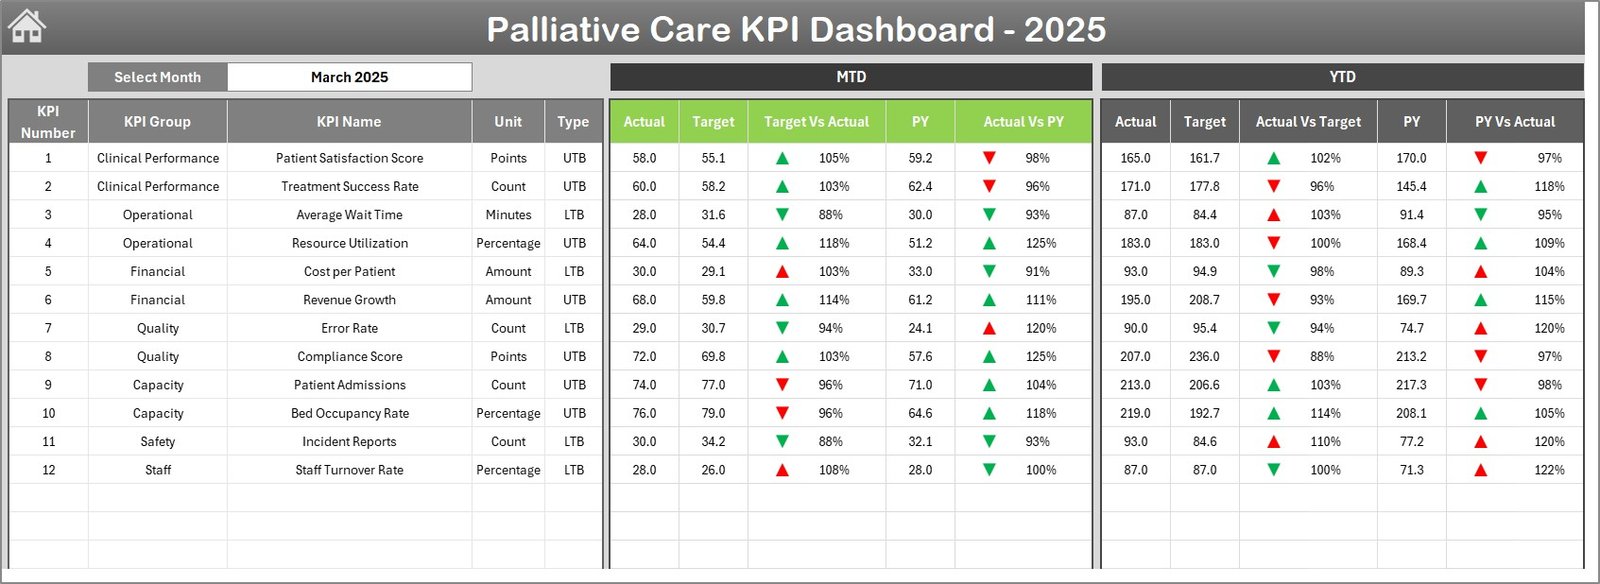
2. Dashboard Sheet
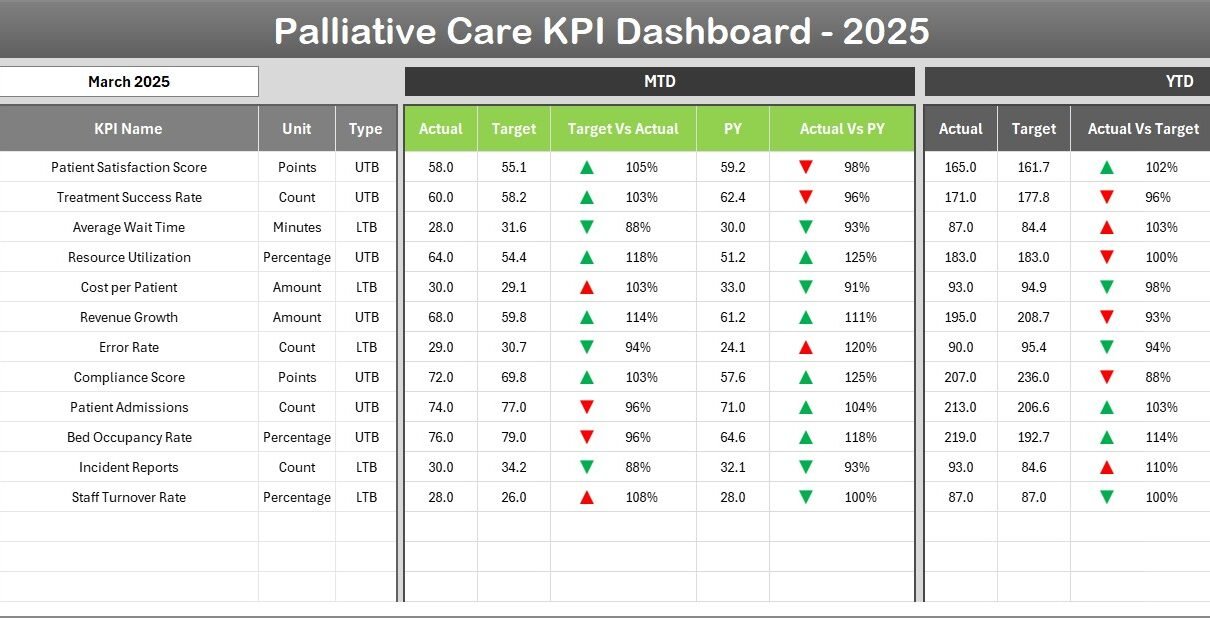
This is the main sheet displaying all KPI information. Users can select the desired month via a drop-down in cell D3, which updates all relevant numbers. The dashboard shows Month-To-Date (MTD) and Year-To-Date (YTD) actual versus target and previous year data, enhanced with conditional formatting.
- MTD Actual, Target, and Previous Year data.
- YTD Actual, Target, and Previous Year data.
- Visual up/down arrows for target vs actual and previous year comparisons.
 Palliative Care KPI Dashboard
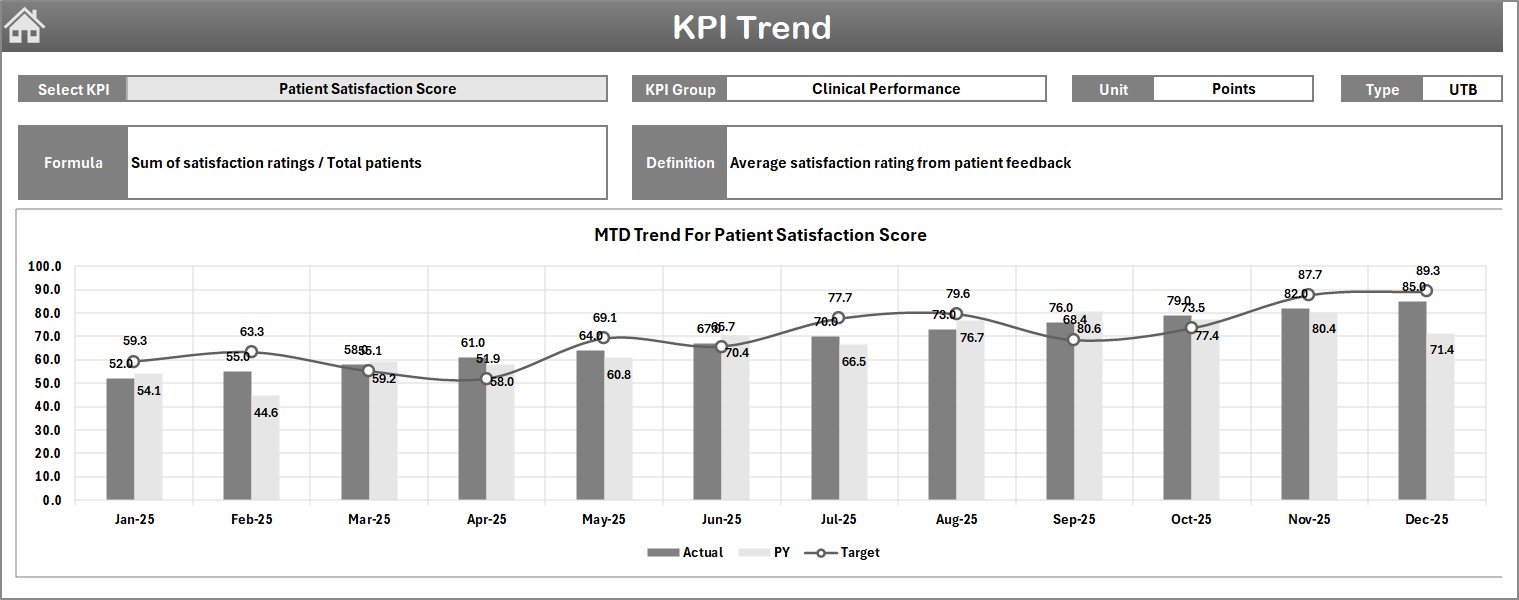
3. KPI Trend Sheet
This sheet allows selection of specific KPIs from a drop-down menu (cell C3). It displays detailed KPI metadata-including group, unit, type (Lower The Better or Upper The Better), formula, and definition-and presents MTD and YTD trend charts comparing actual, target, and previous year values.
 KPI Trend Sheet
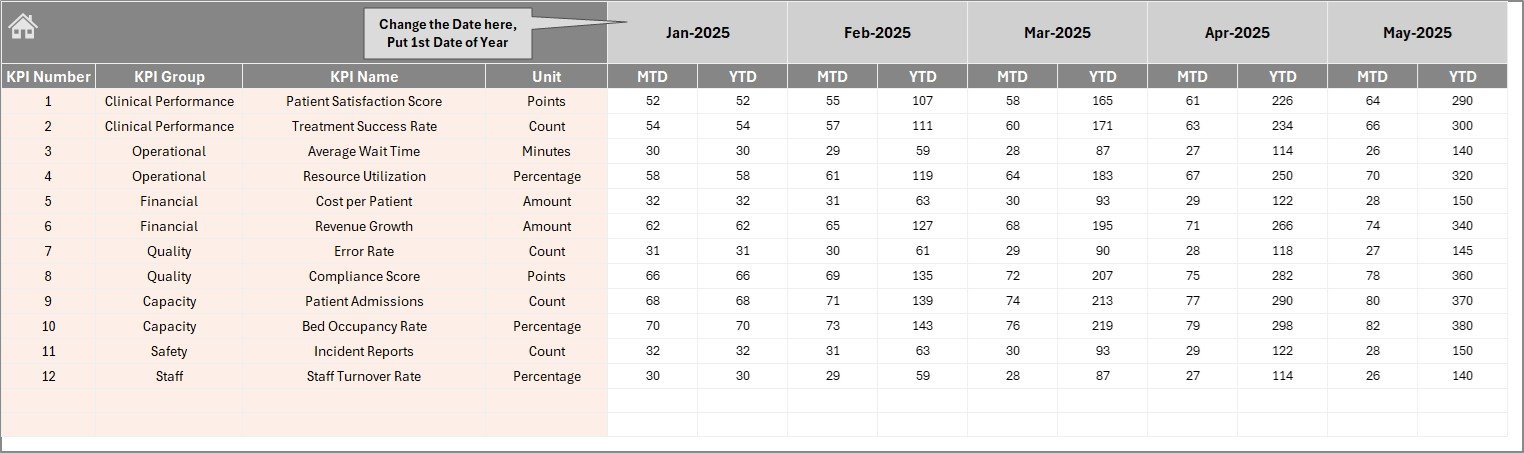
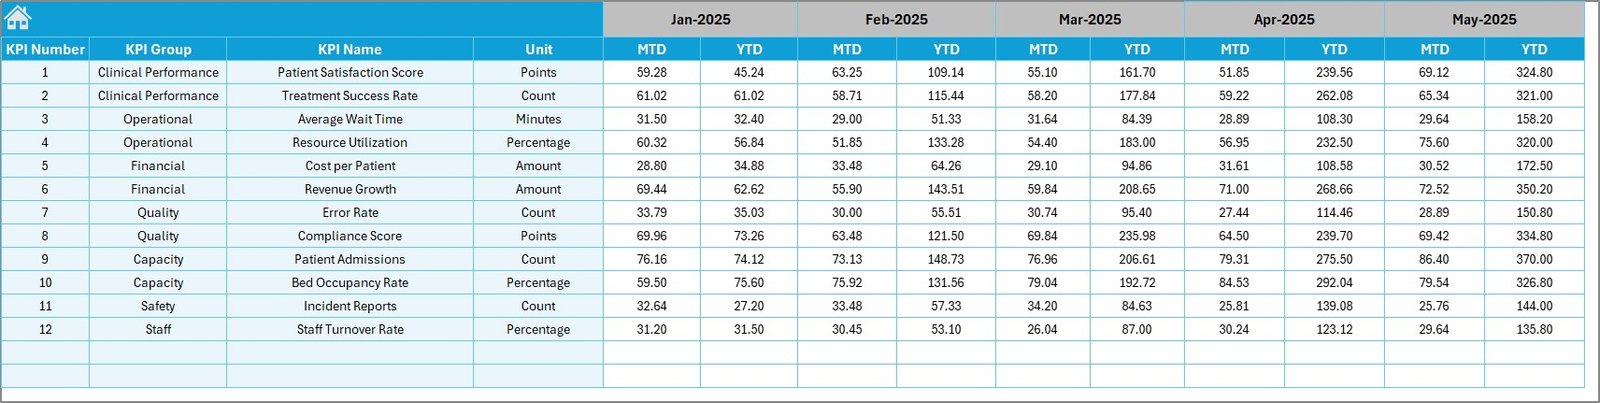
4. Actual Numbers Input Sheet
This input sheet is where actual performance data is entered monthly for both MTD and YTD. Users can modify the starting month of the year (cell E1) to align data entry with organizational periods.
 Actual Numbers Input sheet
5. Target Number Input Sheet
Here, users enter target values for each KPI, covering both MTD and YTD periods. This enables goal setting and performance comparison across timelines.
 Target Number Input sheet
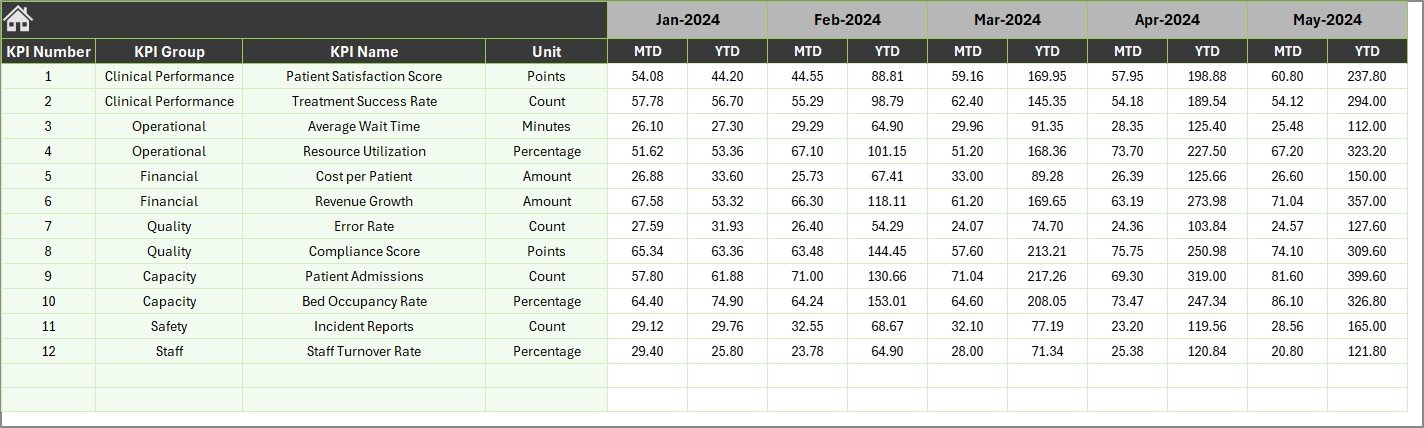
6. Previous Year Number Input Sheet
This sheet is dedicated to inputting previous year data for benchmarking purposes, mirroring the actual number input sheet to allow seamless historical comparisons.
 Previous Year Number Input sheet
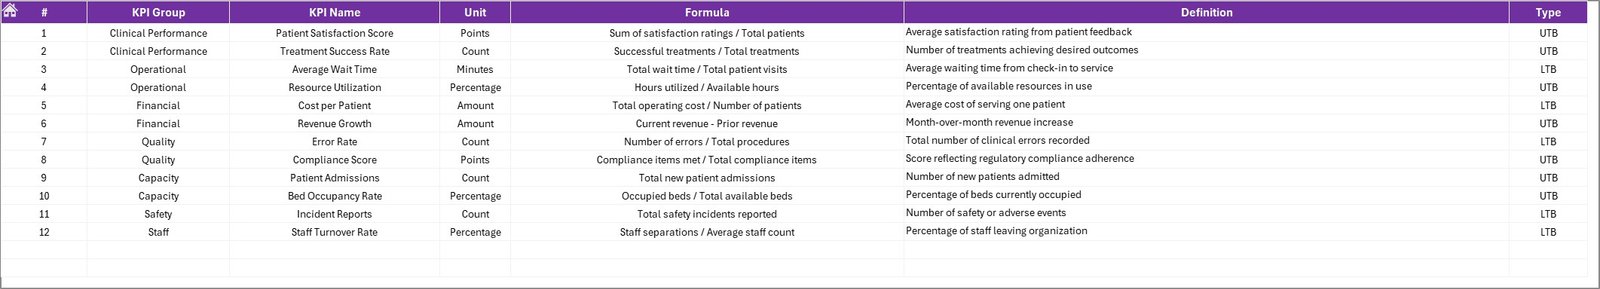
7. KPI Definition Sheet
This sheet is the reference point for all KPIs, requiring input of KPI Name, Group, Unit, Formula, Definition, and Type (LTB – Lower The Better or UTB – Upper The Better). It ensures consistent and accurate interpretation across the dashboard.
 KPI Definition sheet
Advantages of Palliative Care KPI Dashboard
- Data-Driven Decisions: Helps health teams track and improve care quality with concrete metrics.
- Time-Saving: Ready template eliminates complex dashboard creation.
- User Friendly: Clear navigation and input sheets streamline data entry and analysis.
- Visual Insights: Conditional formatting and trend charts highlight performance trends instantly.
- Customizable: Adaptable to various palliative care settings and KPI preferences.
Opportunities for Improvement
Click to Buy Palliative Care KPI Dashboard in Excel
- Integrate real-time data feeds from hospital information systems for automated updates.
- Add predictive analytics to forecast future KPI trends and identify risks early.
- Develop a mobile-friendly version for on-the-go monitoring by healthcare providers.
- Incorporate patient feedback metrics to complement quantitative KPIs.
Best Practices
- Regularly update actual and target data to keep the dashboard relevant.
- Engage multidisciplinary teams in KPI selection and review for comprehensive insights.
- Utilize dashboard insights in monthly performance meetings to drive continuous improvement.
- Ensure KPI definitions and formulas are well documented and understood by all users.
FAQs
Click to Buy Palliative Care KPI Dashboard in Excel
What is the main purpose of the Palliative Care KPI Dashboard?
It enables healthcare professionals to monitor, analyze, and improve palliative care service quality by tracking relevant KPIs systematically.
Is this dashboard customizable?
Yes, users can modify KPI definitions, input values, and months to tailor the dashboard to their specific setting.
Can the dashboard handle data for multiple years?
Currently, it compares current year and previous year data, but can be expanded with historical data input sheets.
Do I need advanced Excel skills to use this dashboard?
No, the dashboard is designed to be user-friendly with clear navigation and input areas. Basic Excel knowledge suffices.
Conclusion
Click to Buy Palliative Care KPI Dashboard in Excel
The Palliative Care KPI Dashboard is an essential tool providing clarity and structure in monitoring palliative care performance. Its dynamic and visually enriched design supports healthcare teams in delivering better care through informed decisions. This ready-to-use template accelerates implementation, making it easier than ever to maintain high standards in this vital healthcare domain.
For those interested in further improving healthcare analytics, Microsoft provides extensive resources on Power BI dashboards which could complement or enhance your reporting needs.
Visit our YouTube channel to watch the demo.
Click to Buy Palliative Care KPI Dashboard in Excel