In today’s fast-paced digital world, businesses generate massive amounts of data every second. However, raw data alone does not create value. Instead, companies need a structured way to analyze, visualize, and act on that data.
So, how can you turn complex datasets into meaningful insights quickly and efficiently?
👉 The answer is the Business Intelligence (BI) Dashboard in Power BI.
This powerful and interactive dashboard helps organizations track performance, monitor KPIs, and make data-driven decisions with confidence. In this comprehensive guide, you will learn everything about this dashboard, including its features, advantages, best practices, and frequently asked questions.
Click to Purchases Business Intelligence (BI) Dashboard in Power BI
📊 What is a Business Intelligence (BI) Dashboard in Power BI?
A Business Intelligence Dashboard in Power BI is a dynamic data visualization tool that transforms raw business data into easy-to-understand visuals like charts, graphs, and KPI cards.
Instead of using multiple spreadsheets and reports, you can:
- Track key performance indicators (KPIs)
- Monitor business operations in real time
- Compare performance across departments
- Identify trends and patterns quickly
- Make faster and smarter decisions
Moreover, Power BI allows you to connect multiple data sources, ensuring that all your business insights stay centralized and accessible.
❓ Why Do Businesses Need a BI Dashboard in Power BI?
Many organizations struggle with scattered data and manual reporting. As a result, they face delays in decision-making and miss growth opportunities.
However, a BI dashboard solves these problems effectively.
Here’s why businesses need it:
- ✅ Centralized data management
- ✅ Real-time performance tracking
- ✅ Faster reporting and analysis
- ✅ Improved decision-making
- ✅ Better collaboration across teams
Therefore, companies that use BI dashboards gain a competitive advantage in today’s data-driven market.
🧩 Key Features of Business Intelligence (BI) Dashboard in Power BI
This dashboard includes 5 powerful analytical pages, each designed to provide deep insights into different aspects of business performance.
Click to Purchases Business Intelligence (BI) Dashboard in Power BI
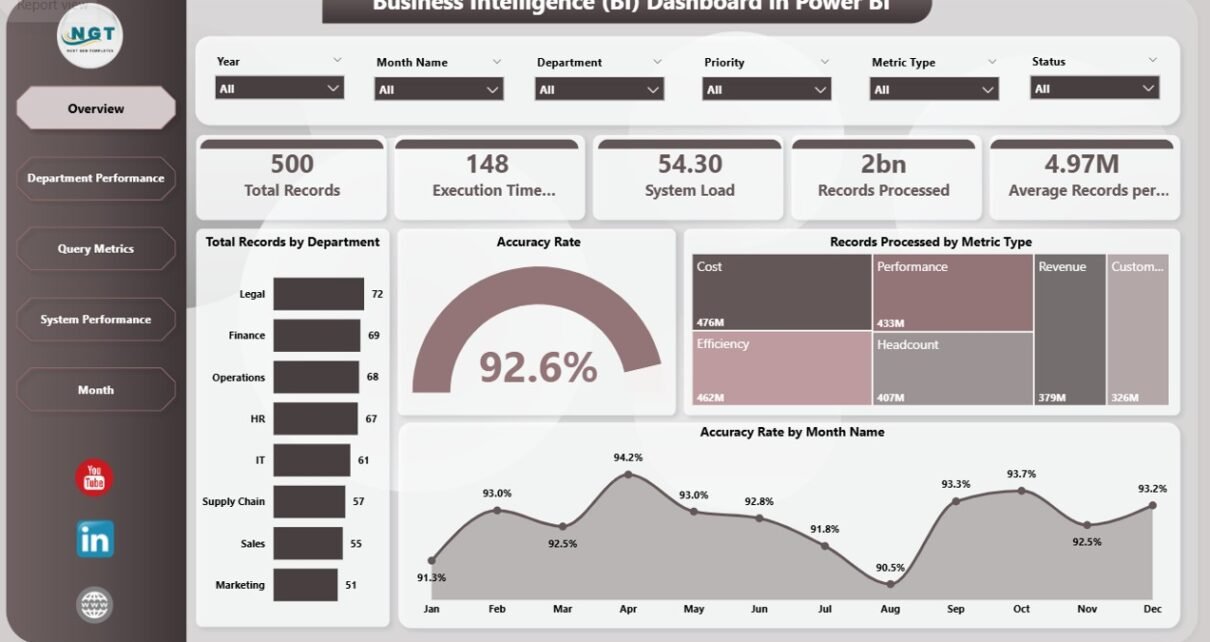
📌 1. Overview Page – Your Business Snapshot
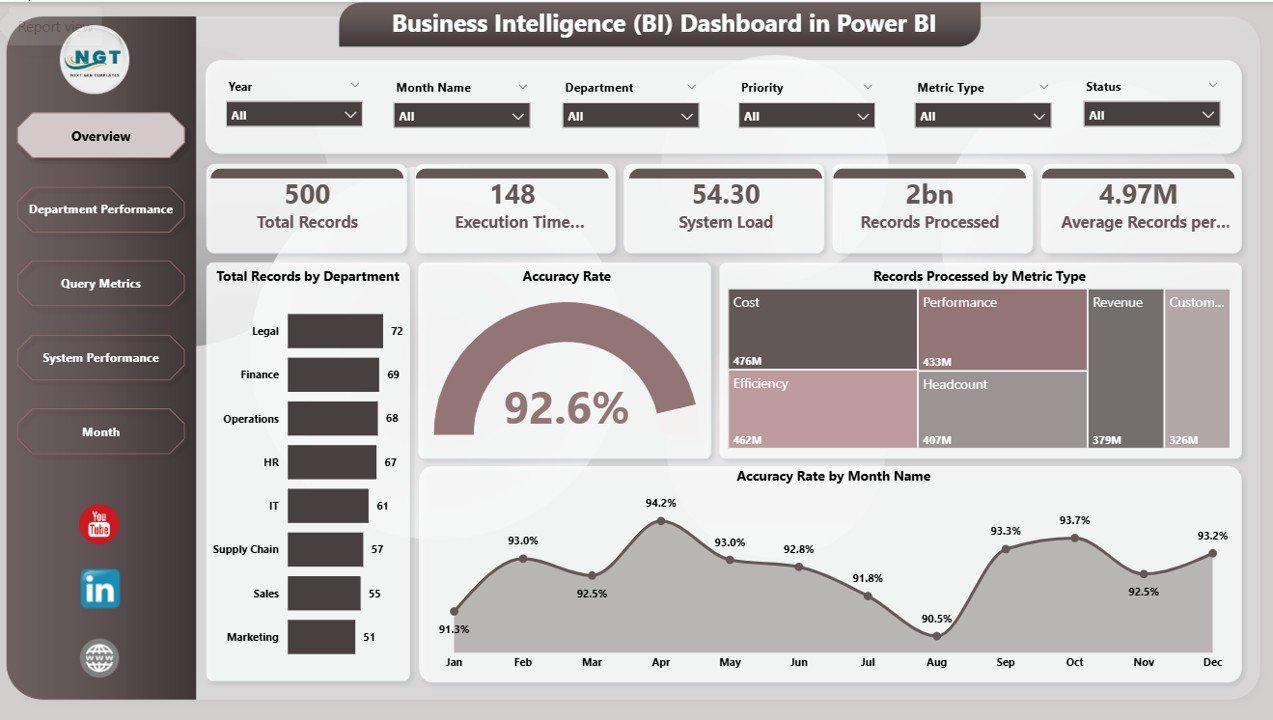
The Overview Page acts as the central hub of the dashboard. It provides a high-level summary of all key metrics.
🔹 Key Highlights:
- 📊 Total Records by Department
- 🎯 Accuracy Rate %
- 📈 Records Processed by Metric Type
- 📅 Accuracy Rate by Month
💡 Why It Matters:
This page allows decision-makers to quickly understand overall performance without diving into details. As a result, you can identify issues instantly and take action.
🏢 2. Department Performance – How Each Team Performs?
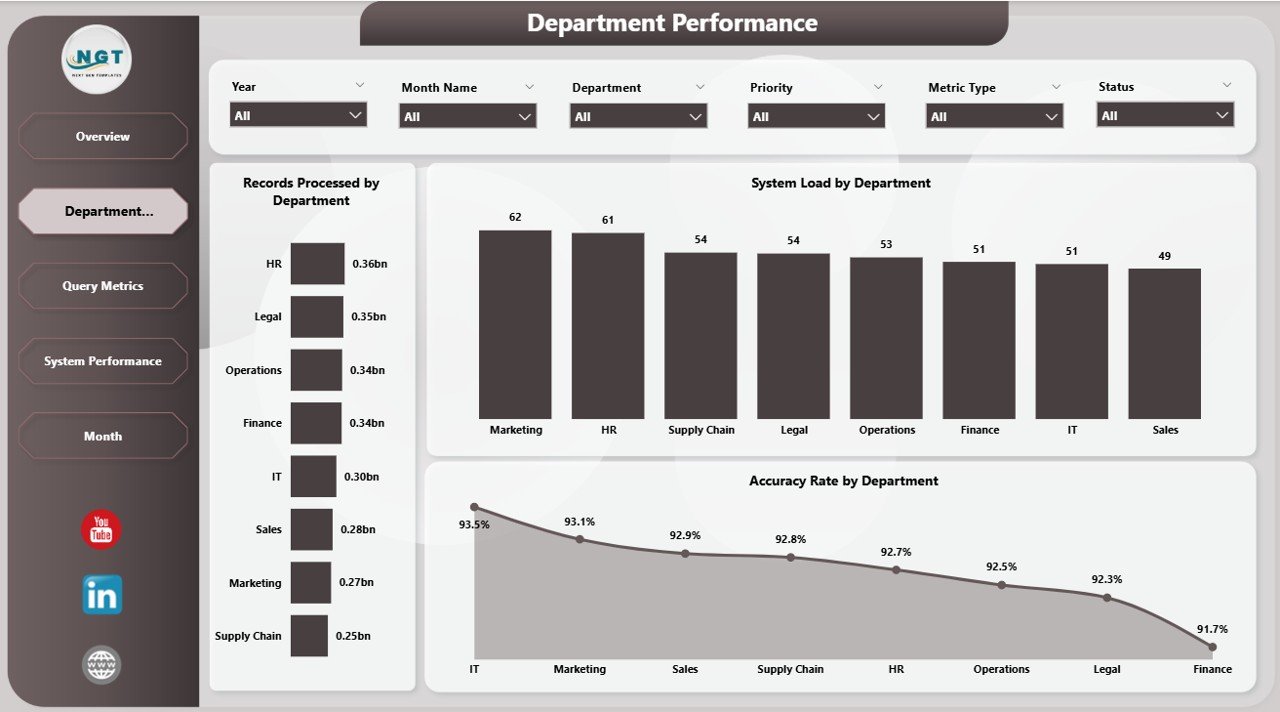
The Department Performance Page focuses on analyzing performance across different departments.
🔹 Key Charts:
- 📊 Records Processed by Department
- ⚙️ System Load by Department
- 🎯 Accuracy Rate by Department
💡 Why It Matters:
This page helps you identify which departments perform well and which need improvement. Therefore, you can allocate resources more effectively.
📊 3. Query Metrics – Understanding Data Complexity
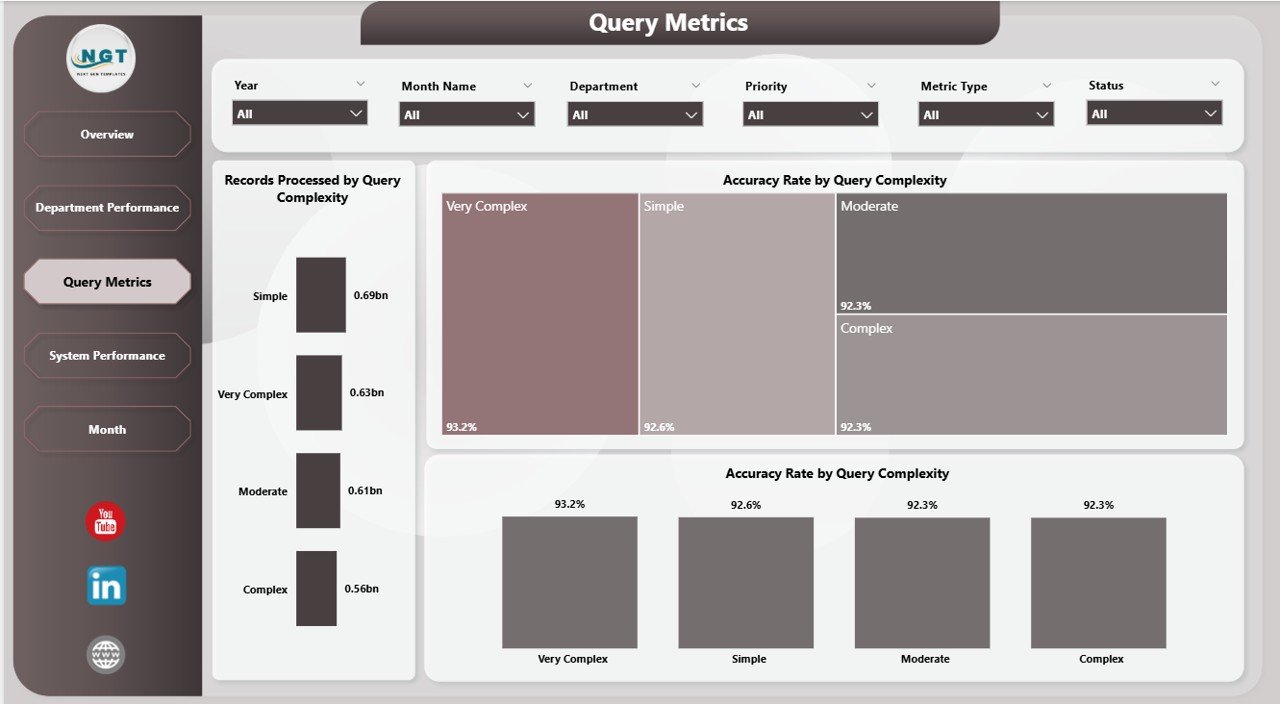
The Query Metrics Page provides insights into how different query complexities affect performance.
🔹 Key Charts:
- 📊 Records Processed by Query Complexity
- 📈 Average Records per Report by Query Complexity
- 🎯 Accuracy Rate by Query Complexity
💡 Why It Matters:
This page helps analysts understand workload distribution and optimize query handling. As a result, system efficiency improves significantly.
Click to Purchases Business Intelligence (BI) Dashboard in Power BI
⚙️ 4. System Performance – Monitor Operational Efficiency
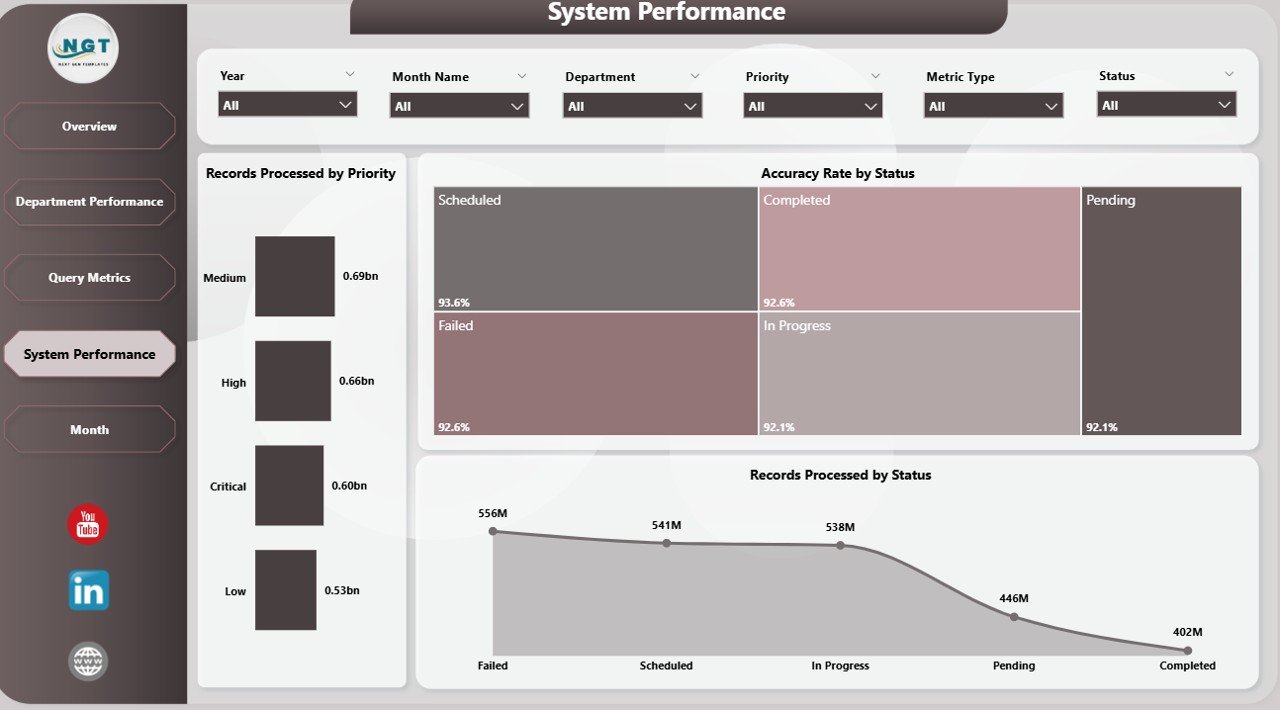
The System Performance Page focuses on tracking system-level performance metrics.
🔹 Key Charts:
- 📊 Records Processed by Priority
- 📈 Accuracy Rate by Priority
💡 Why It Matters:
This page allows IT teams and managers to monitor system load and prioritize tasks effectively. Consequently, it ensures smoother operations.
📅 5. Monthly Analysis – Track Trends Over Time
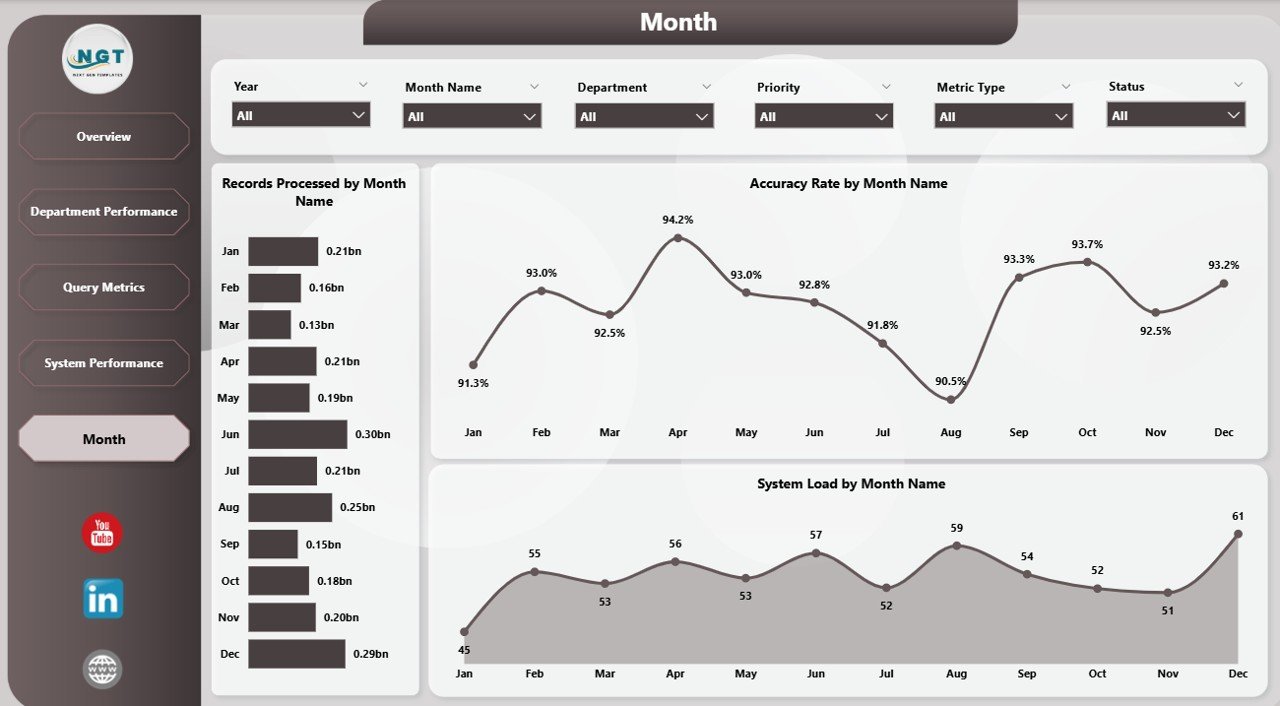
The Month Page provides a time-based analysis of performance.
🔹 Key Charts:
- 📊 Records Processed by Month
- 📈 Accuracy Rate by Month
💡 Why It Matters:
This page helps you identify trends and seasonal patterns. Therefore, businesses can plan better strategies for future growth.
Click to Purchases Business Intelligence (BI) Dashboard in Power BI
🌟 Advantages of Business Intelligence (BI) Dashboard in Power BI
Using a BI dashboard in Power BI offers numerous benefits. Let’s explore them:
✅ 1. Real-Time Insights
You can access live data updates instantly. As a result, you make faster and more accurate decisions.
✅ 2. Improved Data Visualization
Power BI converts complex data into easy visuals. Therefore, even non-technical users can understand insights quickly.
✅ 3. Enhanced Productivity
Since the dashboard automates reporting, teams save time and focus on important tasks.
✅ 4. Better Decision-Making
With clear insights, managers can make informed decisions confidently.
✅ 5. Centralized Data Management
You can connect multiple data sources into one platform. Thus, you eliminate data silos.
✅ 6. Scalability
Power BI dashboards grow with your business. Therefore, you can handle increasing data easily.
⚠️ Opportunities for Improvement in BI Dashboards
Although BI dashboards are powerful, you can still improve them further.
🔧 Areas to Improve:
- 🔹 Add predictive analytics for future forecasting
- 🔹 Improve data refresh speed
- 🔹 Enhance dashboard design for better usability
- 🔹 Integrate AI-driven insights
- 🔹 Optimize data models for performance
By focusing on these improvements, you can maximize the value of your dashboard.
Click to Purchases Business Intelligence (BI) Dashboard in Power BI
🏆 Best Practices for the Business Intelligence (BI) Dashboard in Power BI
To get the best results, you should follow these proven best practices:
✔️ 1. Keep the Dashboard Simple
Avoid clutter and focus on key metrics. This ensures better readability.
✔️ 2. Use Consistent Design
Maintain uniform colors, fonts, and layouts. As a result, users find it easier to navigate.
✔️ 3. Focus on KPIs
Highlight the most important KPIs. Therefore, decision-makers can act quickly.
✔️ 4. Use Interactive Filters (Slicers)
Allow users to customize data views easily. This improves user experience.
✔️ 5. Optimize Performance
Reduce unnecessary visuals and optimize data models. Consequently, the dashboard loads faster.
✔️ 6. Ensure Data Accuracy
Always validate your data sources. Otherwise, incorrect insights may lead to poor decisions.
✔️ 7. Regularly Update the Dashboard
Keep your dashboard updated with the latest data. This ensures relevance and accuracy.
🔮 How Does a BI Dashboard Improve Business Growth?
A BI dashboard directly impacts business growth in several ways:
- 📈 Identifies growth opportunities
- 📊 Tracks performance effectively
- 💡 Provides actionable insights
- 🚀 Improves operational efficiency
- 🤝 Enhances collaboration
As a result, businesses achieve better outcomes and long-term success.
🧠 Who Can Benefit from This Dashboard?
This dashboard serves multiple roles across industries:
- 👨💼 Business Managers
- 📊 Data Analysts
- 💻 IT Teams
- 🏢 Department Heads
- 📈 Executives
Therefore, anyone involved in decision-making can benefit from this powerful tool.
🏁 Conclusion
The Business Intelligence (BI) Dashboard in Power BI is not just a reporting tool—it is a complete solution for modern data-driven businesses.
It simplifies complex data, improves visibility, and enables smarter decisions. Moreover, it helps organizations stay competitive in a rapidly evolving market.
If you want to unlock the full potential of your data, then this dashboard is a must-have tool.
❓ Frequently Asked Questions (FAQs)
🔹 1. What is Power BI used for?
Power BI is a business analytics tool used to visualize data and share insights across an organization.
🔹 2. Is Power BI suitable for small businesses?
Yes, Power BI is scalable and affordable. Therefore, small businesses can also benefit from it.
🔹 3. Can I connect multiple data sources to Power BI?
Yes, Power BI supports multiple data sources like Excel, SQL, and cloud services.
🔹 4. Do I need coding skills to use Power BI?
No, Power BI offers a user-friendly interface. However, basic knowledge of data helps.
🔹 5. How often should I update my dashboard?
You should update it regularly or use real-time data connections for accurate insights.
🔹 6. What makes a good BI dashboard?
A good dashboard is simple, interactive, accurate, and focused on key metrics.
Visit our YouTube channel to learn step-by-step video tutorials
Click to Purchases Business Intelligence (BI) Dashboard in Power BI