In today’s healthcare industry, rehabilitation homes must deliver consistent patient care while maintaining operational efficiency. However, many facilities still rely on manual reporting and disconnected data systems. As a result, they struggle to monitor KPIs, track performance, and make timely decisions.
So, how can rehabilitation centers track patient recovery, monitor performance, and compare targets effectively?
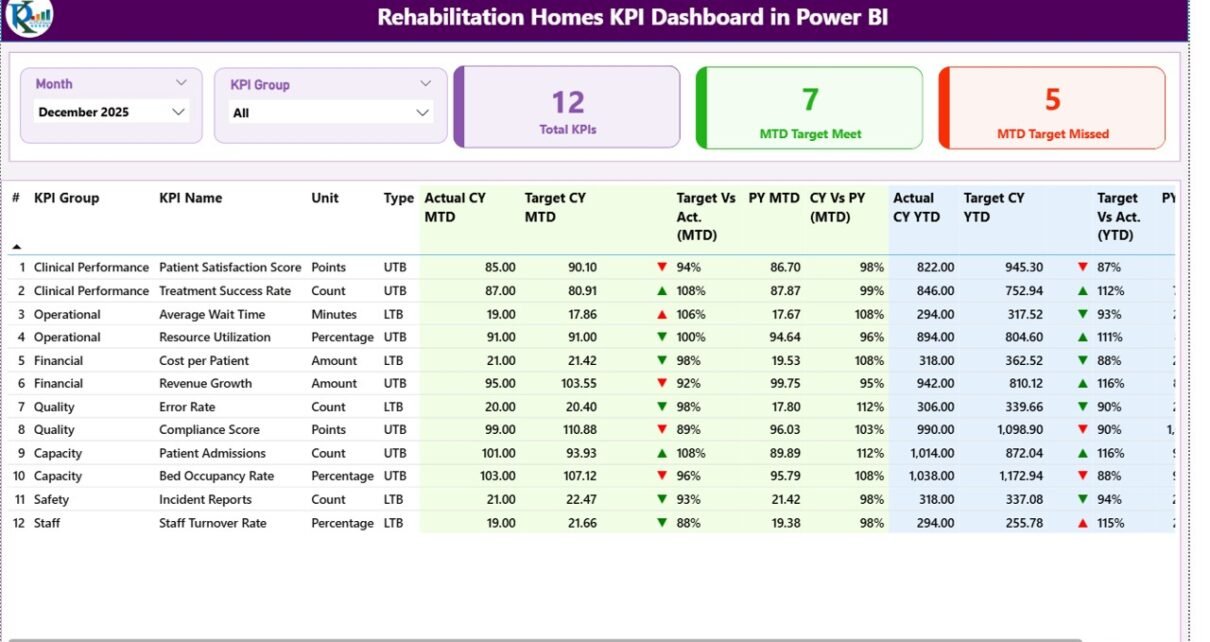
Rehabilitation Homes KPI Dashboard in Power BI
This powerful and interactive dashboard helps healthcare professionals track KPIs, compare actual vs target performance, and analyze trends in one place. In this article, you will learn everything about this dashboard, including its features, structure, benefits, and best practices.
What is a Rehabilitation Homes KPI Dashboard in Power BI?
A Rehabilitation Homes KPI Dashboard in Power BI is a data visualization tool that helps track and analyze key performance indicators related to patient care, operational efficiency, and financial performance.
Instead of using multiple spreadsheets, this dashboard consolidates all data into one centralized platform. Therefore, decision-makers can quickly identify trends and improve performance.
Why Do Rehabilitation Homes Need a KPI Dashboard?
Click to Buy Rehabilitation Homes KPI Dashboard in Power BI
Managing rehabilitation facilities involves tracking multiple metrics such as patient recovery, therapy efficiency, and cost performance. However, without a proper system, it becomes difficult to monitor everything.
Key Reasons:
- 📊 Centralized KPI monitoring
- ⏱️ Faster and smarter decisions
- 📈 Improved performance tracking
- 🏥 Better patient outcomes
- 💡 Data-driven insights
As a result, rehabilitation homes can improve both care quality and operational efficiency.
What Are the Key Features of This Dashboard?
This dashboard includes 3 interactive pages in Power BI. Each page focuses on a specific area of analysis.
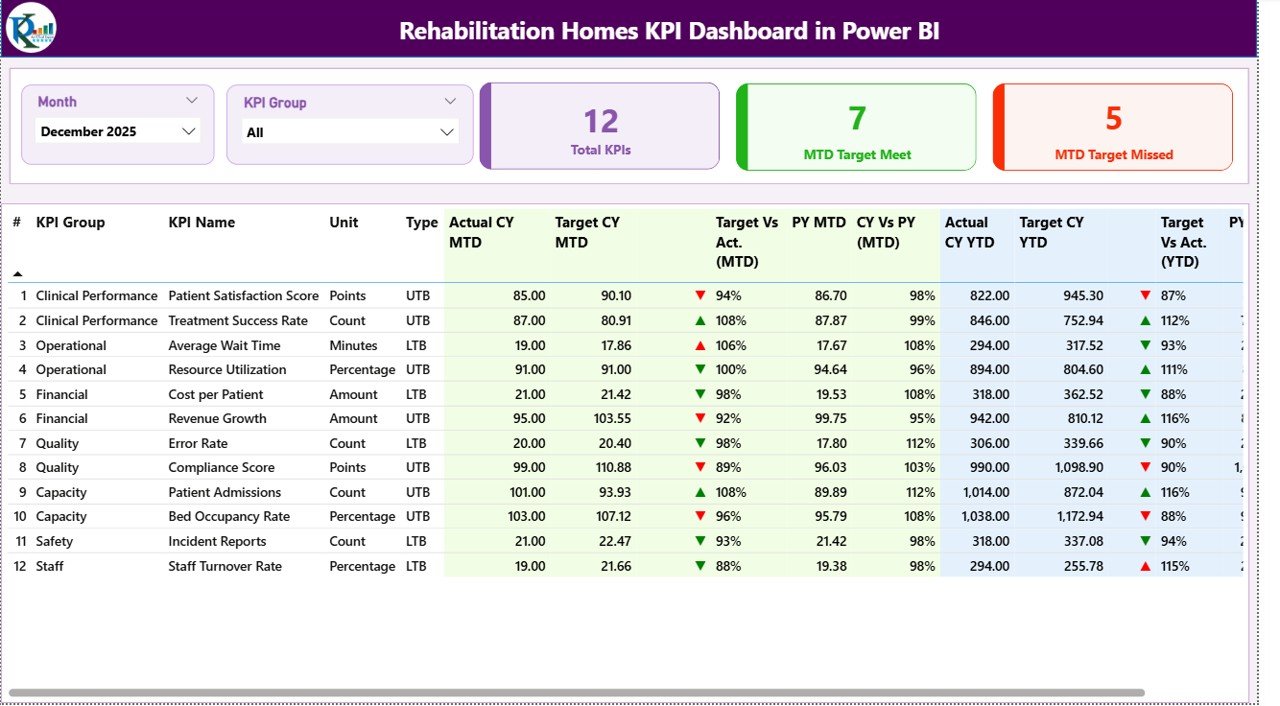
How Does the Summary Page Help in KPI Monitoring?
The Summary Page is the main page of the dashboard. It provides a complete overview of all KPIs.
Key Elements:
- 📅 Month Slicer for dynamic filtering
- 📂 KPI Group Slicer for category-wise insights
KPI Cards:
- Total KPIs Count
- MTD Target Meet Count
- MTD Target Missed Count
Detailed KPI Table Includes:
- KPI Number
- KPI Group
- KPI Name
- Unit of Measurement
- KPI Type (LTB – Lower the Better / UTB – Upper the Better)
Performance Metrics:
- Actual CY MTD vs Target CY MTD
- Target vs Actual (MTD) = Actual / Target
- PY MTD Comparison
- CY vs PY (MTD)
- Actual CY YTD vs Target CY YTD
- Target vs Actual (YTD) = Actual / Target
- PY YTD Comparison
- CY vs PY (YTD)
Visual Indicators:
- ▲ Green Arrow = Good Performance
- ▼ Red Arrow = Needs Improvement
Because of these features, users can instantly understand KPI performance.
Click to Buy Rehabilitation Homes KPI Dashboard in Power BI
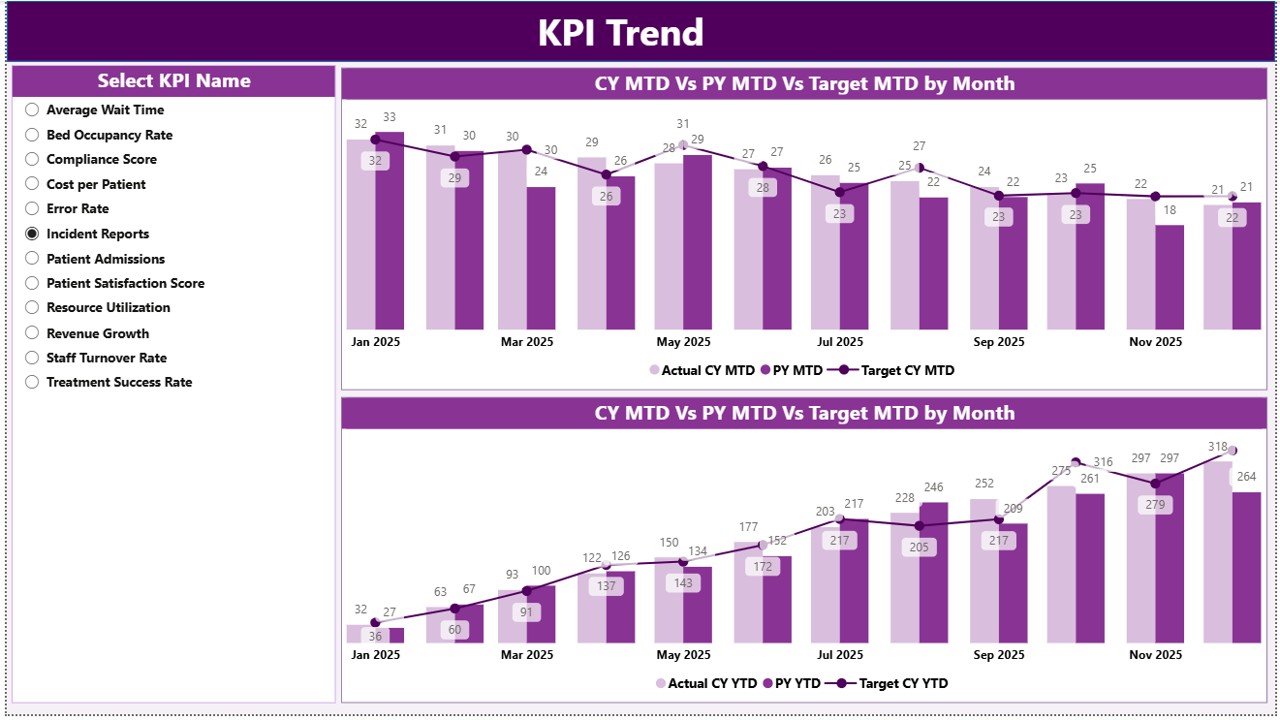
How Does the KPI Trend Page Improve Analysis?
The KPI Trend Page helps track performance over time.
Features:
- 📊 Two combo charts for MTD and YTD
- 📈 Comparison of:
- Current Year Actual
- Previous Year Actual
- Target Values
Interactive Slicer:
- Select KPI Name to analyze specific KPIs
Benefits:
- Identifies performance trends
- Tracks improvements over time
- Supports forecasting and planning
Click to Buy Rehabilitation Homes KPI Dashboard in Power BI
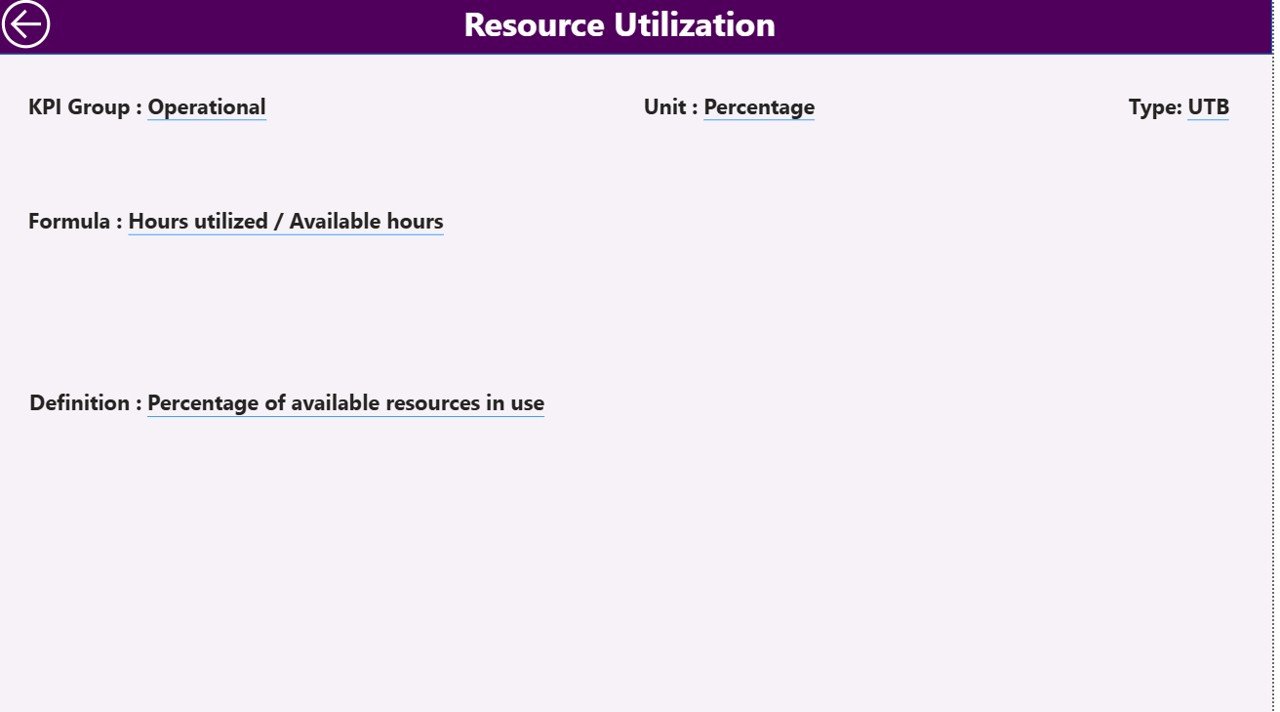
What is the Purpose of the KPI Definition Page?
The KPI Definition Page is a drill-through page. It provides detailed information about each KPI.
Includes:
- KPI Formula
- KPI Definition
- KPI Type (LTB or UTB)
Why It’s Important:
- Ensures clarity in KPI tracking
- Improves accuracy of analysis
- Supports better decision-making
Additionally, users can return to the main page using the back button.
Click to Buy Rehabilitation Homes KPI Dashboard in Power BI
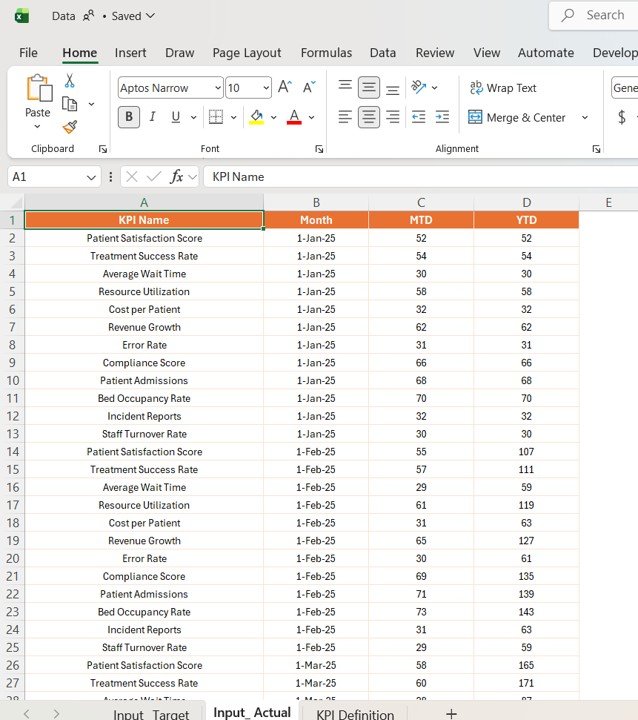
How Does the Excel Data Source Work?
This dashboard uses an Excel file as its data source. Therefore, managing and updating data becomes simple.
Required Worksheets:
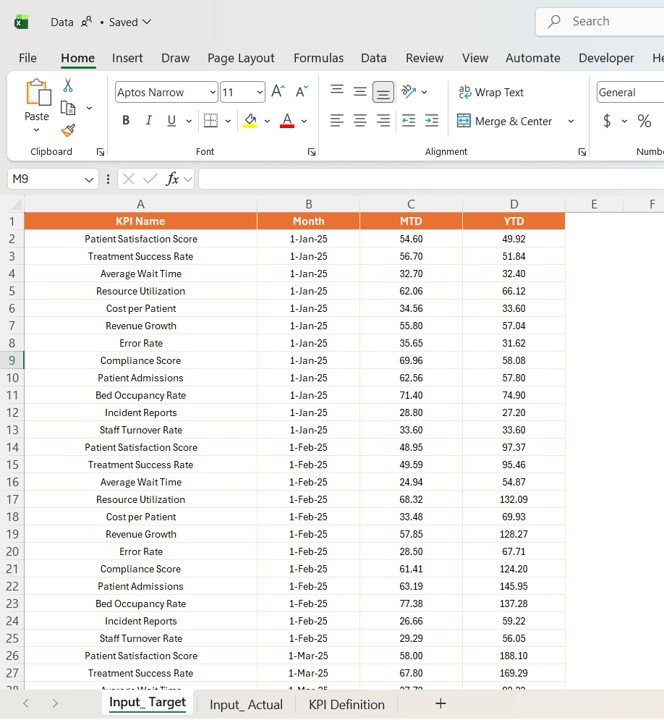
1) Input_Actual Sheet:
- Enter KPI Name
- Month (First date of the month)
- MTD Values
- YTD Values
Click to Buy Rehabilitation Homes KPI Dashboard in Power BI
2) Input_Target Sheet:
- Enter Target values for each KPI
- Include both MTD and YTD numbers
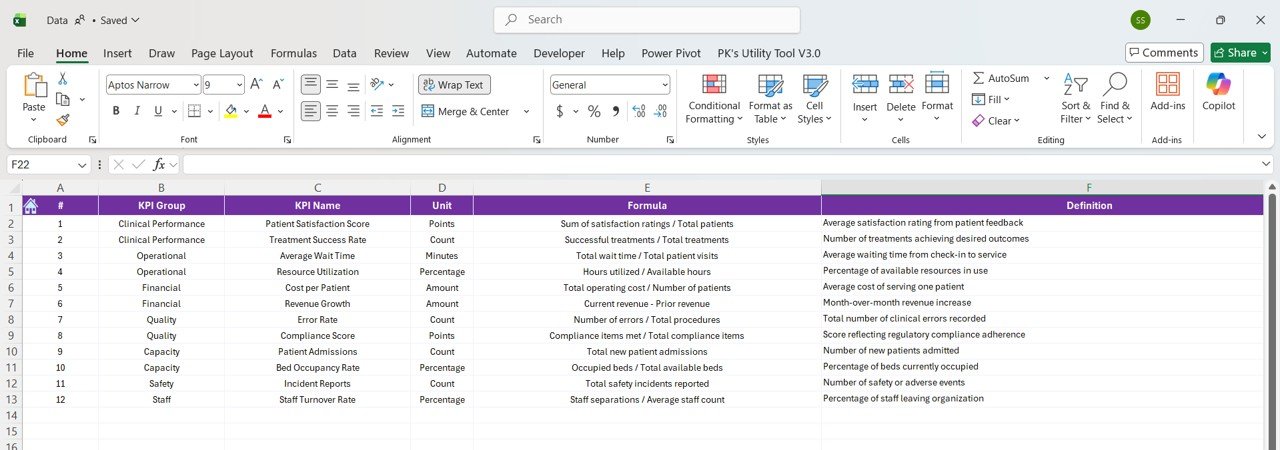
3) KPI Definition Sheet:
- KPI Number
- KPI Group
- KPI Name
- Unit
- Formula
- Definition
- Type (LTB or UTB)
Because of this structure, users can easily maintain accurate data.
Click to Buy Rehabilitation Homes KPI Dashboard in Power BI
Advantages of Rehabilitation Homes KPI Dashboard in Power BI
This dashboard provides multiple benefits. Therefore, it becomes essential for healthcare organizations.
Key Advantages:
- ✅ Real-time KPI tracking
- ✅ Easy-to-use interactive design
- ✅ Improved patient care insights
- ✅ Better performance monitoring
- ✅ Faster decision-making
- ✅ Reduced manual reporting
Moreover, it enhances operational efficiency significantly.
How Can This Dashboard Improve Patient Recovery Outcomes?
This dashboard plays a key role in improving patient care.
It Helps You:
- Monitor recovery KPIs
- Track therapy performance
- Identify gaps in treatment
- Improve service quality
As a result, rehabilitation centers can deliver better patient outcomes.
Best Practices for the Rehabilitation Homes KPI Dashboard in Power BI
Click to Buy Rehabilitation Homes KPI Dashboard in Power BI
To maximize the benefits of this dashboard, you should follow best practices.
Best Practices:
- 📌 Update data regularly
- 📌 Maintain clean and accurate data
- 📌 Use slicers for detailed analysis
- 📌 Monitor KPIs consistently
- 📌 Customize visuals for clarity
- 📌 Validate KPI definitions
Additionally, reviewing KPIs monthly helps improve long-term performance.
Who Can Benefit from This Dashboard?
This dashboard is designed for various healthcare professionals.
Target Users:
- 🏥 Rehabilitation center administrators
- 👩⚕️ Healthcare managers
- 📊 Data analysts
- 💼 Finance teams
- 🧾 Healthcare consultants
Therefore, anyone involved in healthcare analytics can use it effectively.
How to Use the Rehabilitation Homes KPI Dashboard in Power BI?
Click to Buy Rehabilitation Homes KPI Dashboard in Power BI
Using this dashboard is simple and user-friendly.
Steps:
- Enter data into Excel sheets
- Load data into Power BI
- Refresh the dashboard
- Apply filters using slicers
- Analyze KPI insights
Because of its intuitive design, users can easily navigate and use it.
Conclusion: Why Should You Use This Dashboard?
In conclusion, the Rehabilitation Homes KPI Dashboard in Power BI is a powerful tool for healthcare analytics.
It helps you:
- Track KPI performance
- Compare actual vs target
- Analyze trends
- Improve patient care
Therefore, if you want to make smarter, data-driven decisions, this dashboard is the ideal solution.
Visit our YouTube channel to learn step-by-step video tutorials
Click to Buy Rehabilitation Homes KPI Dashboard in Power BI