Introduction
Robotics Training Institutes KPI Dashboard in Power BI is a powerful, ready-to-use template designed to help robotics academies, STEM training centers, and technical education providers track their most critical performance metrics from a single interactive dashboard. In an industry where student outcomes, instructor quality, and operational efficiency directly impact growth and reputation, having a structured KPI tracking system is no longer optional — it is essential.
This KPI Dashboard brings together Month-to-Date (MTD) and Year-to-Date (YTD) data for Actuals, Targets, and Previous Year benchmarks into one clean interface. With conditional formatting arrows, individual KPI trend analysis, and dedicated data input pages, it empowers training managers and institute directors to make data-driven decisions confidently and quickly.
Click here to Purchase Robotics Training Institutes KPI Dashboard in Power BI
Key Features of Robotics Training Institutes KPI Dashboard in Power BI
- 6 Professionally Designed Pages — Includes Dashboard, KPI Trend, Actual Numbers Input, Target Number Input, Previous Year Number, and KPI Definition pages for complete performance management.
- Dynamic Month Selection — A simple drop-down filter lets you select any month, and the entire dashboard refreshes instantly with updated MTD and YTD data.
- Conditional Formatting with Trend Arrows — Up and down arrows clearly indicate whether each KPI is performing above or below targets and previous year benchmarks, making performance assessment instant.
- Individual KPI Deep-Dive — The KPI Trend page lets you select any single KPI to view its group, unit, formula, definition, type (LTB or UTB), and detailed MTD/YTD trend charts.
- Structured Data Input Pages — Separate pages for Actual, Target, and Previous Year numbers keep data organized and reduce input errors.
- KPI Definition Library — A dedicated page documents every KPI’s name, group, unit, formula, definition, and type for standardized interpretation across your team.
- Year-Over-Year Comparison — Built-in previous year benchmarking enables long-term trend analysis and growth tracking.
- Fully Customizable KPIs — Add, modify, or remove KPIs to match your specific institute’s reporting requirements.
Dashboard Pages Explanation
1. Dashboard Page
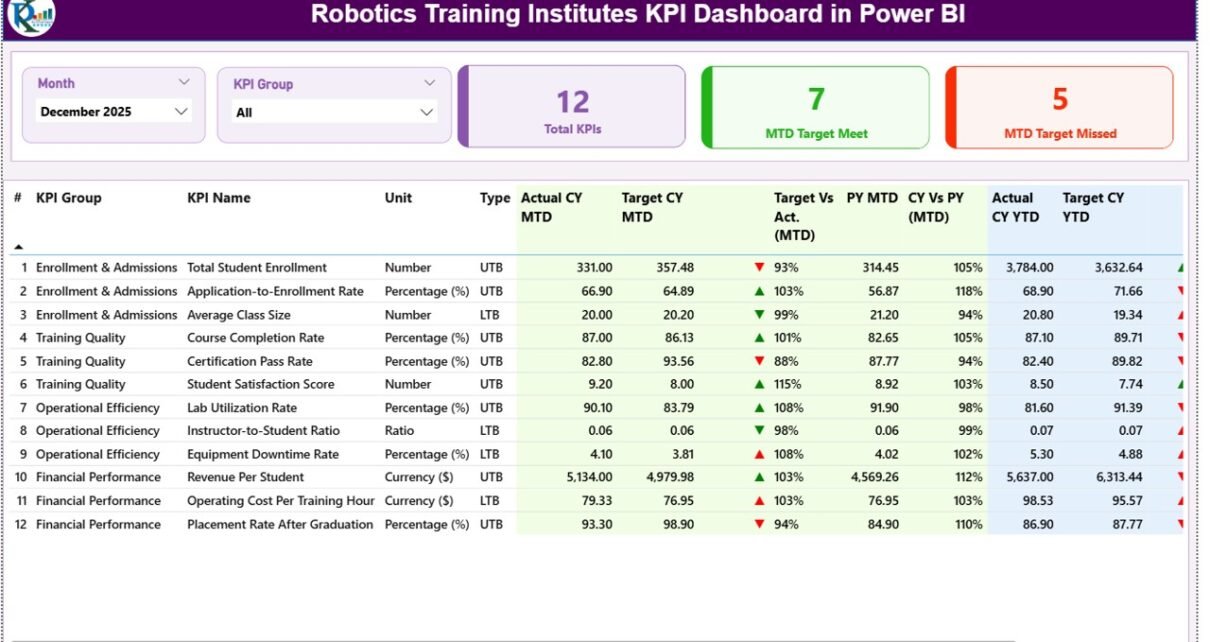
This is the main command center of the Robotics Training Institutes KPI Dashboard in Power BI. It displays all KPIs at a glance. You can select a month from the drop-down filter, and the entire dashboard updates dynamically to show the chosen period’s data.
The page presents MTD Actual, Target, and Previous Year data alongside YTD Actual, Target, and Previous Year figures. Conditional formatting with up and down arrows provides instant visual comparison for Target vs Actual and Previous Year vs Actual performance, making it effortless to spot KPIs that need attention.
Robotics Training Institutes KPI Dashboard in Power BIClick here to Purchase Robotics Training Institutes KPI Dashboard in Power BI
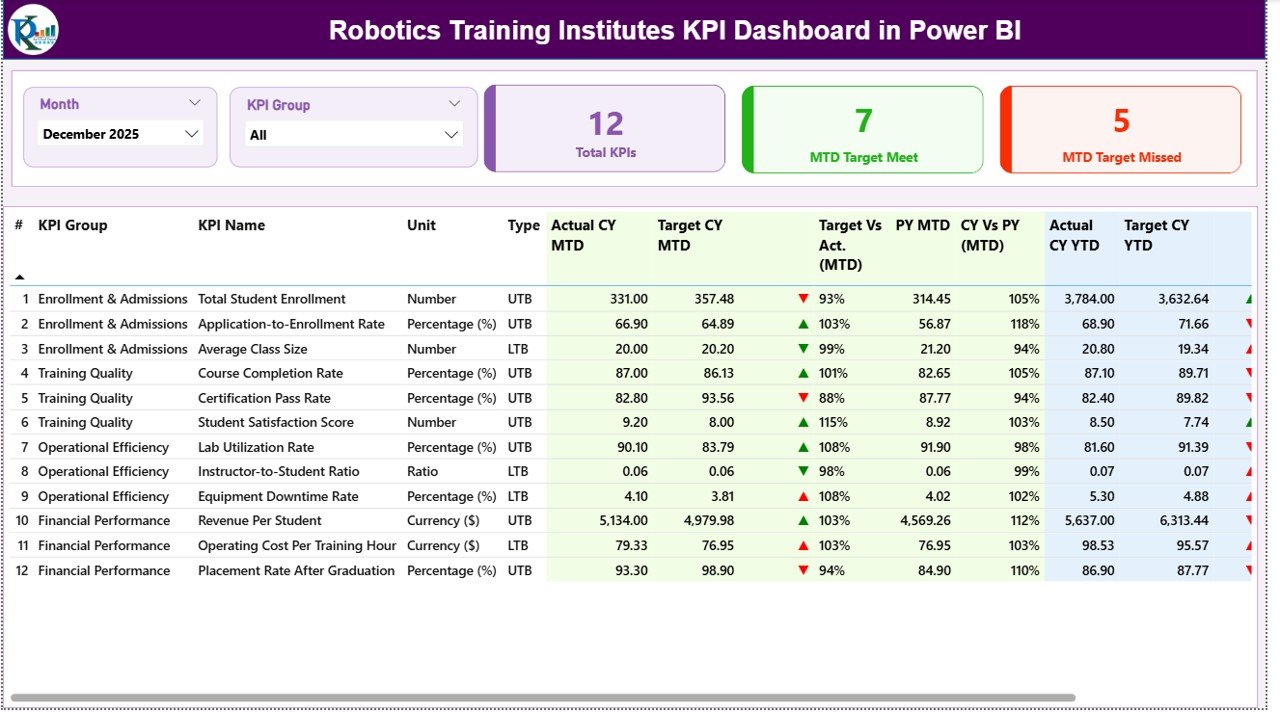
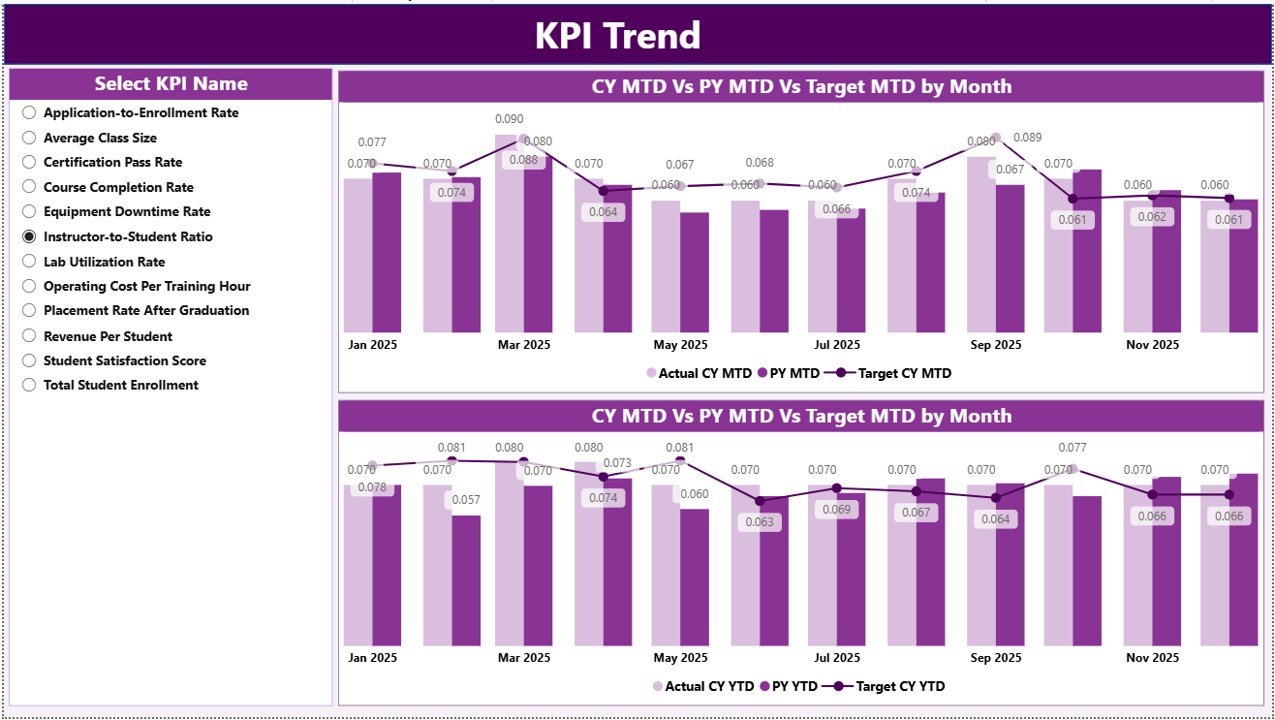
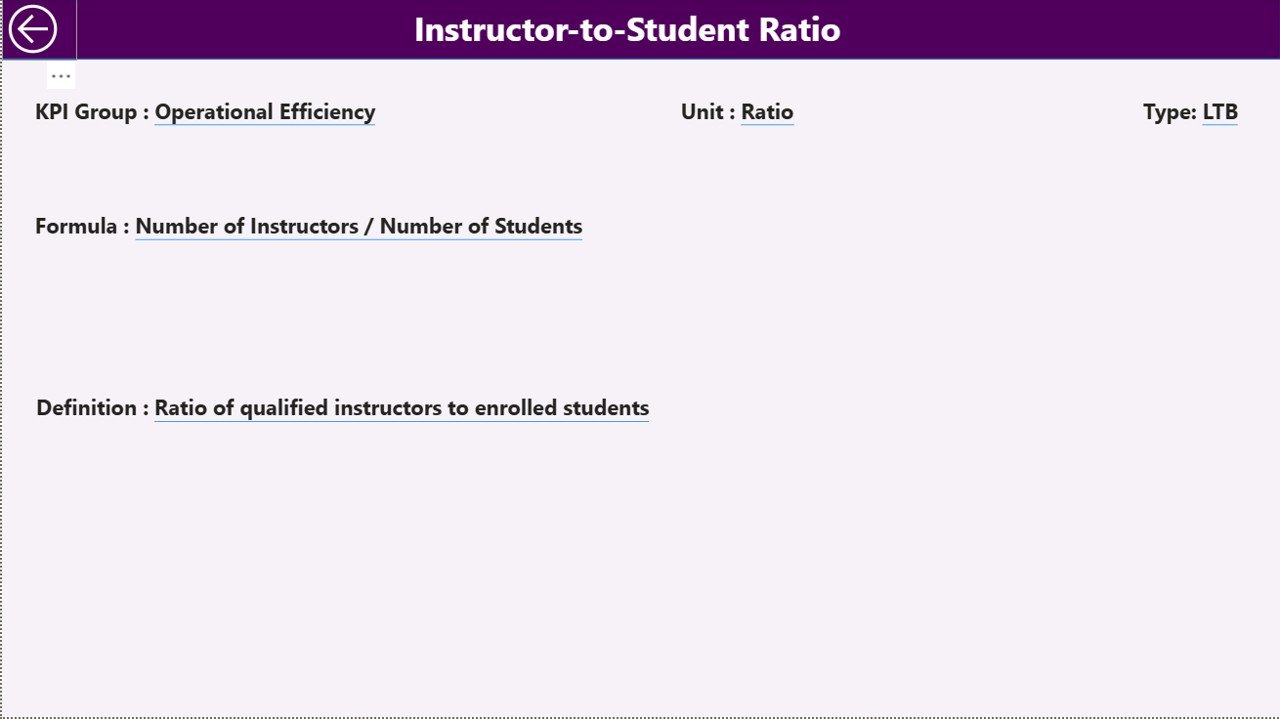
2. KPI Trend Page
The KPI Trend page enables detailed analysis of individual KPIs. By selecting a KPI from the drop-down, you can view its KPI Group, Unit of measurement, Type (Lower the Better or Upper the Better), Formula, and Definition. The page also displays MTD and YTD trend charts that compare Actual, Target, and Previous Year values over time, helping you identify recurring patterns, seasonal variations, and performance trajectories.
 KPI Trend Page
Click here to Purchase Robotics Training Institutes KPI Dashboard in Power BI
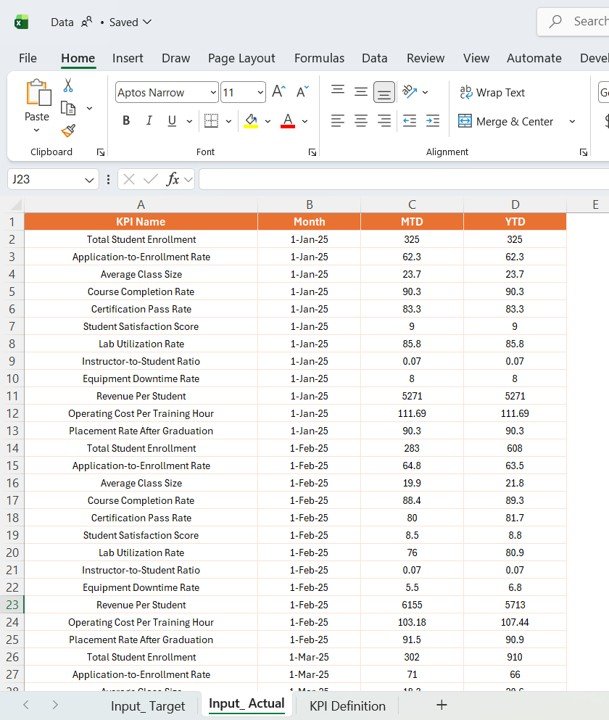
3. Actual Numbers Input Page
This page is designed for entering the actual performance figures for each KPI. Users input both MTD and YTD actual values organized by month. The starting month of the year can be configured to match your institute’s fiscal calendar. Once data is entered here, it automatically feeds into the Dashboard and KPI Trend pages for real-time analysis.
 Actual Numbers Input Page
4. Target Number Input Page
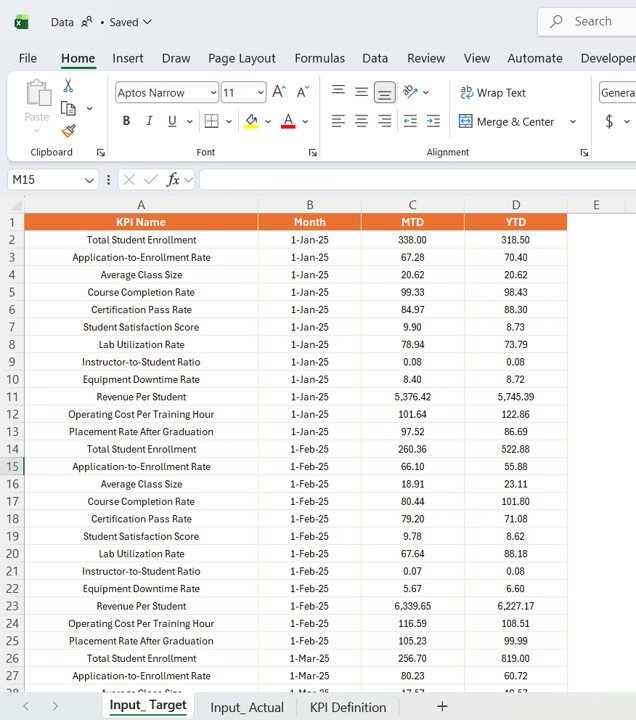
Here you define your performance benchmarks by entering monthly target numbers for each KPI — both MTD and YTD targets. These targets serve as the comparison baseline on the Dashboard page, enabling you to measure how actual performance stacks up against your planned goals for the robotics training institute.
 Target Number Input Page
Click here to Purchase Robotics Training Institutes KPI Dashboard in Power BI
5. Previous Year Number Page
This page captures historical performance data from the previous year in the same structured format. By entering prior year MTD and YTD numbers, you enable powerful year-over-year comparisons on the Dashboard page. This is essential for identifying growth trends, understanding seasonal patterns, and setting realistic targets for the current year.
 Previous Year Number Page
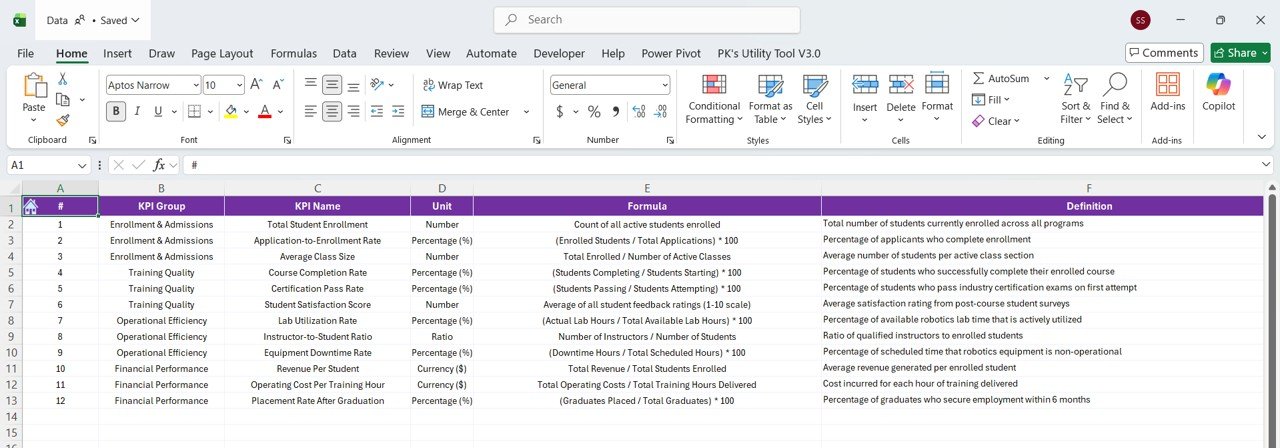
6. KPI Definition Page
The KPI Definition page serves as the reference library for all tracked metrics. For each KPI, you document the KPI Name, KPI Group, Unit of measurement, Formula, detailed Definition, and KPI Type (LTB — Lower the Better, or UTB — Upper the Better). This ensures every team member interprets KPIs consistently and uses them correctly when making decisions.
 KPI Definition Page
Click here to Purchase Robotics Training Institutes KPI Dashboard in Power BI
Advantages of Robotics Training Institutes KPI Dashboard in Power BI
- Centralized Performance Monitoring — All critical training institute KPIs are consolidated into one interactive Power BI dashboard, eliminating the need for scattered spreadsheets and manual reports.
- Time-Saving Automation — Dynamic filters and conditional formatting arrows eliminate manual calculations and provide instant performance insights with a single click.
- Data-Driven Decision Making — MTD, YTD, and year-over-year comparisons provide the factual foundation needed for strategic planning and resource allocation.
- Improved Accountability — Clear target vs actual comparisons make it easy to hold departments and instructors accountable for their performance metrics.
- Scalable and Flexible — Works equally well for a single robotics training center or a network of multiple institutes with different KPIs and reporting needs.
- Professional Presentation — Clean Power BI visuals make it easy to share performance reports with stakeholders, board members, and investors.
Opportunities for Improvement
Click here to Purchase Robotics Training Institutes KPI Dashboard in Power BI
- Integrate live data connections from Student Information Systems (SIS) or Learning Management Systems (LMS) to automate data entry and enable real-time KPI updates.
- Add predictive analytics capabilities using Power BI’s AI visuals to forecast enrollment trends, revenue projections, and student performance outcomes.
- Incorporate role-based access controls through Power BI Service to ensure different team members see only the KPIs relevant to their responsibilities.
- Enable mobile-friendly views through the Power BI mobile app for on-the-go performance monitoring by institute directors.
- Add drill-through pages that allow users to click on a KPI and explore the underlying data records in detail.
Best Practices
- Update Actual, Target, and Previous Year numbers consistently at the end of each month for accurate and timely KPI tracking.
- Review KPI definitions periodically to ensure they remain aligned with your institute’s evolving strategic goals and operational priorities.
- Use the KPI Trend page regularly to identify emerging patterns and address performance issues before they escalate.
- Leverage conditional formatting arrows as early warning signals — a downward arrow on a key metric should trigger immediate investigation and corrective action.
- Share the dashboard with key stakeholders using Power BI Service to foster transparency and collaborative decision-making across your training institute.
Explore Relevant Templates
If you found this Robotics Training Institutes KPI Dashboard in Power BI useful, explore these related templates on NextGenTemplates:
- Robotics Training Institutes KPI Dashboard in Excel
- Corporate Training Providers KPI Dashboard in Power BI
- Coding Bootcamps KPI Dashboard in Excel
- Education Services Dashboard in Power BI
- Skill Development Missions Dashboard in Power BI
FAQs
Q: Can I add custom KPIs to this Power BI dashboard?
A: Yes, you can add new KPIs by updating the KPI Definition page with the new metric’s details and entering corresponding Actual, Target, and Previous Year data in the respective input pages. The Dashboard and KPI Trend pages will automatically reflect the additions.
Q: Do I need Power BI Pro to use this template?
A: No, you can use this template with the free Power BI Desktop application. Power BI Pro or Premium is only needed if you want to share the dashboard with others through Power BI Service in the cloud.
Q: How is this different from the Excel version of the same dashboard?
A: While the Excel version uses worksheets and manual navigation, the Power BI version offers interactive filtering, dynamic visualizations, and the ability to connect to live data sources. Power BI also supports sharing dashboards online and on mobile devices.
Q: What KPIs are typically tracked for robotics training institutes?
A: Common KPIs include Student Enrollment Rate, Course Completion Rate, Student Satisfaction Score, Instructor Utilization Rate, Revenue Per Student, Placement Rate, Lab Equipment Utilization, Training Hours Delivered, Certification Pass Rate, and Student Retention Rate.
Q: How often should I update the dashboard data?
A: Monthly updates are recommended for most training institutes. However, if your institute operates on shorter reporting cycles or has access to real-time data feeds, more frequent updates can provide even greater visibility into performance trends.
Conclusion
Click here to Purchase Robotics Training Institutes KPI Dashboard in Power BI
The Robotics Training Institutes KPI Dashboard in Power BI is an essential performance management tool for any robotics academy or technical training center serious about tracking and improving their results. With its intuitive design, comprehensive KPI coverage, conditional formatting indicators, and detailed trend analysis capabilities, this dashboard transforms raw training data into clear, actionable intelligence that drives better decisions.
Whether you are monitoring enrollment numbers, evaluating instructor performance, or tracking financial KPIs, this Power BI template gives you the visibility you need — all in one place. Start tracking your training institute’s performance smarter and faster today.
For more information on getting started with Power BI, visit Microsoft Power BI Documentation.
Visit our YouTube channel to watch step-by-step tutorials: Youtube.com/@PK-AnExcelExpert
Click here to Purchase Robotics Training Institutes KPI Dashboard in Power BI