Introduction
The Space Education Programs KPI Dashboard in Power BI is an insightful and dynamic tool designed for monitoring and analyzing key performance indicators (KPIs) related to space education initiatives. Utilizing data captured in an Excel file, this dashboard provides a comprehensive overview and deep dive analysis of performance metrics, empowering education managers and stakeholders to make data-driven decisions efficiently.Space Education Programs KPI Dashboard in Power BI
Key Features of Space Education Programs KPI Dashboard in Power BI
- Interactive slicers for Month and KPI Group enable swift filtering and data exploration.
- Summary cards highlight total KPIs, Month-To-Date (MTD) target meets, and misses.
- Detailed KPI tables presenting critical metrics such as Actual vs Target MTD/YTD values with visual indicators.Space Education Programs KPI Dashboard in Power BI
- Multi-page design including Summary, KPI Trend, and KPI Definition pages for organized navigation.
- Drill-through functionality to explore KPI definitions and formulas in detail.
- Excel as a data source with structured sheets for Actuals, Targets, and KPI definitions ensuring easy data updates.Space Education Programs KPI Dashboard in Power BI
Dashboard Pages Explanation
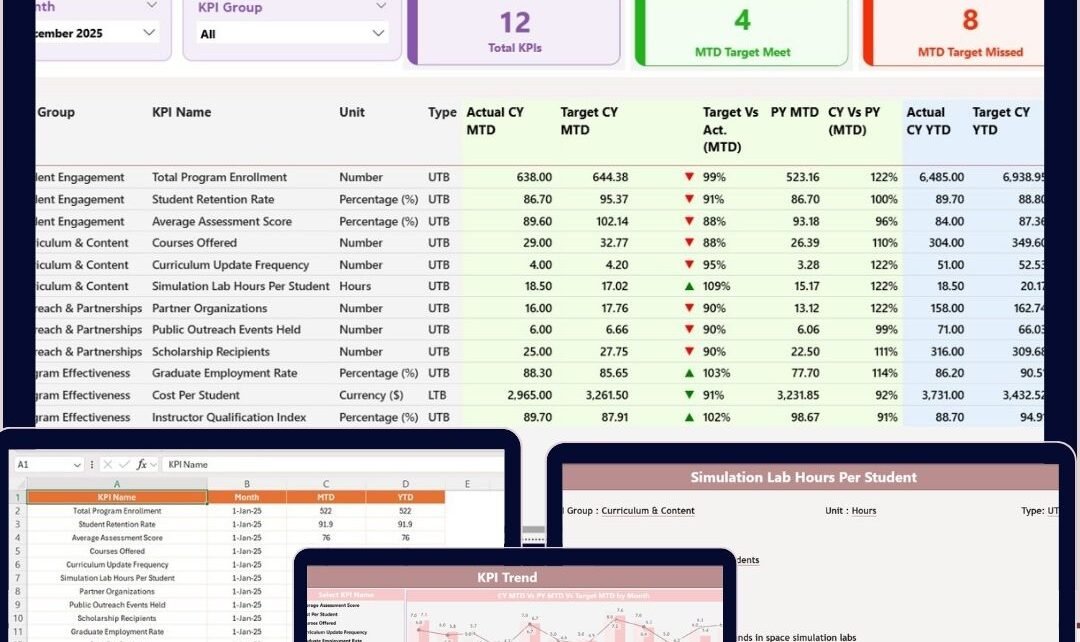
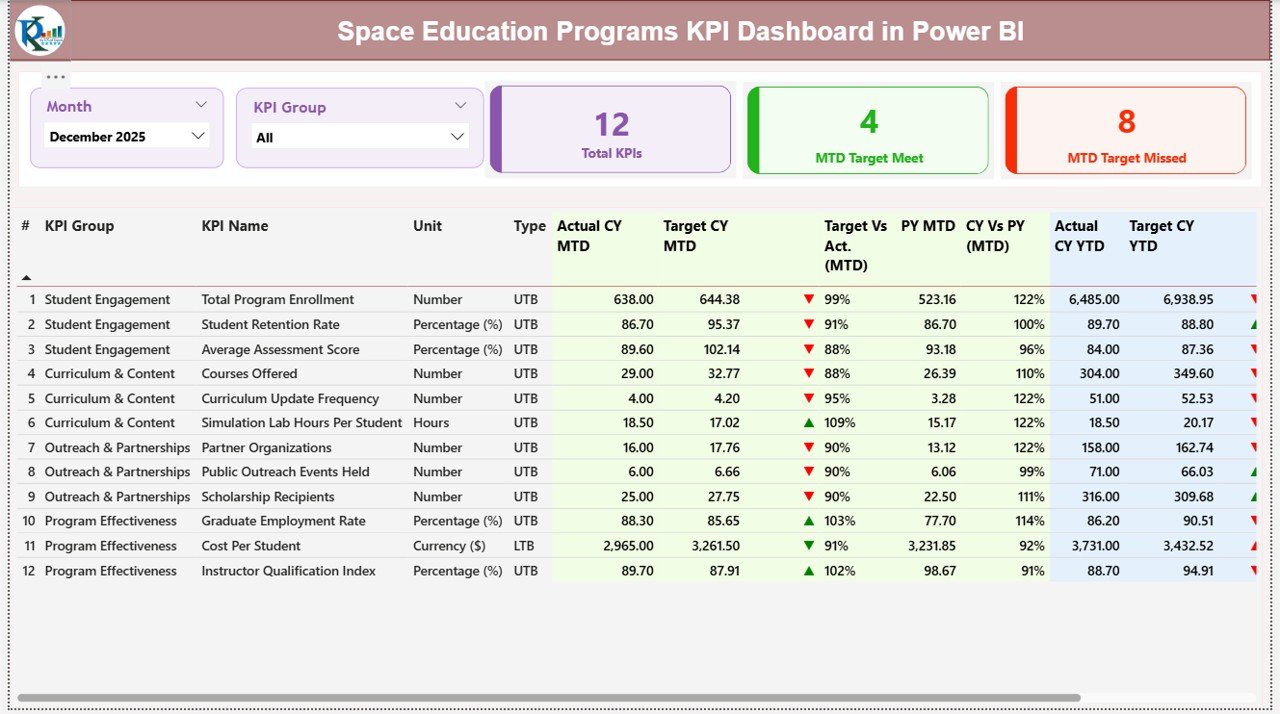
1. Summary Page
This is the main user interface and provides a bird’s-eye view of key metrics.
- Slicers: Located at the top, filter data by Month and KPI Group for customized views.
- Summary Cards: Showcase Total KPI count, number of KPIs meeting MTD targets, and those missing targets.
- Detailed KPI Table:
The detailed table displays:
- KPI Number – sequence identifier.
- KPI Group – category classification.
- KPI Name – descriptive title.
- Unit – measurement unit.
- Type – LTB (Lower The Better) or UTB (Upper The Better).
- Actual CY MTD and Target CY MTD values alongside an MTD status icon (green up arrow for good, red down arrow for poor performance).
- Target Vs Actual percentages for MTD – calculated as Actual MTD / Target MTD.
- Previous Year (PY) MTD data and comparative % (CY vs PY = Current Year MTD / Previous Year MTD).
- Year-To-Date (YTD) actual and target metrics with the YTD status icon.
- Target Vs Actual percentages for YTD and PY YTD comparative metrics.
This summary page offers an immediate snapshot of performance trends and target attainment, enabling quick insights.Space Education Programs KPI Dashboard in Power BI
Click to Buy Space Education Programs KPI Dashboard in Power BI
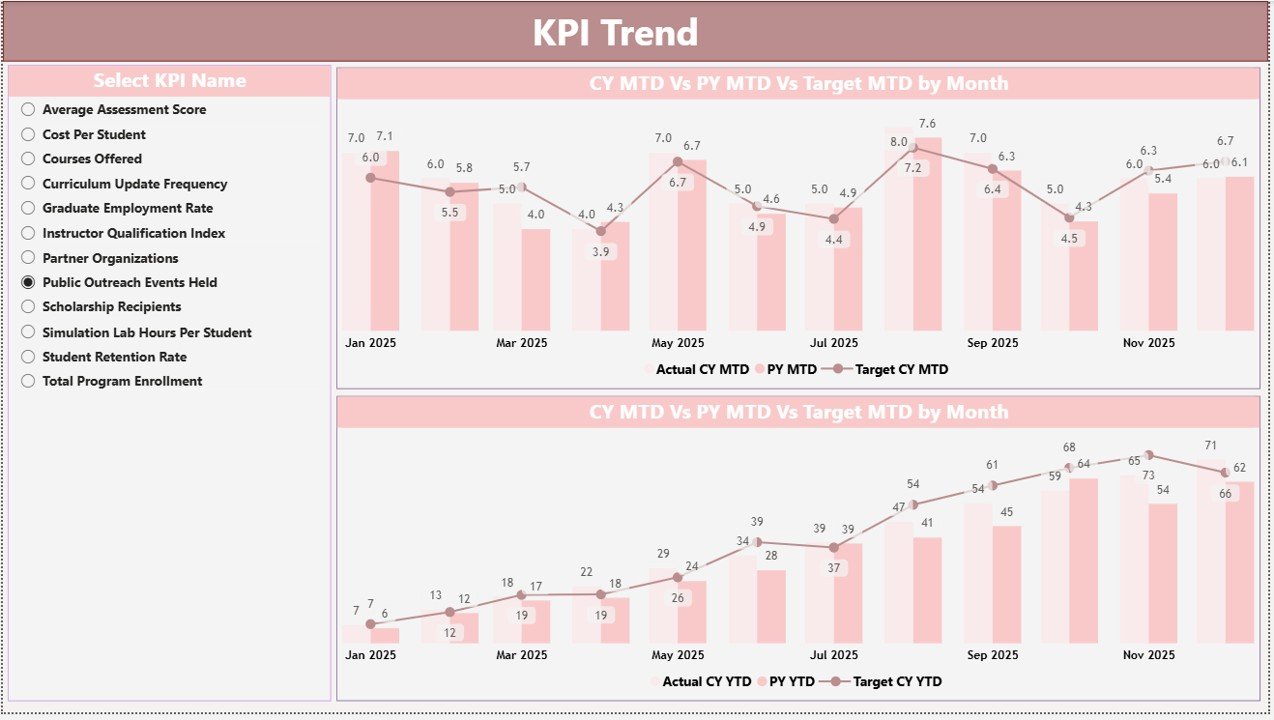
2. KPI Trend Page
This page focuses on performance trends over time with two combo charts displaying:
- Actual values for the Current Year and Previous Year.
- Target values for MTD and YTD periods.
- A KPI Name slicer on the left to select and drill into specific KPIs.
This trend analysis lets users visualize temporal progress and spot patterns or anomalies effectively.Space Education Programs KPI Dashboard in Power BI
Click to Buy Space Education Programs KPI Dashboard in Power BI
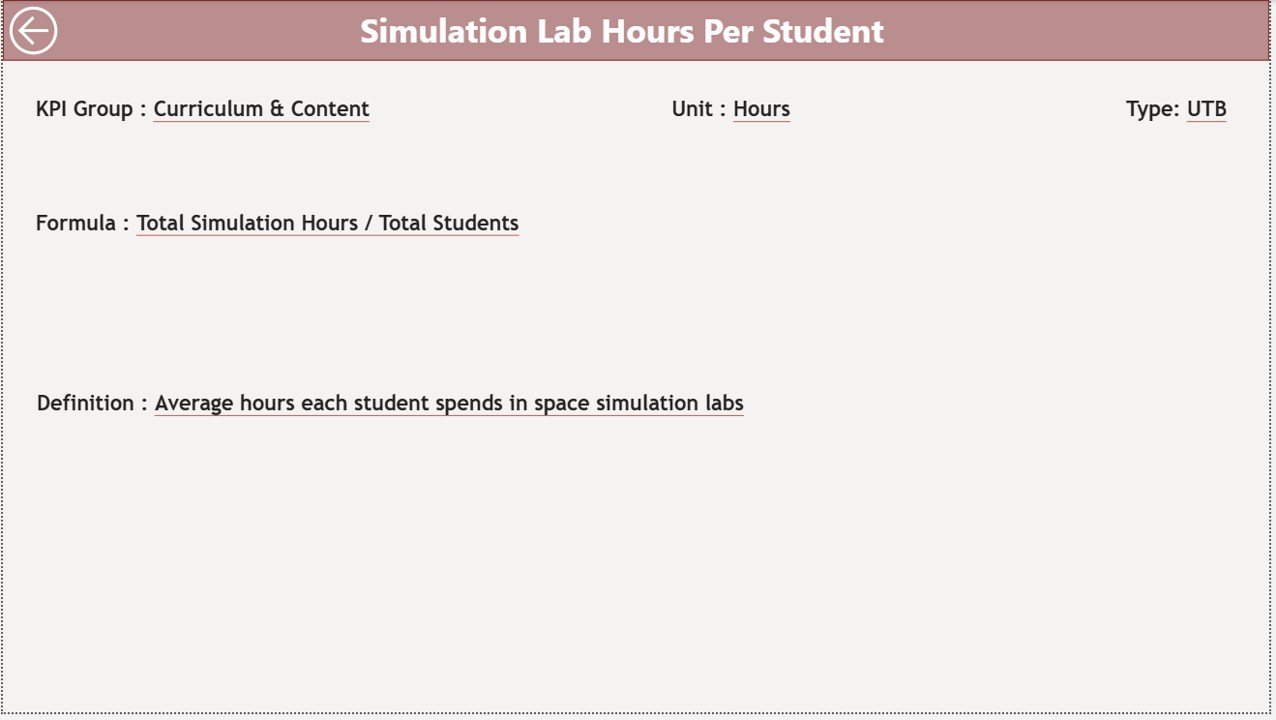
3. KPI Definition Page
Click to Buy Space Education Programs KPI Dashboard in Power BI
A hidden drill-through page accessible from the Summary Page, this provides detailed definitions and formulas for each KPI. Key features include:
- KPI Number, Group, Name, Unit, Formula, Definition, and Type displayed.
- A back button at the top-left corner to navigate easily back to the main summary page.
This page enriches dashboard users’ understanding of KPIs, promoting informed decision-making.
Excel Data Source Structure
The dashboard operates on a well-organized Excel file with three sheets:
- Input_Actual: Enter actual KPI values by Month (using first date of month), MTD and YTD.
- Input_Target: Input target KPI values similarly by Month, MTD, and YTD.
- KPI Definition: Fill in KPI metadata such as Number, Group, Name, Unit, Formula, Definition, and Type.
This structure ensures seamless data refreshes and accuracy within Power BI.
Advantages of Space Education Programs KPI Dashboard in Power BI
- Real-time Insights: Dynamic data filtering and interaction provide instant performance updates.
- Visual Clarity: Icons and percentages simplify KPI status interpretation.
- Data-Driven Decision Making: Detailed trend and comparison views aid strategy optimization.
- User-Friendly Interface: Structured multi-page layout with drill-through options enhance usability.
- Excel Compatibility: Leveraging Excel files as data sources supports easy data management without complex ETL.
Opportunities for Improvement
Click to Buy Space Education Programs KPI Dashboard in Power BI
- Automated Data Refresh: Connecting to live databases or APIs could eliminate manual Excel updates.
- Enhanced Visualizations: Adding dynamic KPIs alerts or trend forecasting charts could elevate analytic depth.
- Mobile Optimization: Designing mobile-responsive layouts for on-the-go users.
- User Access Controls: Implementing role-based security to protect sensitive KPI data.
Best Practices
- Maintain consistent date formatting in Excel inputs to ensure accurate Power BI time intelligence.
- Use clear and standardized KPI naming conventions in the KPI Definition sheet.
- Regularly update and validate data in Excel sheets to avoid reporting errors.
- Leverage slicers effectively to enable focused data analysis.
- Document KPI formulas and definitions clearly in the KPI Definition page for all users.Space Education Programs KPI Dashboard in Power BI
FAQs
Click to Buy Space Education Programs KPI Dashboard in Power BI
Can I customize the KPIs displayed in the dashboard?
Yes, using slicers on the Summary and KPI Trend pages, you can filter KPIs by group or name for customized views.
How often should the Excel data file be updated?
For up-to-date analysis, update your Excel data monthly or as often as new KPI results become available.
Is it possible to add more KPIs to the dashboard?
Absolutely-add new KPIs to the KPI Definition sheet and input their data in the Actual and Target sheets to incorporate them.
Can I share this Power BI dashboard with my team?
Yes, publish the Power BI report to the Power BI Service and share it with authorized users for collaborative insights.
Conclusion
Click to Buy Space Education Programs KPI Dashboard in Power BI
The Space Education Programs KPI Dashboard in Power BI is an essential tool for organizations involved in space education initiatives. By integrating Excel-based data with intuitive visuals, this dashboard empowers users to monitor, analyze, and act on key performance metrics effectively. Its multi-layered design combining summary views, trend analysis, and definitions offers both high-level and deep-dive insights, fostering a culture of data-driven decision-making.
To maximize value, follow best practices for data management and consider ongoing enhancements such as automation and enhanced visualizations.
Explore the power of this dashboard today to drive impactful outcomes in your space education programs.
For more comprehensive learning, visit the official Microsoft Power BI Documentation.
Visit our YouTube channel to watch the demo: Youtube.com/@NextGenTemplates
Click to Buy Space Education Programs KPI Dashboard in Power BI