In today’s fast-paced digital world, managing an e-commerce business effectively requires data-driven insights that can help optimize operations, boost sales, and improve customer satisfaction. The E-commerce Dashboard in Excel provides a comprehensive, easy-to-use tool for monitoring key metrics, tracking performance, and making informed decisions to grow your business. This ready-to-use dashboard template is designed to help e-commerce businesses visualize important data, track sales, manage inventory, and assess customer satisfaction all in one place.
In this article, we’ll explain how the E-commerce Dashboard in Excel works, its key features, and how you can make the most of this tool to improve your e-commerce business.
What is an E-commerce Dashboard in Excel?
An E-commerce Dashboard in Excel is a powerful business tool that consolidates important e-commerce metrics into one visual platform. This template helps e-commerce businesses track their operations, including order statistics, revenue, customer feedback, and profitability. By organizing data into multiple sheets, charts, and slicers, the dashboard allows you to track performance over time, spot trends, and identify areas for improvement.
Excel is a popular tool for creating customizable dashboards, as it provides flexibility in how data is displayed, manipulated, and analyzed. With built-in formulas and charts, this E-commerce Dashboard can be adapted to meet the unique needs of your business.
Key Features of the E-commerce Dashboard in Excel
Click to buy E-commerce Dashboard In Excel
The E-commerce Dashboard in Excel consists of several key sheets, each serving a specific purpose. Here’s an overview of what each sheet includes and how it can benefit your business:
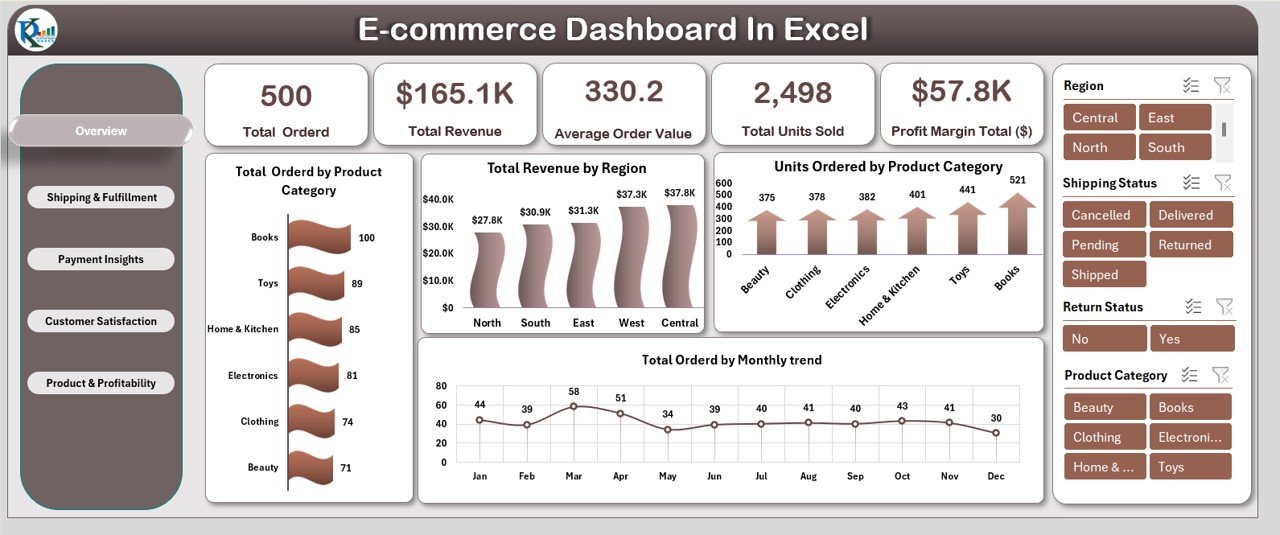
1. Overview Sheet Tab
The Overview Sheet is the first thing you’ll see when you open the dashboard. It provides a snapshot of your business’s performance and key metrics.
Cards:
- Total Ordered: Displays the total number of orders placed in a selected time period.
- Total Revenue: Tracks the total revenue generated by your business.
- Average Order Value: Shows the average value of each order.
- Total Units Sold: Tracks the total number of units sold during a given period.
- Profit Margin Total ($): Displays the total profit margin for your business, showing how much profit you’ve earned after expenses.
Charts:
- Total Ordered by Product Category: Visualizes the number of orders placed for each product category.
- Total Revenue by Region: Shows how much revenue is generated by different geographic regions.
- Units Ordered by Product Category: Tracks the number of units ordered by product category.
- Total Ordered by Monthly Trend: Displays a trend of the total orders placed each month.
Click to buy E-commerce Dashboard In Excel
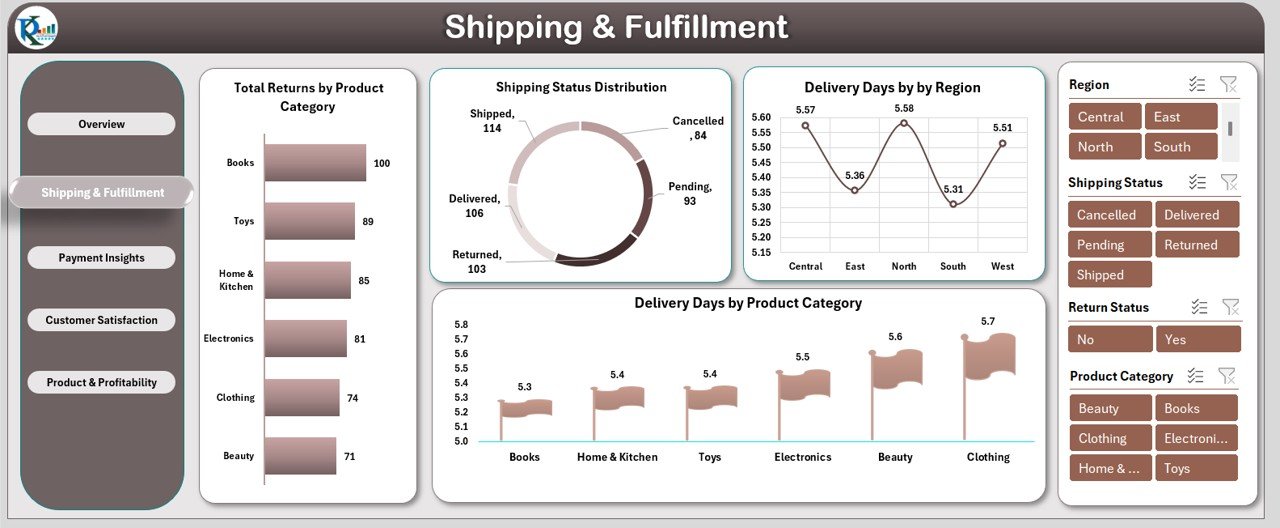
2. Shipping & Fulfillment Sheet Tab
This sheet focuses on the shipping and fulfillment process, helping you track shipping performance and returns.
Charts:
- Total Returns by Product Category: Shows the number of returns by product category.
- Shipping Status Distribution: Displays the distribution of orders based on their shipping status (e.g., shipped, pending, delivered).
- Delivery Days by Region: Tracks the average number of days taken for delivery in each region.
- Delivery Days by Product Category: Displays the average delivery days for each product category.
Click to buy E-commerce Dashboard In Excel
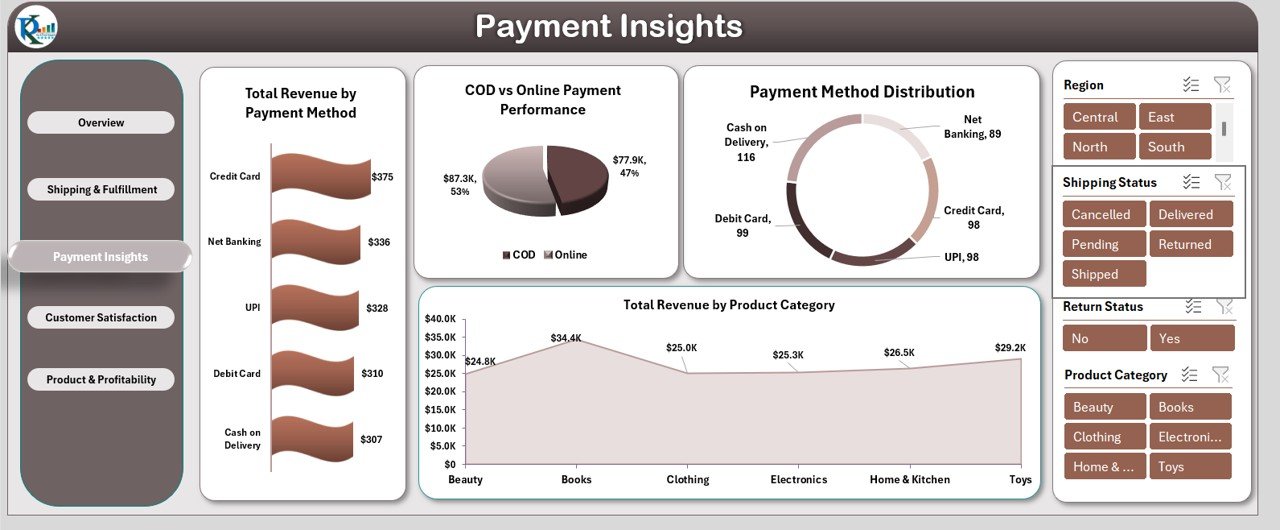
3. Payment Insights Sheet Tab
The Payment Insights Sheet gives you a detailed view of payment data, helping you analyze which payment methods are popular among customers.
Charts:
- Total Revenue by Payment Method: Tracks the revenue generated by different payment methods (e.g., credit card, PayPal, etc.).
- COD vs Online Payment Performance: Compares the performance of cash on delivery (COD) orders versus online payments.
- Payment Method Distribution: Displays the proportion of orders paid by different payment methods.
- Total Revenue by Product Category: Shows how much revenue is generated by each product category.
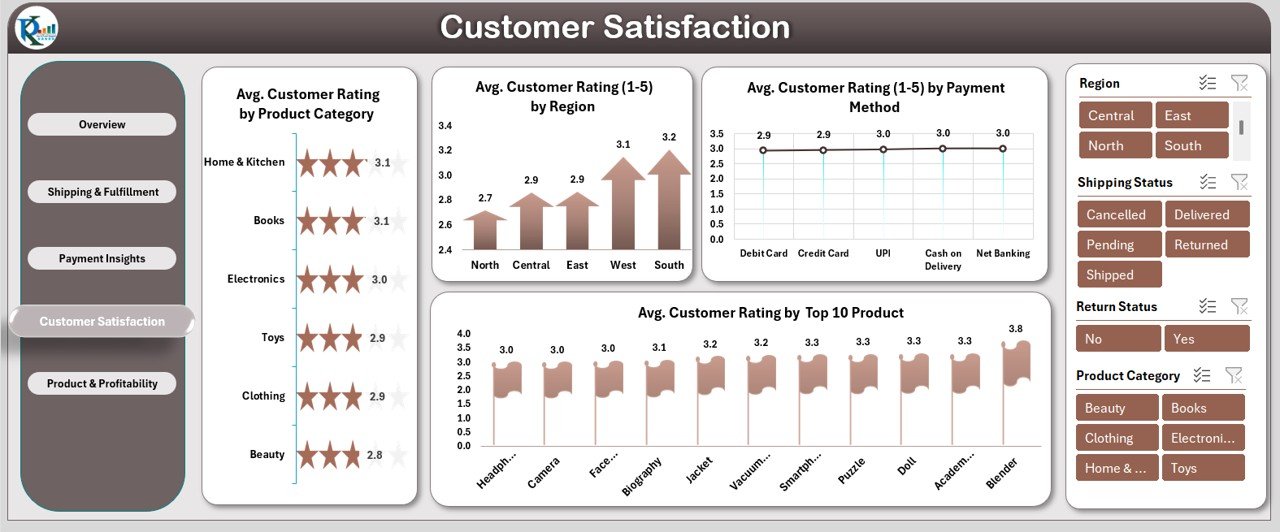
4. Customer Satisfaction Sheet Tab
This sheet focuses on customer feedback and satisfaction levels.
Charts:
- Avg. Customer Rating by Product Category: Displays the average customer rating for each product category (on a scale of 1-5).
- Avg. Customer Rating by Region: Tracks the average customer rating by region.
- Avg. Customer Rating by Payment Method: Analyzes customer ratings based on the payment method used.
- Avg. Customer Rating by Top 10 Products: Shows the average customer rating for the top 10 best-selling products.
Click to buy E-commerce Dashboard In Excel
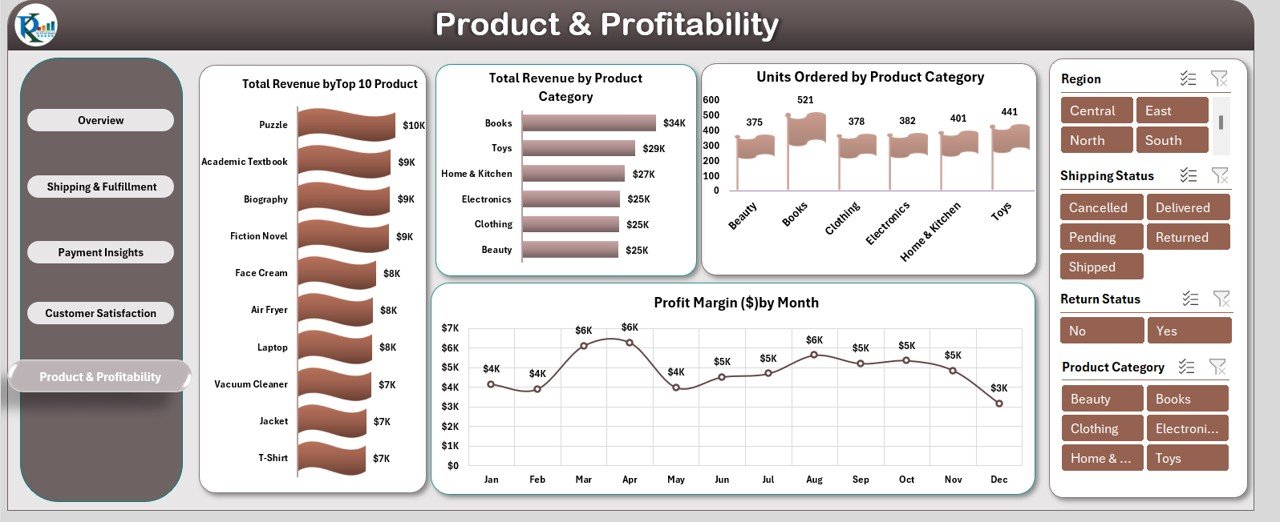
5. Product & Profitability Sheet Tab
This sheet helps you monitor the performance and profitability of your products.
Charts:
- Total Revenue by Top 10 Products: Displays the total revenue generated by your top 10 best-selling products.
- Total Revenue by Product Category: Tracks the total revenue for each product category.
- Units Ordered by Product Category: Shows how many units have been ordered for each product category.
- Profit Margin ($) by Month: Tracks the profit margin for each month, helping you monitor profitability over time.
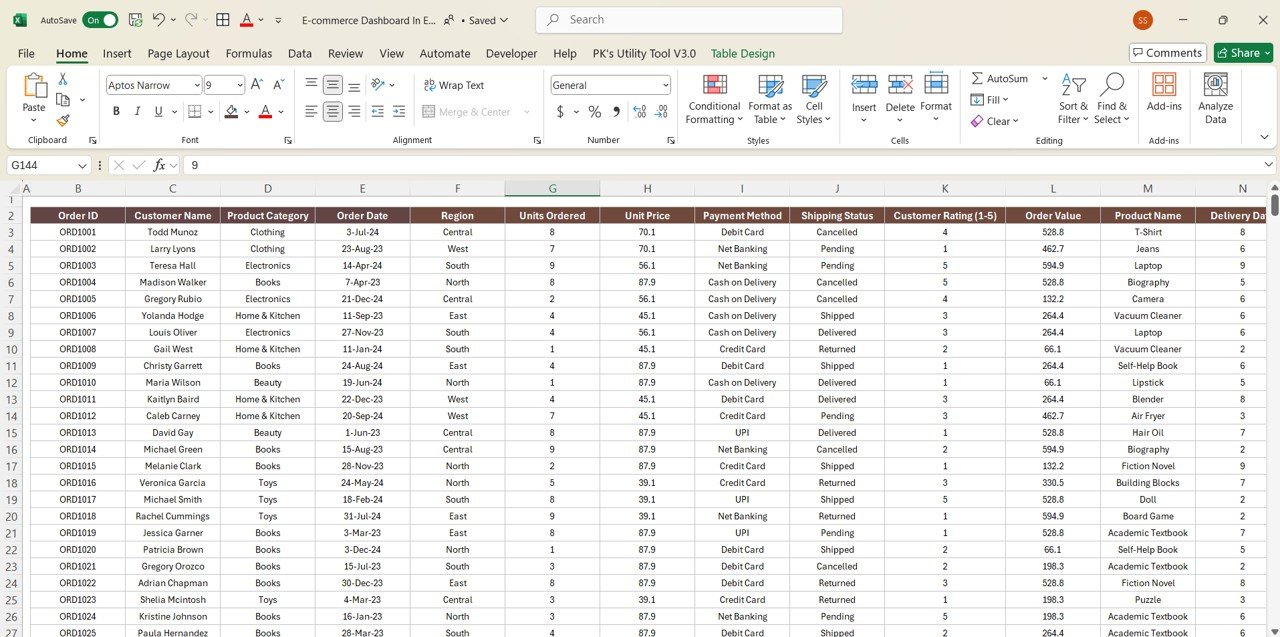
6. Data Sheet Tab
The Data Sheet is where all your raw data is entered. This sheet contains the following columns:
-
Order ID: A unique identifier for each order.
-
Customer Name: The name of the customer who placed the order.
-
Product Category: The category to which the purchased product belongs.
-
Order Date: The date the order was placed.
-
Region: The geographical region where the order was placed.
-
Units Ordered: The number of units ordered.
-
Unit Price: The price per unit of the product.
-
Payment Method: The method used to pay for the order (e.g., credit card, PayPal).
-
Shipping Status: The current status of the order’s shipping (e.g., pending, shipped, delivered).
-
Customer Rating (1-5): The rating provided by the customer, ranging from 1 to 5 stars.
-
Order Value: The total value of the order.
-
Product Name: The name of the product.
-
Delivery Days: The number of days it took to deliver the product.
-
Return Status: Whether the product was returned.
-
Payment Type: Whether the payment was made online or via cash on delivery.
-
Profit Margin ($): The profit margin earned on the order after expenses.
-
Month: The month in which the order was placed.
Click to buy E-commerce Dashboard In Excel
Advantages of Using the E-commerce Dashboard in Excel
The E-commerce Dashboard in Excel offers several key benefits:
-
Centralized Data: The dashboard consolidates all relevant business data in one place, making it easy to track KPIs, sales, customer satisfaction, and more.
-
Real-Time Insights: By updating the data regularly, you can track your e-commerce performance in real-time, giving you the ability to respond quickly to changes.
-
Visual Representation: The use of charts and slicers allows you to visualize key metrics, making it easier to understand trends and patterns.
-
Customizable: The dashboard is customizable, so you can modify the KPIs, charts, and layout to meet the specific needs of your e-commerce business.
-
User-Friendly: The Google Sheets platform makes the dashboard easy to access and use, even for people with limited technical skills.
Opportunity for Improvement in the E-commerce Dashboard
While the E-commerce Dashboard is a powerful tool, there are opportunities to further enhance its effectiveness:
-
Automated Data Integration: Integrating the dashboard with e-commerce platforms (like Shopify or WooCommerce) can automate the data input process, reducing manual entry and ensuring accuracy.
-
Advanced Analytics: Adding machine learning or predictive analytics can help forecast sales trends, customer behavior, and inventory requirements, improving decision-making.
-
Mobile Accessibility: Developing a mobile version of the dashboard would allow business owners to monitor KPIs and make decisions on the go.
-
Inventory Management Integration: Including inventory tracking features would make the dashboard even more comprehensive, enabling you to monitor stock levels in real-time.
Best Practices for Using the E-commerce Dashboard in Excel
To get the most out of the E-commerce Dashboard, follow these best practices:
-
Regular Data Updates: Keep the data sheet updated regularly to ensure that the dashboard reflects current performance.
-
Track Key KPIs: Focus on the most impactful KPIs such as revenue, profit margin, and customer satisfaction to improve overall business performance.
-
Use Trend Analysis: Utilize the KPI Trend Sheet to identify long-term performance trends, which can guide future strategies.
-
Set Realistic Targets: Ensure that your performance targets are aligned with your business goals and past performance.
-
Collaborate with Your Team: Share the dashboard with your team to ensure everyone is on the same page and working towards common goals.
Conclusion
The E-commerce Dashboard in Excel is a vital tool for any online retailer looking to optimize their business. By consolidating important KPIs and tracking metrics like sales, customer satisfaction, and inventory, this dashboard helps you monitor and improve your business’s performance. With its customizable features, real-time insights, and easy-to-use interface, the E-commerce Dashboard is an invaluable asset to help you grow and scale your e-commerce operations.
Frequently Asked Questions (FAQs)
Click to buy E-commerce Dashboard In Excel
1. What KPIs are tracked in the E-commerce Dashboard?
The dashboard tracks KPIs such as total orders, total revenue, average order value, profit margin, customer ratings, and shipping status.
2. Can I customize the E-commerce Dashboard?
Yes, the dashboard is fully customizable. You can add new KPIs, change the layout, and adjust charts to suit your business needs.
3. How do I update the E-commerce Dashboard?
You can update the dashboard by inputting the latest data into the Data Sheet, which automatically updates the charts and KPIs.
4. Can I use the dashboard for multiple e-commerce platforms?
Yes, the dashboard can be adapted to track data from multiple e-commerce platforms by updating the data input fields and adjusting KPIs accordingly.
5. Is the dashboard suitable for beginners?
Yes, the E-commerce Dashboard in Excel is user-friendly and can be used by beginners. The visual layout and clear instructions make it easy to understand and implement.
Visit our YouTube channel to learn step-by-step video tutorials
Watch the step-by-step video Demo:
Click to buy E-commerce Dashboard In Excel