Ensuring the health and safety of employees is a top priority for any organization. The Employee Health and Safety Dashboard in Excel is a ready-to-use tool designed to help you monitor and analyze key safety metrics. This dashboard provides a comprehensive view of incidents, resolution progress, medical attention requirements, and trends related to employee health and safety.
In this article, we will explore the features of the Employee Health and Safety Dashboard in Excel, explaining how it can assist organizations in tracking and improving their safety performance.
What is the Employee Health and Safety Dashboard in Excel?
The Employee Health and Safety Dashboard in Excel is a tool designed to track and analyze workplace health and safety data. It helps organizations monitor incidents, identify trends, and assess the effectiveness of preventive actions. The dashboard provides detailed visualizations of key metrics such as total incidents, incident severity, resolution progress, medical attention required, and more.
Key Features of the Employee Health and Safety Dashboard
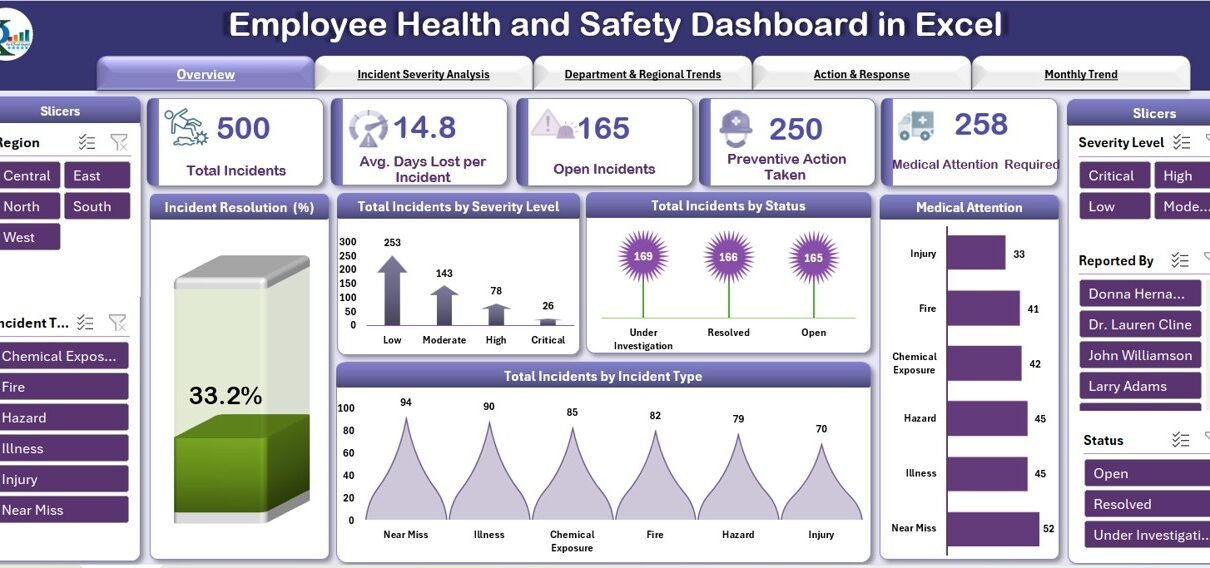
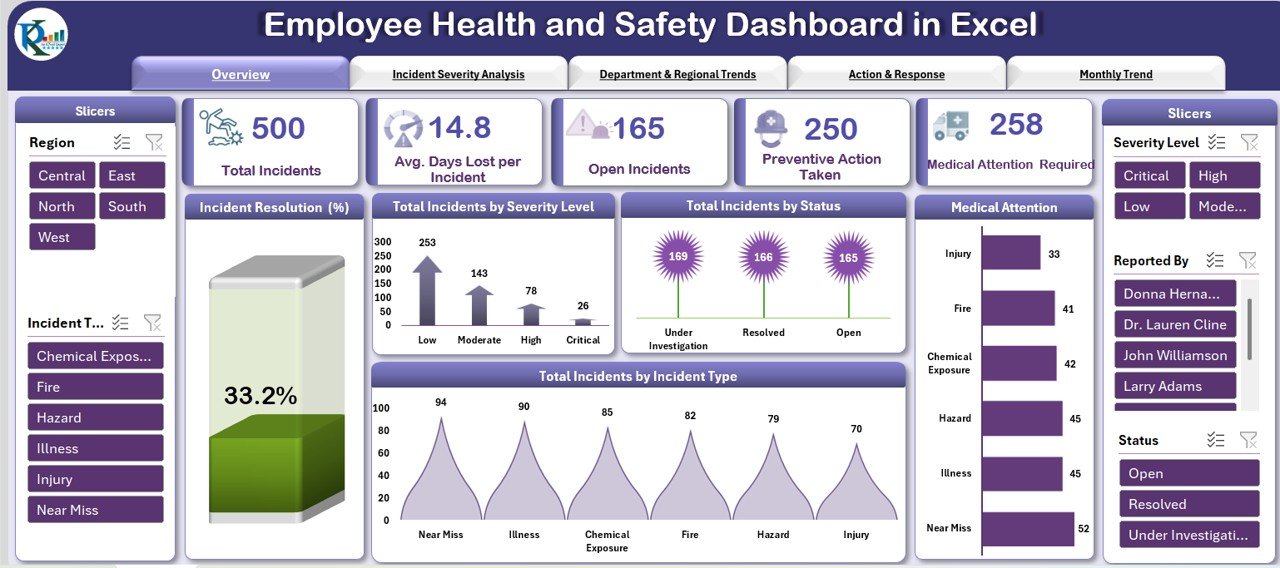
1) Overview Sheet: High-Level Safety Metrics
The Overview Sheet gives a high-level view of key health and safety metrics across the organization. It includes:
Cards:
- Total Incidents: Displays the total number of incidents reported.
- Avg. Days Lost per Incident: Shows the average number of days employees lost due to incidents.
- Open Incidents: Tracks the number of unresolved incidents.
- Preventive Actions Taken: Displays the number of incidents where preventive actions were taken.
- Medical Attention Required: Shows the number of incidents that required medical attention.
Charts:
- Incident Resolution Progress (%): Tracks the percentage of incidents that have been resolved.
- Total Incidents by Severity Level: Breaks down incidents by their severity (e.g., low, medium, high).
- Total Incidents by Status: Categorizes incidents by status (e.g., open, resolved, pending).
- Medical Attention Required: Shows the number of incidents that required medical attention.
- Total Incidents by Incident Type: Categorizes incidents by their type (e.g., slip and fall, equipment-related).
This sheet offers a quick overview of the health and safety situation within the organization, allowing you to spot any issues that need attention.
Click to buy Employee Health and Safety Dashboard in Excel
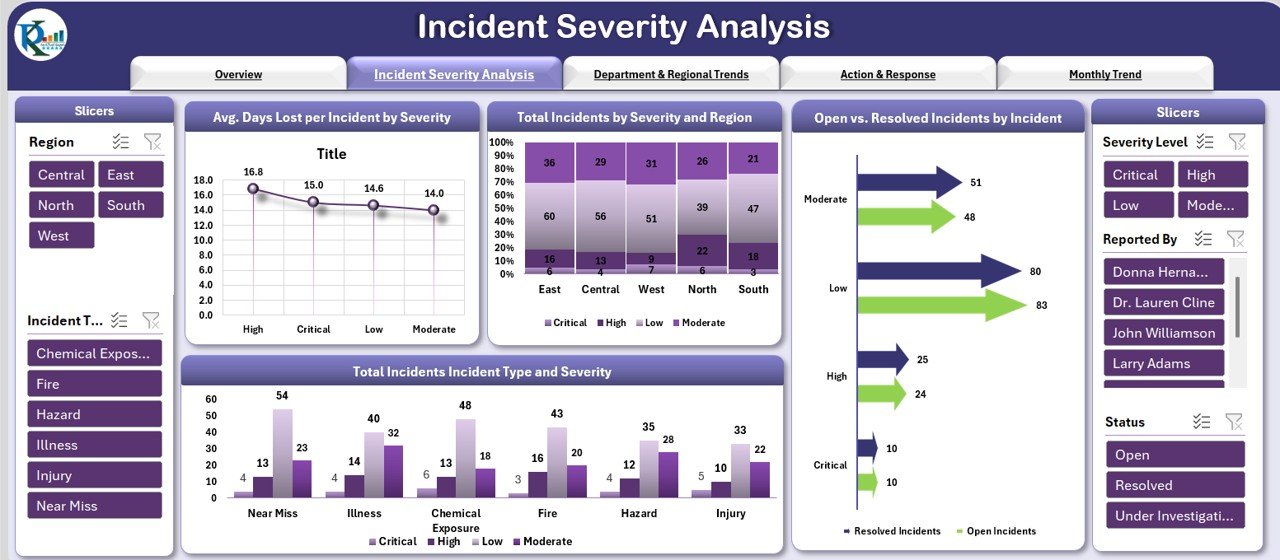
2) Incident Severity Analysis Sheet: Assessing Severity and Impact
The Incident Severity Analysis Sheet focuses on incident severity, helping you track the impact of incidents. It includes:
Charts:
- Avg. Days Lost per Incident by Severity Level: Displays the average number of days lost per incident, categorized by severity level.
- Total Incidents by Severity and Region: Tracks incidents by their severity level and region.
- Open vs. Resolved Incidents by Incident Types: Compares open and resolved incidents across different incident types.
- Total Incidents by Incident Type and Severity: Breaks down incidents by both type and severity to assess risk levels.
This sheet allows you to focus on the most critical incidents and understand their impact on the organization.
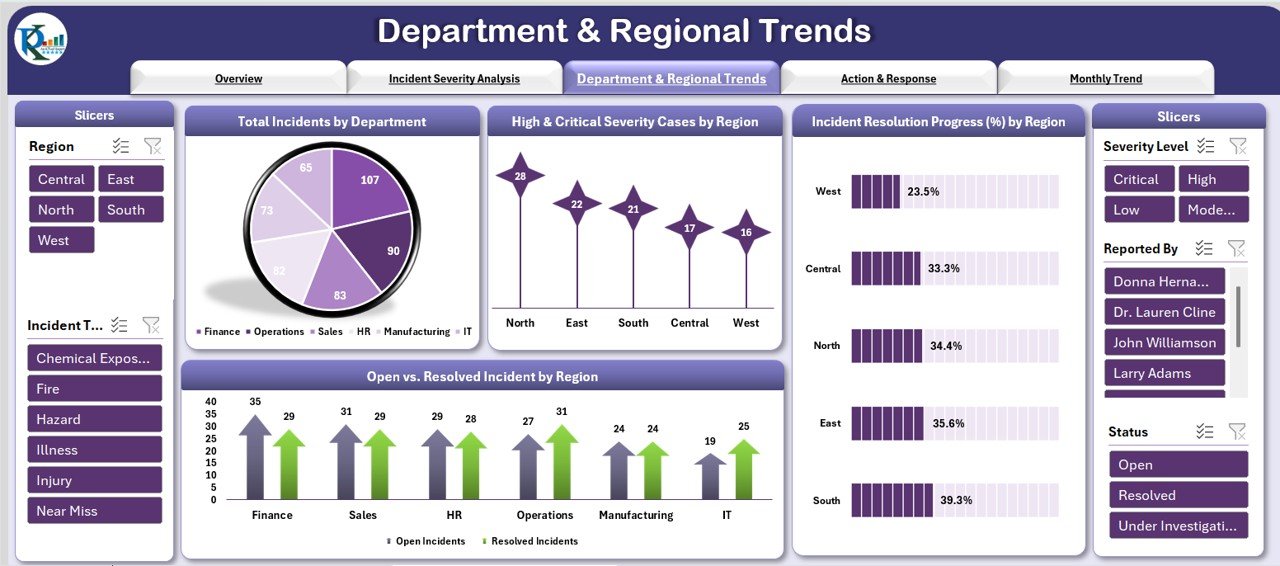
3) Department & Regional Trends Sheet: Tracking Trends by Department and Region
The Department & Regional Trends Sheet provides insights into how incidents are distributed across departments and regions. It includes:
Charts:
- Total Incidents by Department: Displays the number of incidents by department.
- High & Critical Severity Cases by Region: Tracks high and critical severity cases by region, helping identify areas of concern.
- Incident Resolution Progress (%) by Region: Displays the resolution progress for incidents in different regions.
- Open vs. Resolved Incidents by Region: Compares the number of open versus resolved incidents by region.
This page helps identify departments or regions with higher risks and track the effectiveness of safety measures in each area.
Click to buy Employee Health and Safety Dashboard in Excel
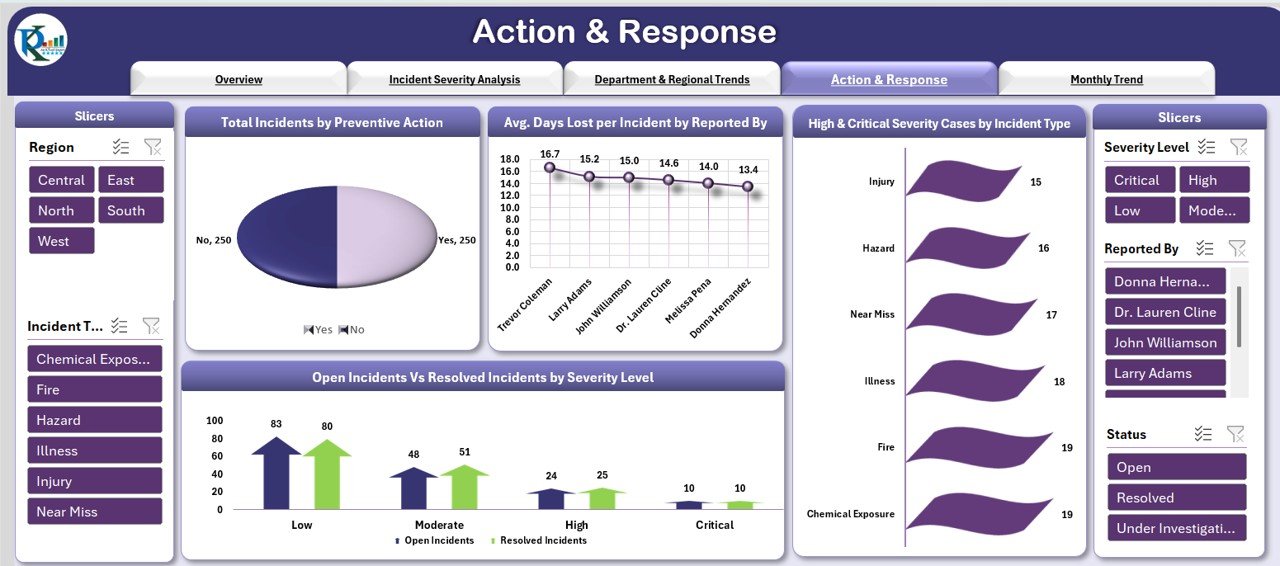
4) Action & Response Sheet: Monitoring Preventive Actions and Responses
The Action & Response Sheet tracks the response to incidents and preventive actions taken. It includes:
Charts:
- Total Incidents by Preventive Action: Tracks incidents that had preventive actions implemented.
- Avg. Days Lost per Incident by Reported By: Displays the average days lost per incident, broken down by the person who reported it.
- High & Critical Severity Cases by Incident Type: Tracks high and critical severity incidents by their type.
- Open Incidents Vs. Resolved Incidents by Severity Level: Compares open and resolved incidents by severity level.
This page is useful for tracking the effectiveness of preventive measures and ensuring that safety procedures are being followed.
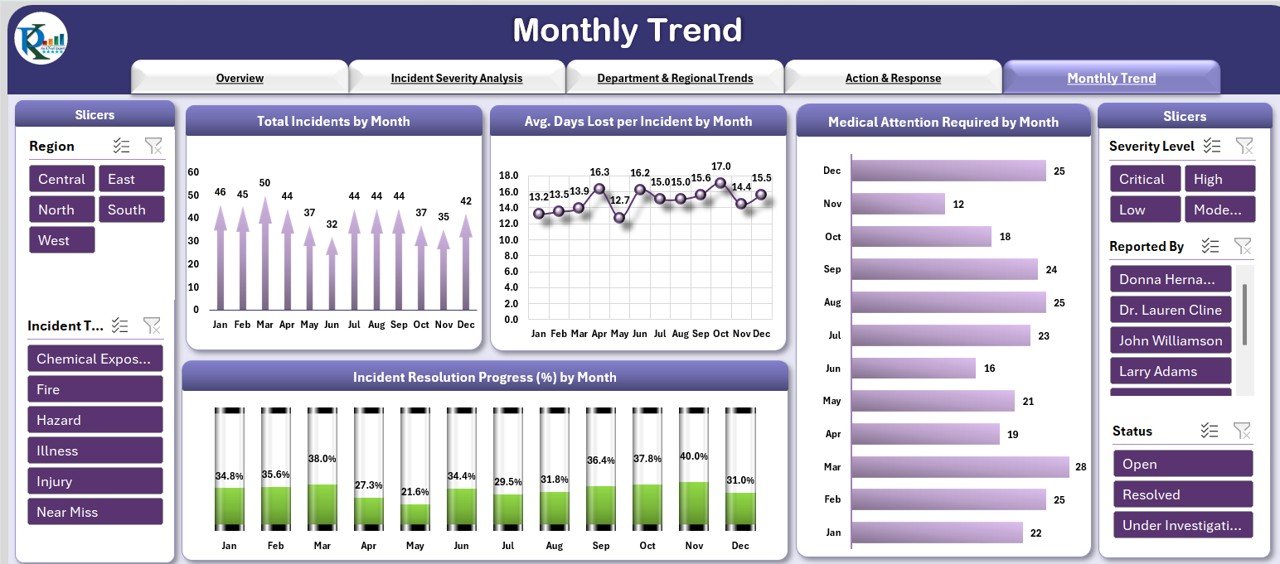
5) Monthly Trend Sheet: Tracking Safety Metrics Over Time
The Monthly Trend Sheet offers a time-based view of safety data, helping you monitor how safety metrics evolve over time. It includes:
Charts:
- Total Incidents by Month: Displays the total number of incidents reported each month.
- Avg. Days Lost per Incident by Month: Tracks the average number of days lost per incident on a monthly basis.
- Medical Attention Required by Month: Displays the number of incidents that required medical attention each month.
- Incident Resolution Progress (%) by Month: Tracks the progress of incident resolutions over time.
This sheet helps you identify trends and patterns in safety performance, allowing for proactive adjustments.
Click to buy Employee Health and Safety Dashboard in Excel
6) Data Sheet Tab: Centralized Data Entry
The Data Sheet Tab is where you enter all incident-related data. Key columns include:
Benefits of Using the Employee Health and Safety Dashboard
The Employee Health and Safety Dashboard in Excel offers several advantages:
-
Centralized Incident Tracking: All incident data is organized in one place, making it easy to track and analyze.
-
Real-Time Insights: The dashboard provides real-time data on incident status, resolution progress, and safety performance.
-
Improved Safety Awareness: By tracking safety incidents and their resolution, the dashboard helps identify potential risks and improve overall workplace safety.
-
Data-Driven Decision Making: The dashboard’s charts and data visualizations help you make informed decisions regarding preventive actions and safety measures.
-
Time-Saving: The ready-to-use template saves time by providing a structured and easy-to-implement system for tracking incidents and safety metrics.
Best Practices for Using the Employee Health and Safety Dashboard
Click to buy Employee Health and Safety Dashboard in Excel
To make the most of the Employee Health and Safety Dashboard, follow these best practices:
-
Update Data Regularly: Ensure that all incident-related data is updated regularly to keep the dashboard accurate and relevant.
-
Monitor Safety Metrics: Keep an eye on key metrics such as Safety Incidents, Avg. Days Lost per Incident, and Incident Resolution Progress to track performance.
-
Analyze Trends Over Time: Use the Monthly Trend Sheet to monitor safety trends and identify any patterns or potential areas of concern.
-
Implement Preventive Actions: Use the Action & Response Sheet to track the implementation of preventive measures and evaluate their effectiveness.
-
Share the Dashboard: Share the dashboard with relevant stakeholders to keep everyone informed and aligned on safety goals.
Conclusion
The Employee Health and Safety Dashboard in Excel is an essential tool for managing and analyzing workplace safety data. With its powerful data visualization capabilities, real-time insights, and customizable features, this dashboard helps organizations track safety incidents, monitor progress, and ensure a safer work environment. By using this tool, you can enhance employee health and safety, reduce incidents, and maintain compliance with workplace safety standards.
Frequently Asked Questions (FAQs)
Click to buy Employee Health and Safety Dashboard in Excel
1. How do I update the Employee Health and Safety Dashboard?
You can update the dashboard by adding new incident data into the Data Sheet Tab. The charts and metrics will automatically update based on the new data.
2. Can I track multiple types of incidents with this dashboard?
Yes, the dashboard allows you to track various incident types (e.g., slip, fall, equipment-related) and monitor their severity, resolution progress, and safety actions.
3. How do I monitor safety trends over time?
Use the Monthly Trend Sheet to track safety metrics such as Total Incidents, Avg. Days Lost per Incident, and Incident Resolution Progress over time.
4. Can I customize the dashboard for my organization’s specific needs?
Yes, the dashboard is fully customizable. You can modify the layout, add new metrics, or adjust the charts to better suit your organization’s safety goals.
5. Can I share the dashboard with my team?
Yes, since the dashboard is built in Excel, you can easily share it with your team for collaboration and real-time updates.
Visit our YouTube channel to learn step-by-step video tutorials
Watch the step-by-step video Demo:
Click to buy Employee Health and Safety Dashboard in Excel