Managing hospitality operations requires keeping track of bookings, guest ratings, revenue, and various services used by guests. The Hospitality Dashboard in Power BI provides an interactive and detailed view of all these key performance indicators (KPIs). This ready-to-use dashboard allows hospitality managers to monitor and analyze essential metrics to enhance operational decision-making, optimize pricing strategies, and improve guest experiences.
In this article, we will dive into the features of the Hospitality Dashboard in Power BI and explain how it can help businesses in the hospitality industry manage bookings, track revenue, and measure guest satisfaction effectively.
What is the Hospitality Dashboard in Power BI?
The Hospitality Dashboard in Power BI is a powerful tool designed to help hospitality businesses track and analyze important data points like bookings, revenue, guest ratings, and service usage. By providing in-depth insights into these areas, the dashboard enables business owners and managers to make informed decisions that improve profitability and enhance customer satisfaction.
The dashboard consists of multiple pages that offer different insights into the hospitality business’s performan
Key Features of the Hospitality Dashboard in Power BI
1) Overview Page: A Snapshot of Key Metrics
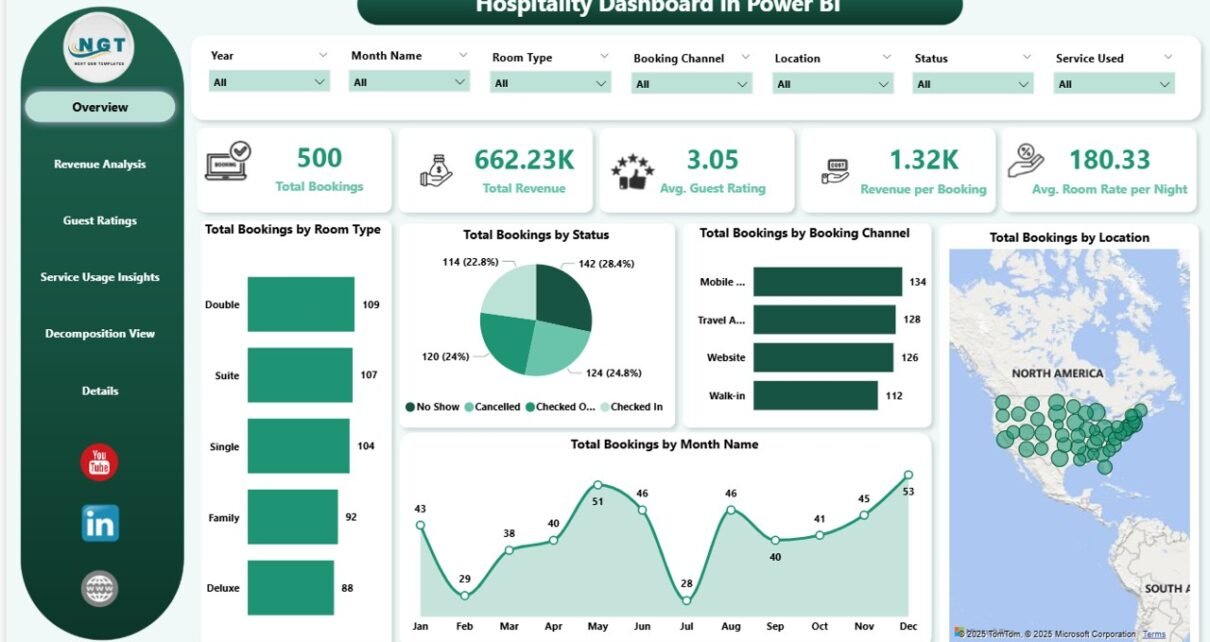
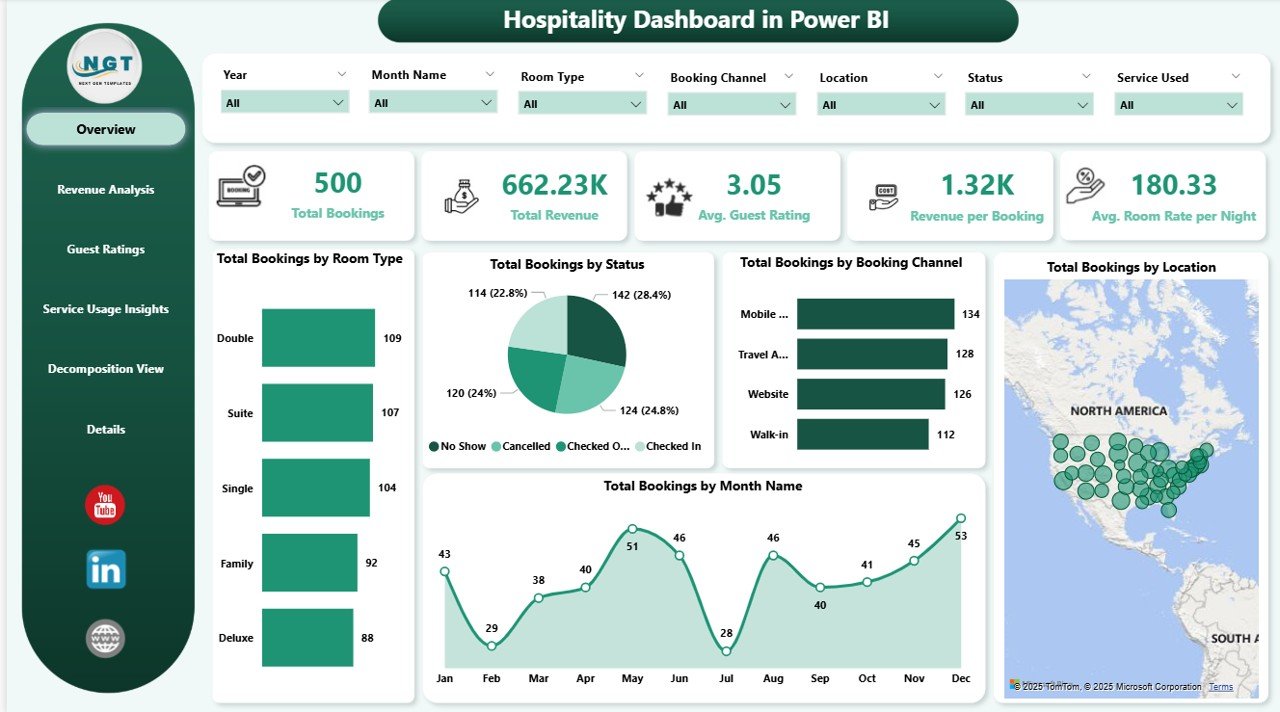
The Overview Page provides a high-level view of your hospitality business’s performance with key metrics displayed on cards and charts. Key features include:
Cards:
- Total Booking: Displays the total number of bookings made.
- Total Revenue: Shows the total revenue generated from bookings.
- Avg. Guest Rating: Displays the average rating provided by guests (on a scale of 1 to 5).
- Revenue per Booking: Shows the average revenue generated per booking.
- Avg. Room Rate per Night: The average room rate charged per night.
Charts:
- Total Bookings by Room Type: Breaks down bookings by room type (e.g., suite, standard).
- Total Bookings by Status: Categorizes bookings by status (e.g., confirmed, canceled, checked-in).
- Total Bookings by Booking Channel: Tracks bookings by different channels (e.g., website, travel agency, phone).
- Total Bookings by Location: Displays bookings by location (e.g., North, South).
- Total Bookings by Month Name: Tracks the number of bookings made each month.
This page provides an at-a-glance view of your hospitality business’s performance, allowing you to monitor booking trends and revenue generation.
Click to buy Hospitality Dashboard in Power BI
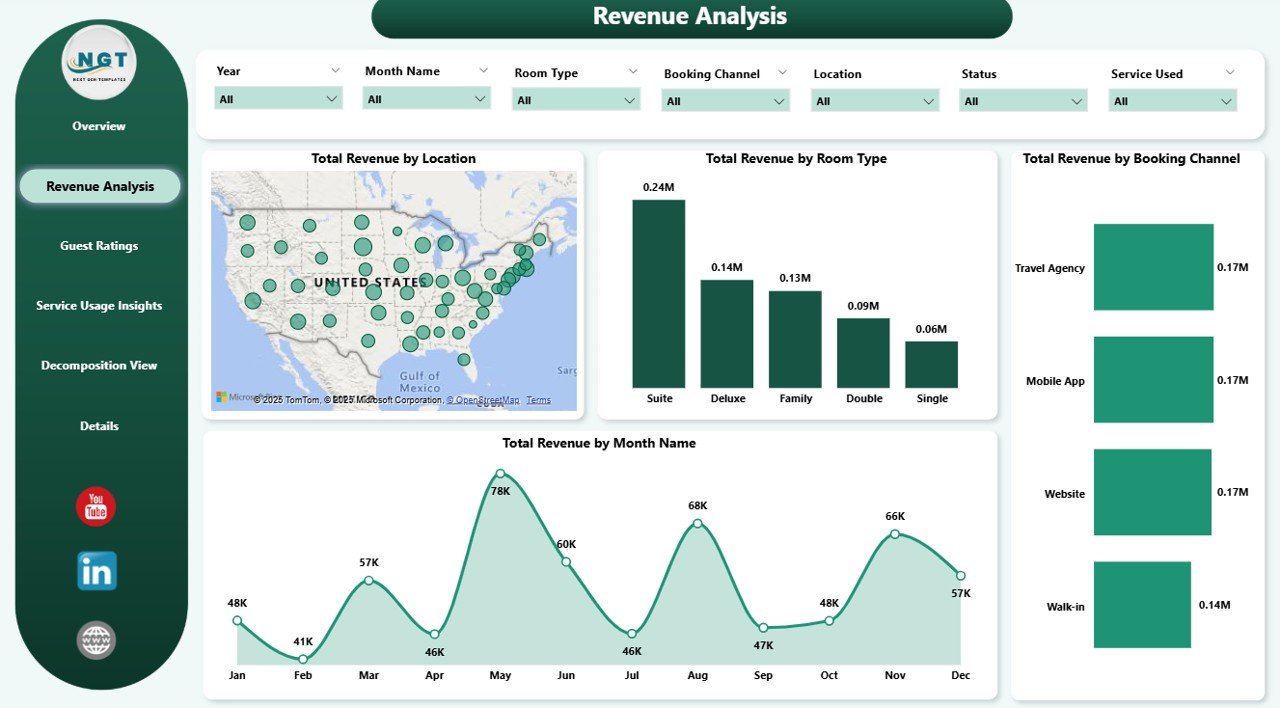
2) Revenue Analysis Page: Tracking Revenue Across Different Metrics
The Revenue Analysis Page is designed to help you monitor revenue generation from various sources. It includes the following charts:
Charts:
- Total Revenue by Location: Breaks down total revenue by location (e.g., North, South).
- Total Revenue by Room Type: Displays revenue based on room type.
- Total Revenue by Booking Channel: Tracks revenue by booking channels.
- Total Revenue by Month Name: Displays the total revenue generated each month.
This page provides insights into the sources of your revenue, allowing you to make informed decisions about pricing, marketing strategies, and service offerings.
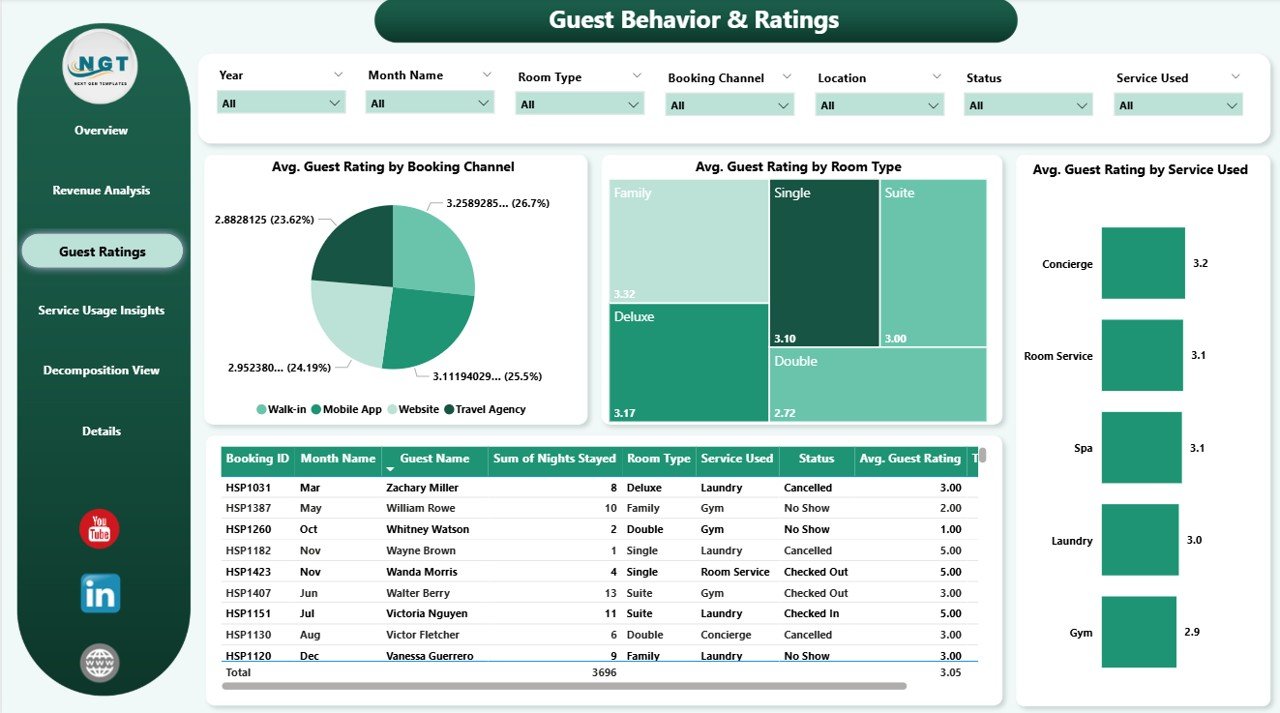
3) Guest Behavior & Ratings Page: Understanding Customer Satisfaction
The Guest Behavior & Ratings Page provides insights into guest feedback and satisfaction across various parameters. It includes:
Charts:
- Avg. Guest Rating by Booking Channel: Displays guest ratings based on the booking channel used (e.g., website, travel agency).
- Avg. Guest Rating by Room Type: Shows guest ratings by room type.
- Avg. Guest Rating by Service Used: Tracks guest ratings based on services used (e.g., gym, concierge).
This page allows you to monitor guest satisfaction and determine which areas of your business are performing well or need improvement.
Click to buy Hospitality Dashboard in Power BI
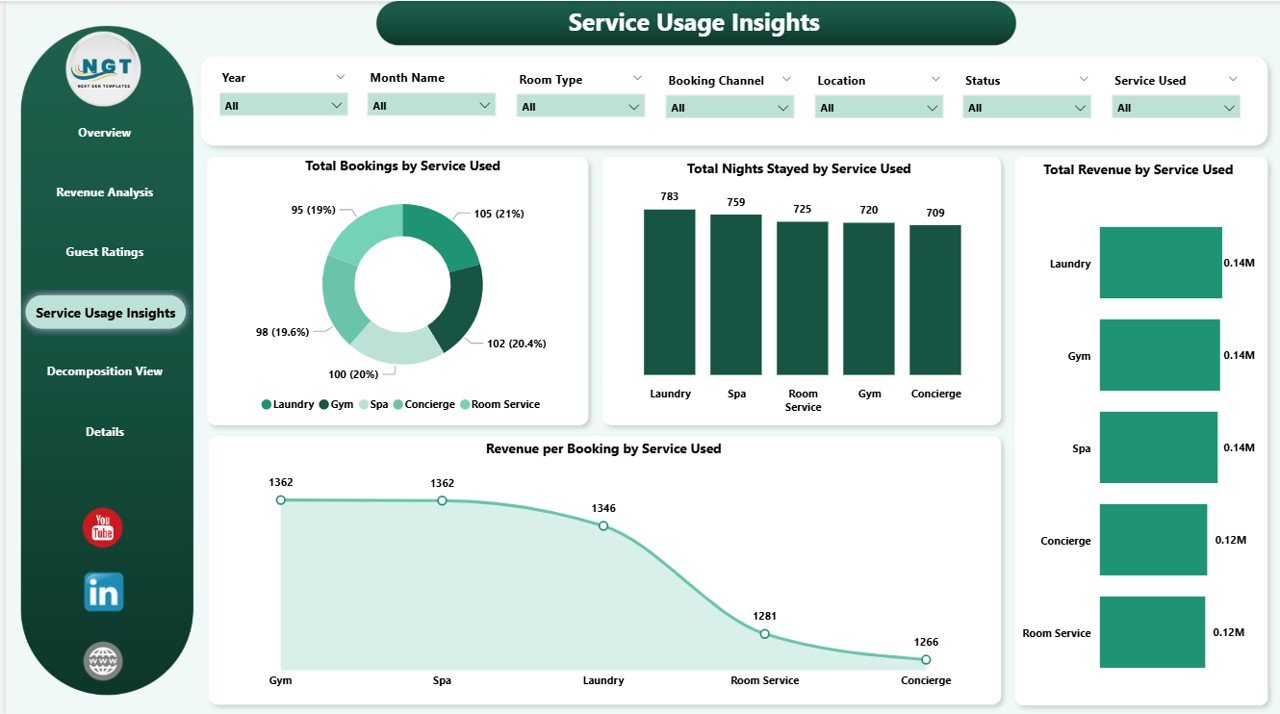
4) Service Usage Insights Page: Analyzing Service Usage
The Service Usage Insights Page provides data on how guests are utilizing services at your property. Key charts include:
Charts:
- Total Bookings by Service Used: Displays the total number of bookings based on services used (e.g., gym, spa).
- Total Nights Stayed by Service Used: Tracks the total number of nights stayed by guests using specific services.
- Total Revenue by Service Used: Shows the total revenue generated from each service.
- Revenue per Booking by Service Used: Tracks the revenue generated per booking for each service.
This page helps you analyze how services impact guest behavior and revenue generation, allowing for better resource allocation and pricing strategies.
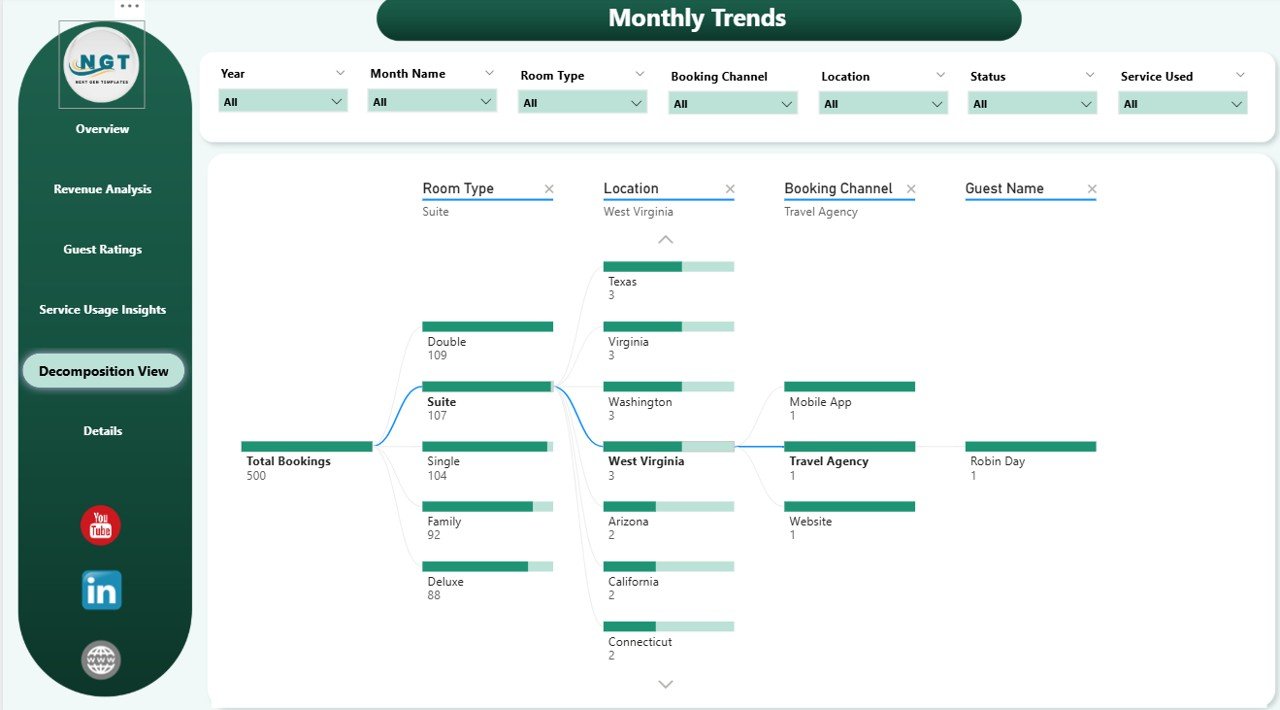
5) Decomposition View Page: Breaking Down Data by Factors
The Decomposition View Page allows for a detailed breakdown of data based on various factors such as room type, location, and booking channel. This page provides a drill-down analysis of your data, helping you explore the relationships between different variables and gain deeper insights into business performance.
Click to buy Hospitality Dashboard in Power BI
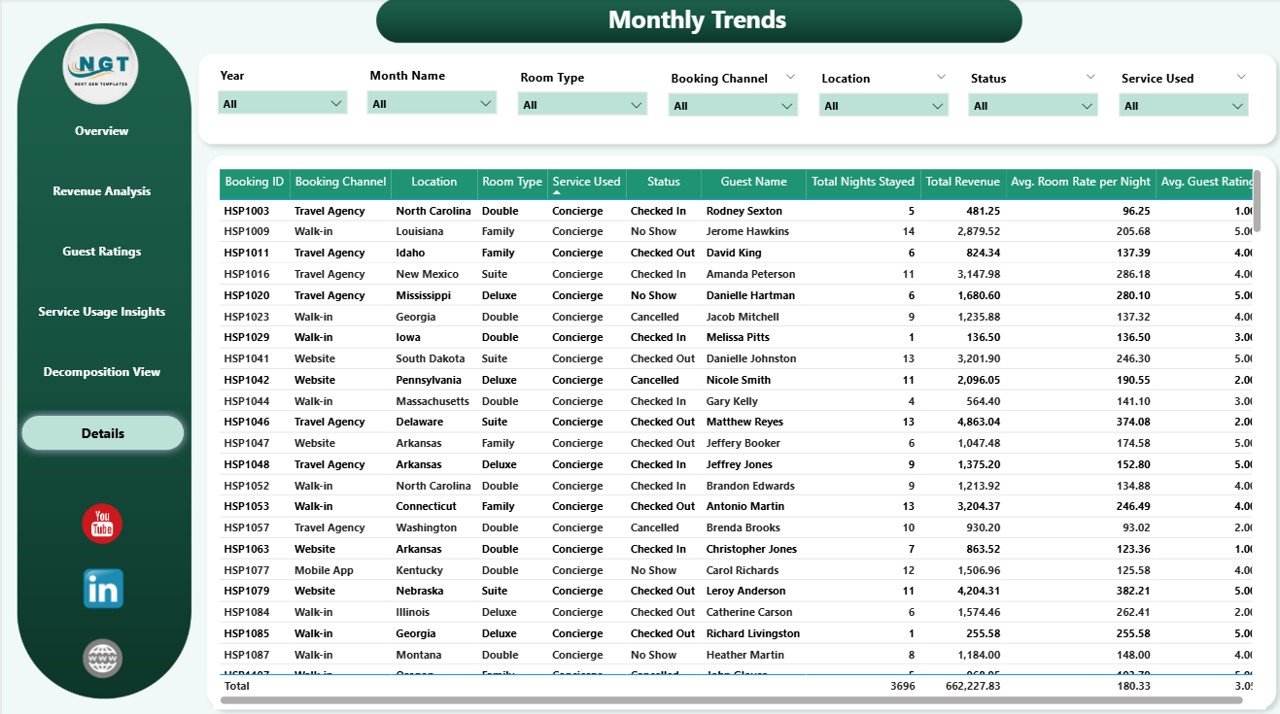
6) Details Page: In-Depth Data Analysis
This page acts as the central data repository for the entire dashboard, allowing you to analyze detailed information and perform custom queries.
Benefits of Using the Hospitality Dashboard in Power BI
Click to buy Hospitality Dashboard in Power BI
The Hospitality Dashboard in Power BI provides several key benefits for hotel managers and business owners:
-
Centralized Data Management: All booking, revenue, and guest rating data is organized in one place, making it easy to track and analyze.
-
Real-Time Insights: The dashboard is updated in real time, providing you with the latest data to make informed decisions.
-
Comprehensive View: With multiple pages offering different perspectives on performance, the dashboard gives you a 360-degree view of your hospitality business.
-
Data-Driven Decision Making: The dashboard’s interactive charts and metrics enable you to make data-driven decisions related to pricing, marketing, and resource allocation.
-
Enhanced Guest Satisfaction: By tracking guest ratings and service usage, the dashboard helps identify areas for improvement in customer service.
Best Practices for Using the Hospitality Dashboard
To maximize the effectiveness of the Hospitality Dashboard in Power BI, consider these best practices:
- Regularly Update Data: Ensure that all data is updated frequently to keep the dashboard current and reflective of your business’s performance.
- Monitor Key Metrics: Focus on key performance indicators like Avg. Guest Rating, Revenue per Booking, and Booking Status to understand how your business is performing.
- Analyze Trends Over Time: Use the Monthly Trend Page to track how bookings, revenue, and guest satisfaction evolve throughout the year.
- Focus on Guest Satisfaction: Track Guest Ratings across different booking channels and services to identify areas for improvement in guest services.
- Use the Decomposition View for Deep Insights: Leverage the Decomposition View to drill down into specific variables and identify key drivers of business performance.
Conclusion
Click to buy Hospitality Dashboard in Power BI
The Hospitality Dashboard in Power BI is an invaluable tool for managing and analyzing your hospitality business. By providing detailed insights into bookings, revenue, guest satisfaction, and service usage, this dashboard helps you make informed decisions that optimize your operations and improve guest experiences. With its interactive charts and comprehensive metrics, this tool is essential for hospitality businesses looking to stay competitive and enhance customer satisfaction.
Frequently Asked Questions (FAQs)
1. How do I update the Hospitality Dashboard?
You can update the dashboard by entering new booking data into the Data Sheet Tab. The charts and metrics will automatically update based on the new data.
2. Can I track multiple room types and services?
Yes, the dashboard allows you to track multiple room types and services, providing insights into the performance of each offering.
3. How do I monitor customer satisfaction?
Use the Avg. Guest Rating and Avg. Guest Rating by Service Used to track guest satisfaction and determine which areas need improvement.
4. Can I share the dashboard with my team?
Yes, since the dashboard is created in Power BI, you can easily share it with your team for real-time updates and collaboration.
5. Is the dashboard customizable for my needs?
Yes, the dashboard is fully customizable. You can modify the layout, add new charts, and adjust the metrics to better suit your business’s specific needs.
Visit our YouTube channel to learn step-by-step video tutorials
Watch the step-by-step video Demo:
Click to buy Hospitality Dashboard in Power BI