Measuring client satisfaction is essential for delivering high-quality services and maintaining strong customer relationships. The Client Satisfaction Survey Dashboard in Excel is a ready-to-use tool designed to help businesses monitor client feedback, analyze trends, and identify areas for improvement.
This dashboard consolidates survey data into intuitive visuals, allowing managers to make data-driven decisions to improve client satisfaction.
What Is a Client Satisfaction Survey Dashboard?
A Client Satisfaction Survey Dashboard is an Excel-based tool that tracks key metrics from client surveys. It provides insights into overall satisfaction, service quality, communication, timeliness, and Net Promoter Score (NPS).
With this dashboard, businesses can:
-
Monitor satisfaction scores in real-time
-
Identify trends and patterns across clients, regions, and services
-
Evaluate the performance of different service channels
-
Take proactive actions to enhance client experiences
Key Features of the Dashboard
Click to Buy Client Satisfaction Survey Dashboard in Excel
This dashboard includes multiple sheet tabs designed for comprehensive analysis:
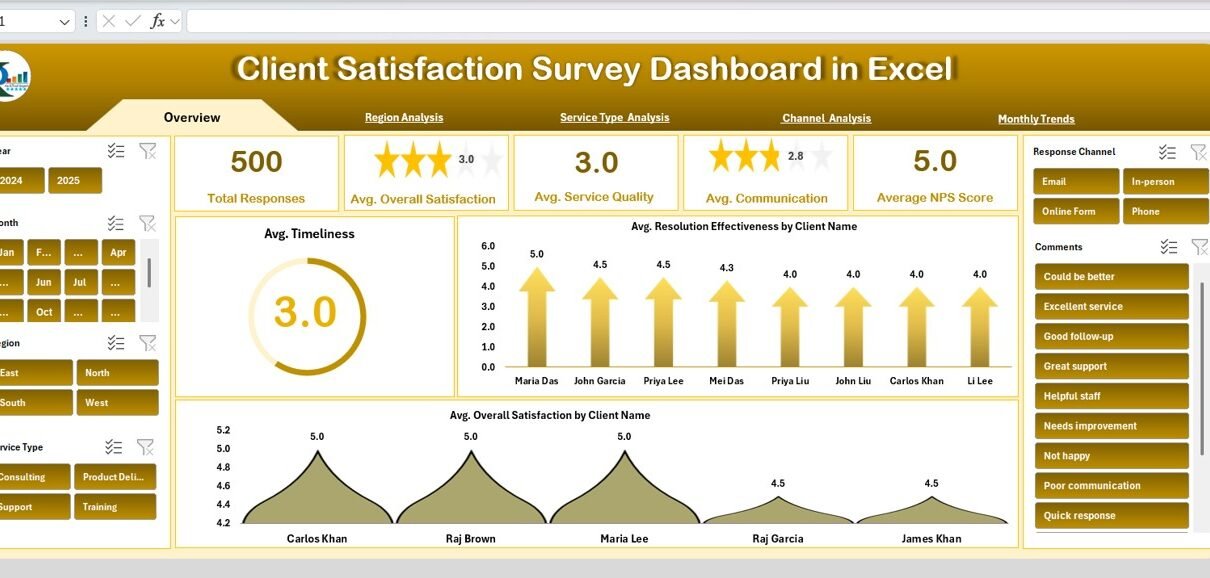
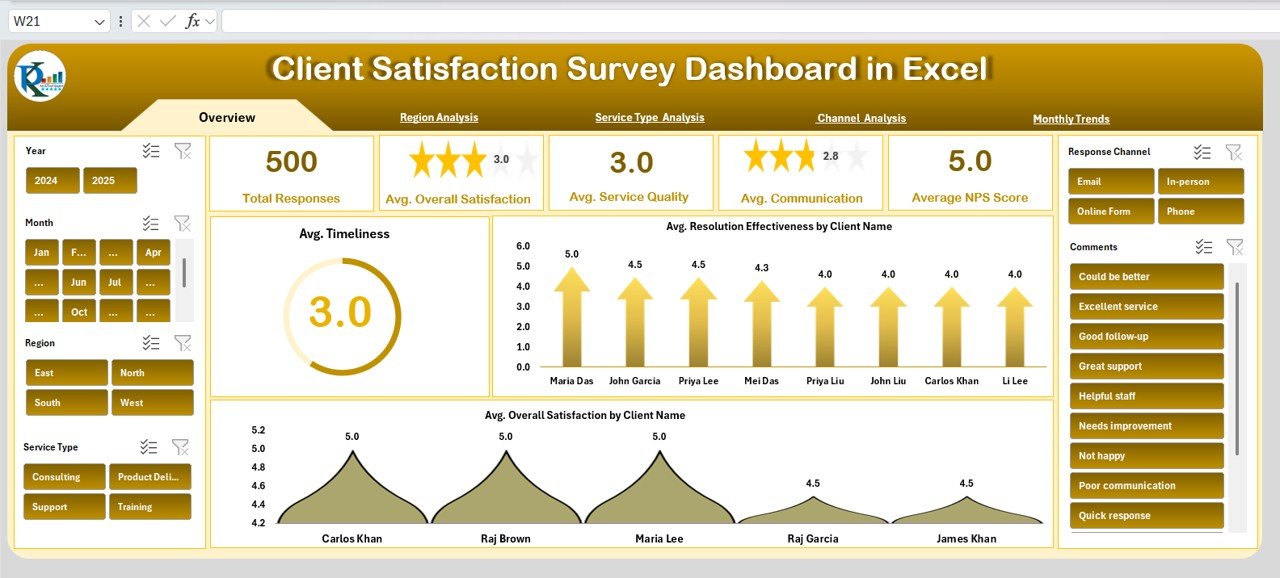
1. Overview Sheet Tab
The Overview sheet provides a high-level snapshot of client satisfaction metrics.
Cards:
-
Total Responses Collected – Total number of survey responses received
-
Average Overall Satisfaction – Aggregate satisfaction score
-
Average Service Quality – Measures client perception of service standards
-
Average Communication – Feedback on communication effectiveness
-
Average NPS Score – Net Promoter Score to gauge client loyalty
Charts:
-
Average Timeliness – Shows how quickly services are delivered
-
Average Resolution Effectiveness by Client Name – Highlights efficiency in resolving client issues
-
Average Overall Satisfaction by Client Name – Visualizes satisfaction across individual clients
Click to Buy Client Satisfaction Survey Dashboard in Excel
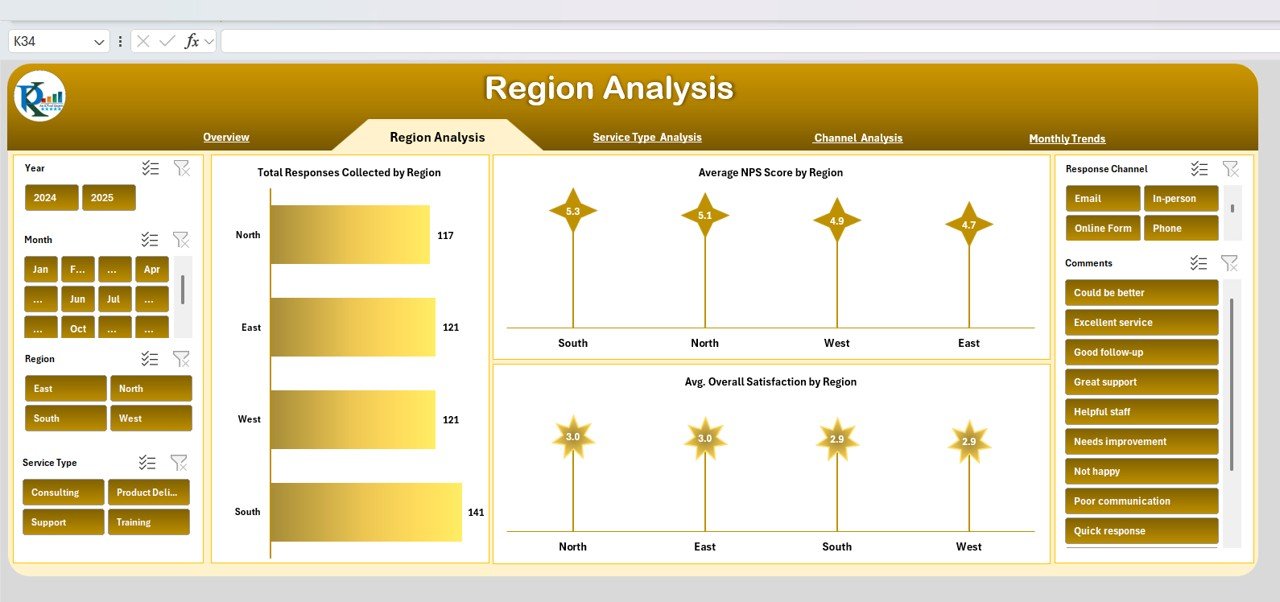
2. Region Analysis
This sheet focuses on geographic trends:
-
Total Responses by Region – Distribution of survey responses across locations
-
Average NPS Score by Region – Regional client loyalty
-
Average Overall Satisfaction by Region – Satisfaction comparison across different regions
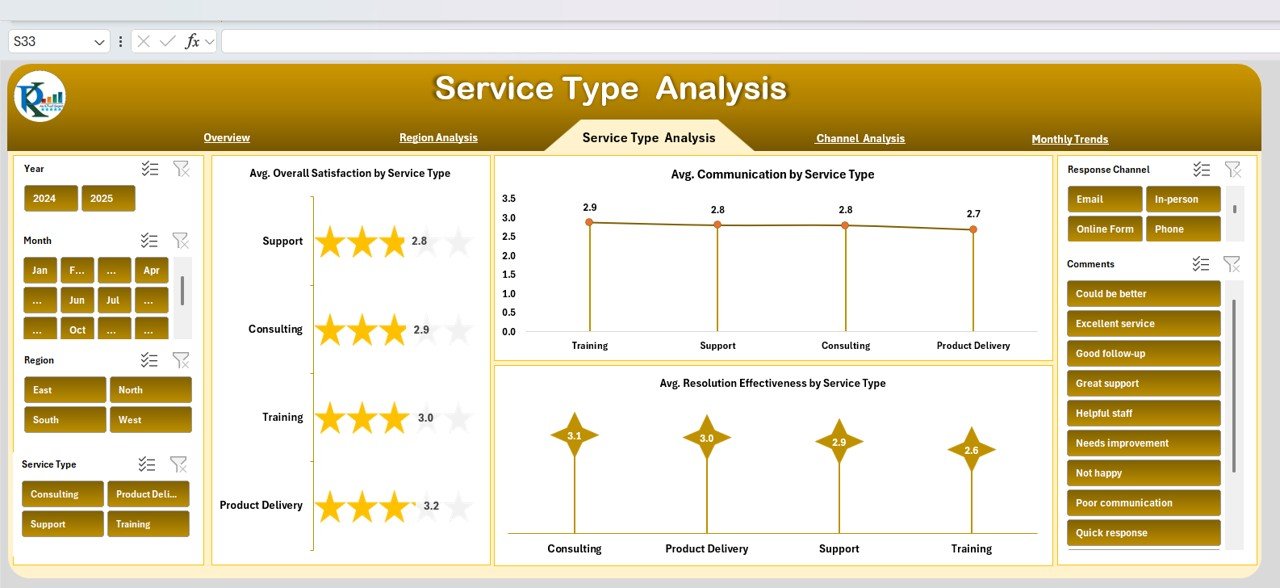
3. Service Type Analysis
Analyzes performance by type of service offered:
-
Average Overall Satisfaction by Service Type
-
Average Communication by Service Type
-
Average Resolution Effectiveness by Service Type
This sheet helps identify which services meet client expectations and which require improvement.
Click to Buy Client Satisfaction Survey Dashboard in Excel
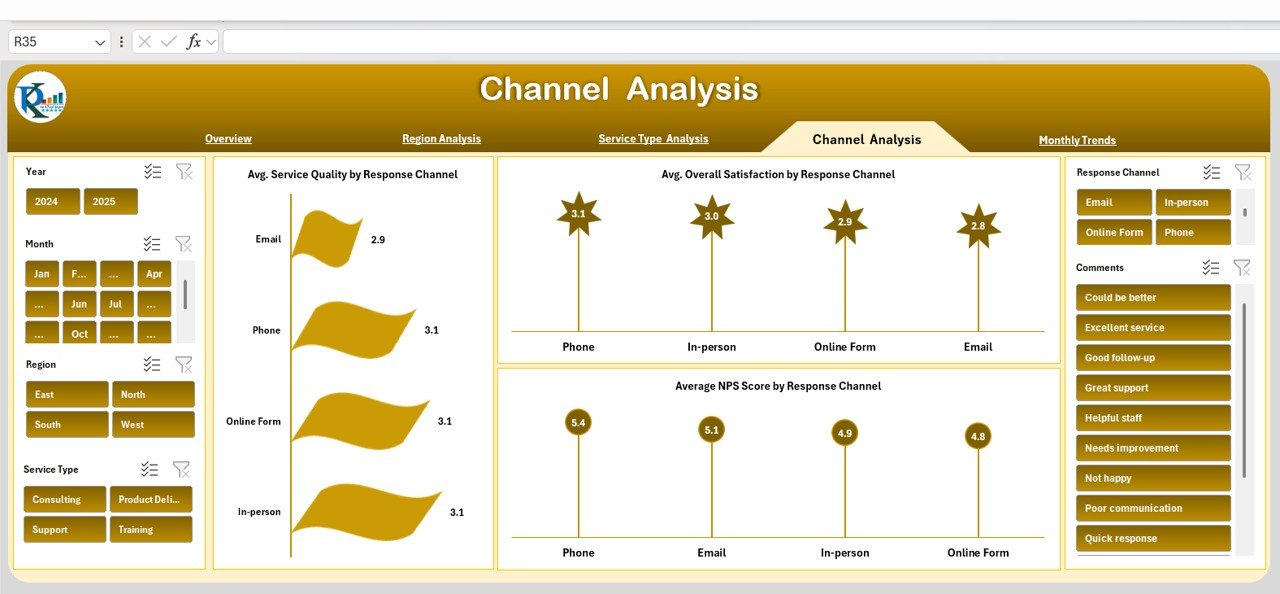
4. Channel Analysis
Tracks satisfaction metrics by the response channel used by clients:
-
Average Service Quality by Response Channel
-
Average Overall Satisfaction by Response Channel
-
Average NPS Score by Response Channel
This helps optimize client feedback channels for better engagement.
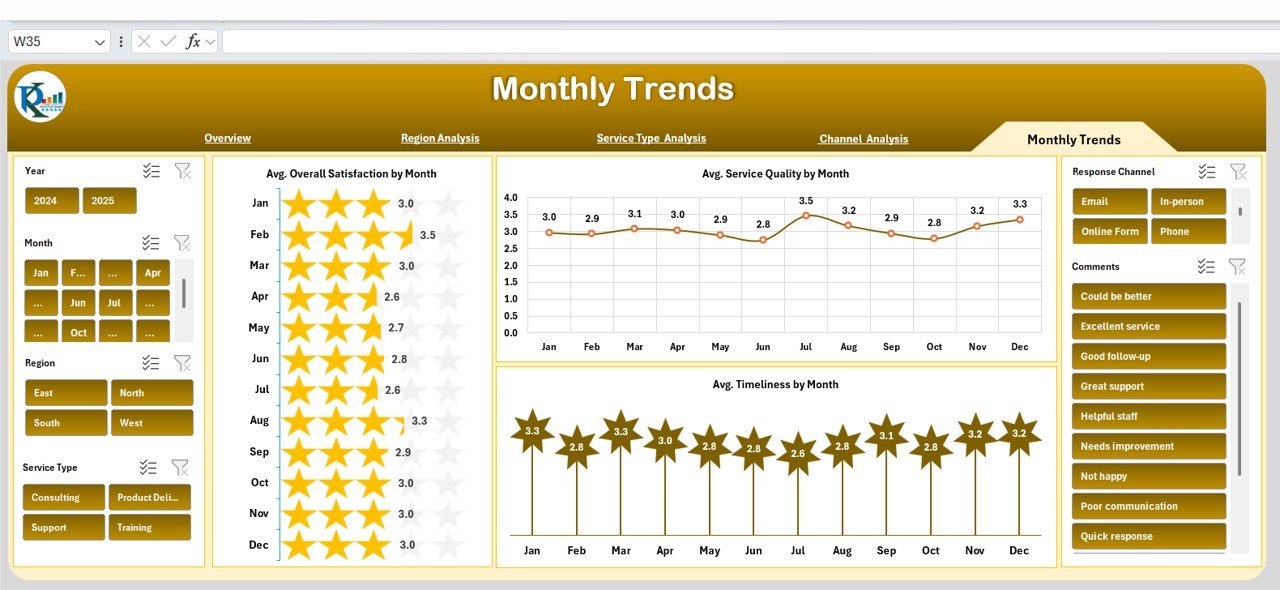
5. Monthly Trends
Visualizes satisfaction trends over time:
-
Average Overall Satisfaction by Month
-
Average Service Quality by Month
-
Average Timeliness by Month
This sheet allows businesses to monitor progress and evaluate the impact of initiatives over time.
Click to Buy Client Satisfaction Survey Dashboard in Excel
6. Data Sheet Tab
The Data sheet serves as the input hub:
-
Enter raw survey responses here
-
Includes all relevant fields such as client name, region, service type, channel, satisfaction scores, and NPS
-
Updates automatically reflect in the Overview, Region, Service Type, Channel, and Monthly Trend sheets
Advantages of Using the Client Satisfaction Dashboard
-
Centralized Data: All client feedback consolidated in one place
-
Real-Time Insights: Visuals update automatically when new data is entered
-
Trend Analysis: Identify patterns in satisfaction over time
-
Actionable Insights: Pinpoint areas needing improvement in service, communication, or resolution
-
Segment Analysis: Compare metrics by client, region, service type, and channel
-
Easy Reporting: Present data in a professional and visual format to stakeholders
Best Practices for Using the Dashboard
Click to Buy Client Satisfaction Survey Dashboard in Excel
-
Update Survey Data Regularly: Ensure all new responses are captured for accurate analysis
-
Segment Clients: Use filters to analyze satisfaction by region, service type, or channel
-
Monitor Trends: Track monthly changes in overall satisfaction, NPS, and service quality
-
Focus on Improvement Areas: Prioritize metrics or services with lower scores
-
Communicate Findings: Share insights with teams to enhance service delivery
How This Dashboard Helps Businesses
-
Enhances Client Experience: Identify and address dissatisfaction quickly
-
Improves Service Quality: Focus on areas that impact satisfaction the most
-
Boosts Client Retention: NPS and satisfaction scores help measure loyalty
-
Supports Strategic Planning: Data-driven insights guide decisions for service improvements
-
Optimizes Feedback Channels: Analyze which channels provide the most reliable insights
Frequently Asked Questions (FAQs)
Click to Buy Client Satisfaction Survey Dashboard in Excel
Q1: Can I customize the metrics in this dashboard?
Yes, you can add or modify KPIs, services, regions, and channels as needed.
Q2: How often should I update the data?
Ideally, update the data monthly or after receiving new survey responses for accurate insights.
Q3: Can I track trends over time?
Yes, the Monthly Trends sheet provides visuals for overall satisfaction, service quality, and timeliness over time.
Q4: Can this dashboard be used for multiple client segments?
Absolutely. Filter by client type, region, or service to analyze different segments independently.
Q5: Is this dashboard suitable for large organizations?
Yes, the Excel-based design can handle large datasets while providing automated visual updates.
Conclusion
The Client Satisfaction Survey Dashboard in Excel is a powerful tool for businesses to monitor and improve client satisfaction. With real-time visuals, trend analysis, and actionable insights, this dashboard helps organizations enhance service quality, communication, and overall client experience.
Visit our YouTube channel to learn step-by-step video tutorials
Watch the step-by-step video Demo:
Click to Buy Client Satisfaction Survey Dashboard in Excel