Maintaining a secure office environment is critical for any organization. Monitoring security incidents, response times, and resolution efficiency can be challenging without a centralized tool. The Office Security Incident Dashboard in Power BI provides a ready-to-use solution to track, analyze, and manage security incidents across your organization.
This article explains the key features, benefits, and best practices for using this dashboard to improve office safety and operational efficiency.
What Is an Office Security Incident Dashboard?
An Office Security Incident Dashboard is a data visualization tool designed to consolidate all security-related incidents in one platform. It helps security teams and facility managers track:
-
Incident counts and severity
-
Response and resolution times
-
Escalation and closure rates
-
Location-specific trends
With Power BI, you gain interactive and dynamic insights that enable proactive decision-making and efficient incident management.
Key Features of the Dashboard
The Office Security Incident Dashboard in Power BI includes multiple pages with cards, charts, and visual analytics:
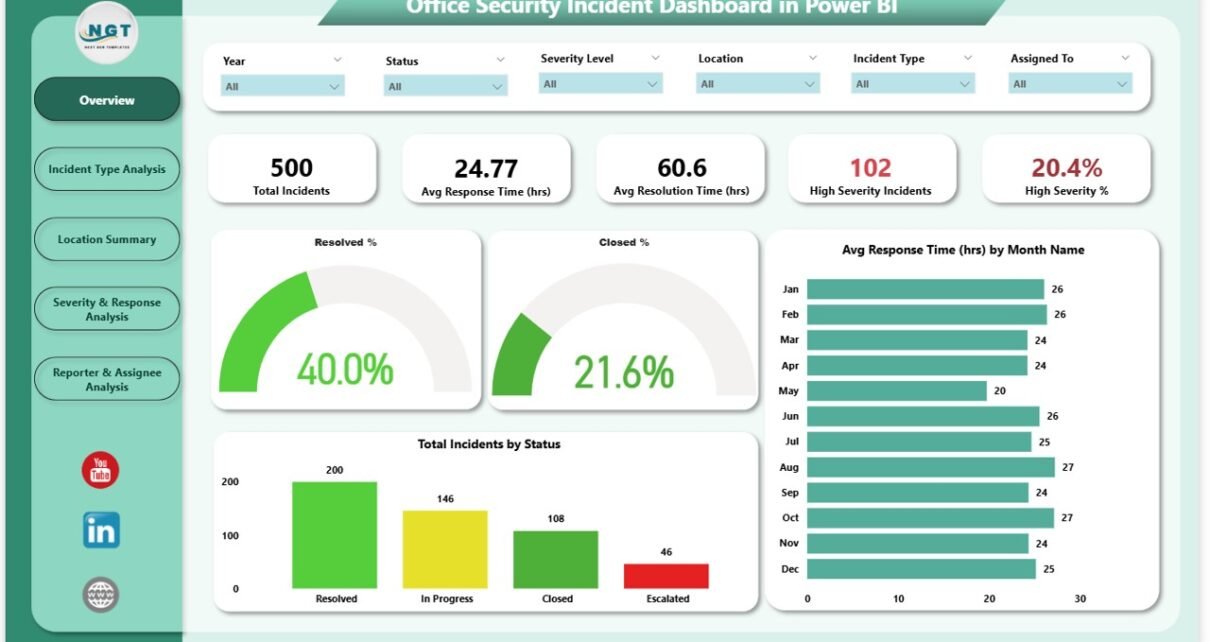
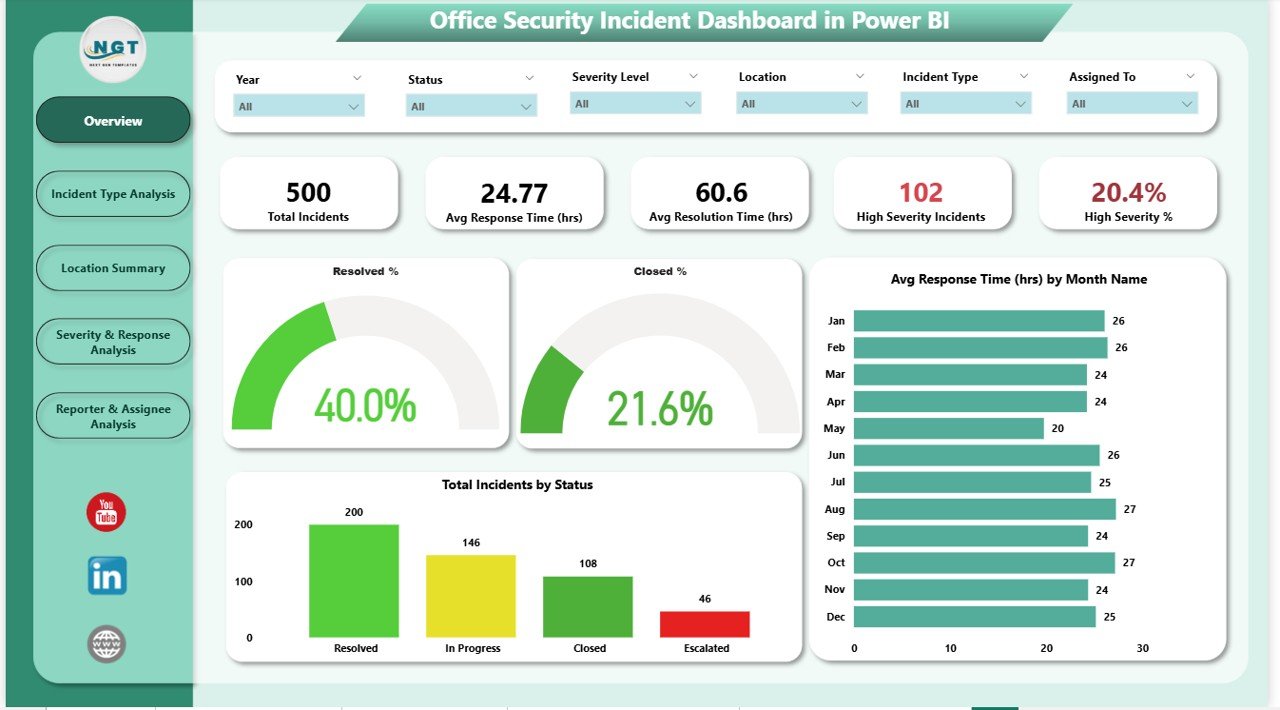
1. Overview Page
The Overview page provides a high-level snapshot of office security incidents:
Cards:
-
Total Incidents – Total number of reported incidents
-
Avg. Response Time (hrs) – Average time taken to respond
-
Avg. Resolution Time (hrs) – Average time to resolve incidents
-
High Severity % – Percentage of incidents categorized as high severity
-
High Severity Incidents – Count of high severity incidents
Charts:
-
Resolved % – Percentage of incidents resolved
-
Closed % – Percentage of incidents closed
-
Avg. Response Time (hrs) by Month – Trends in response efficiency
-
Total Incidents by Status – Breakdown by Open, In Progress, Resolved, and Closed
Click to Buy Office Security Incident Dashboard in Power BI
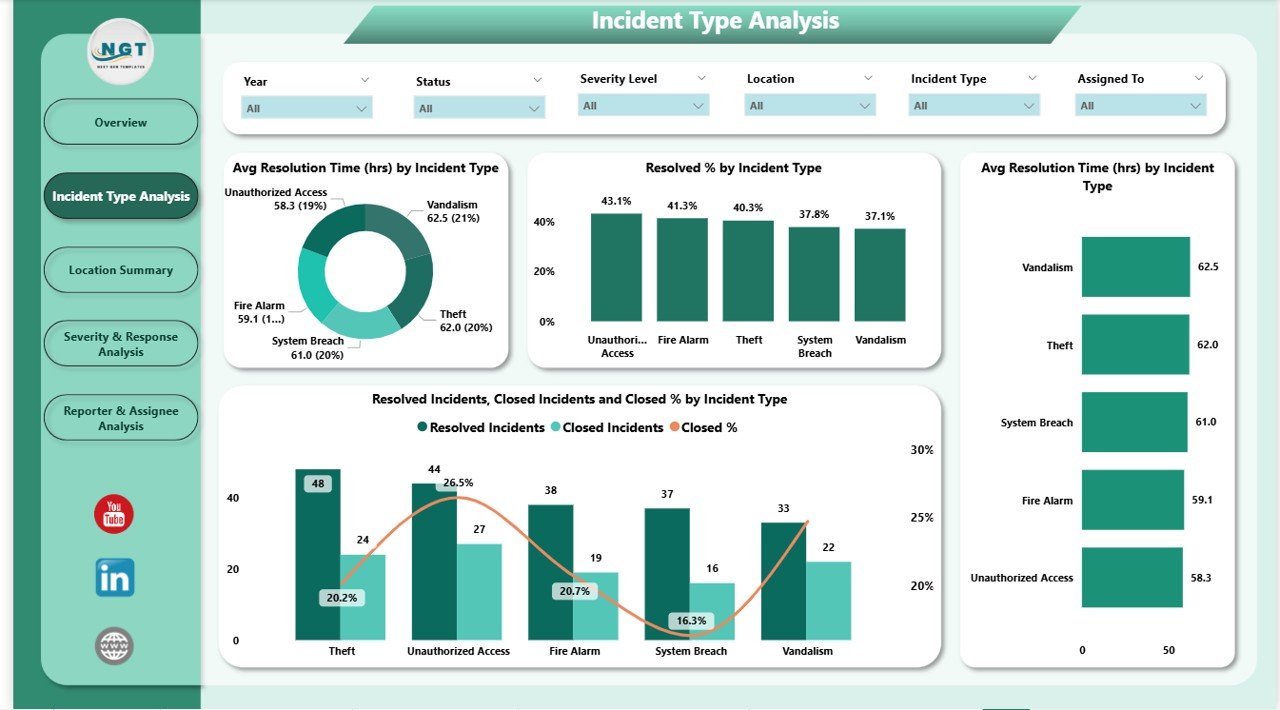
2. Incident Type Analysis
This page focuses on incident types and their resolution metrics:
Charts:
-
Avg. Resolution Time by Incident Type – Measures efficiency by type
-
Resolved % by Incident Type – Tracks success rate per incident category
-
Resolved and Closed Incidents by Type – Compare resolution and closure performance
This analysis helps identify which incident types need process improvements.
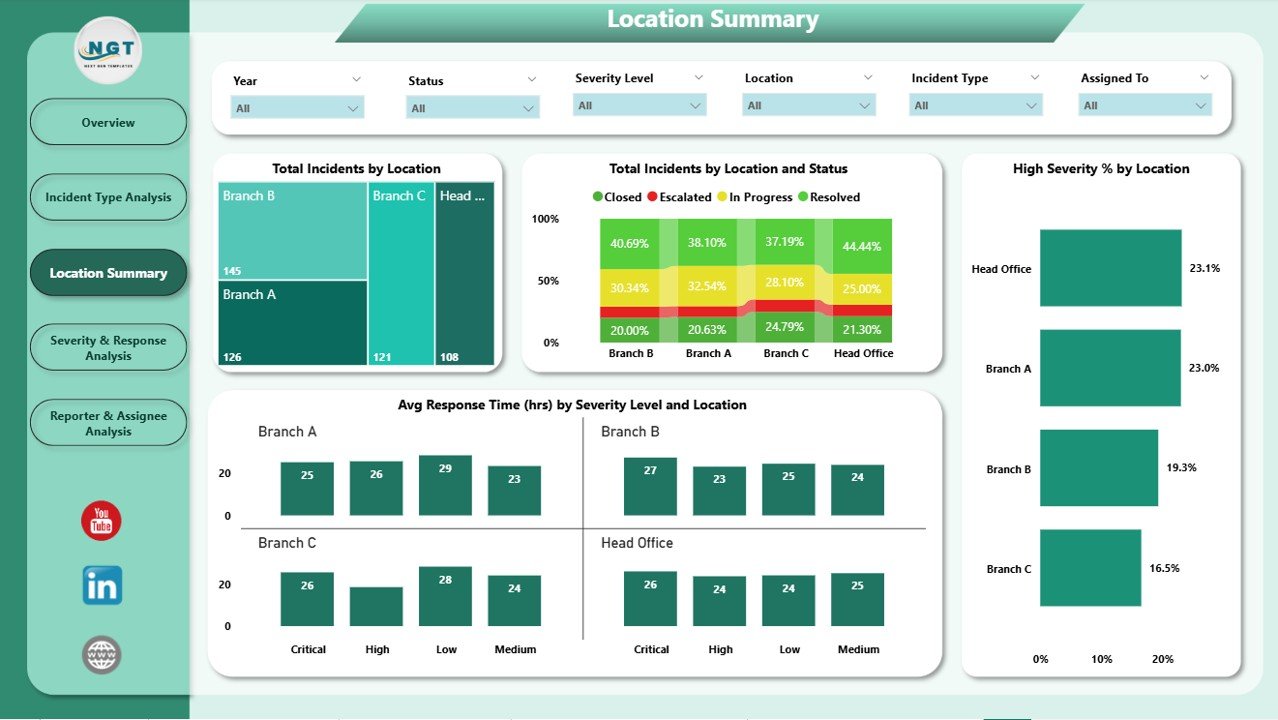
3. Location Summary
Track incidents geographically and understand location-based trends:
Charts:
-
Total Incidents by Location – Count of incidents per location
-
Total Incidents by Location and Status – Status-wise breakdown per office
-
Avg. Response Time by Severity Level and Location – Efficiency by severity and location
-
High Severity % by Location – Monitor critical incidents geographically
Click to Buy Office Security Incident Dashboard in Power BI
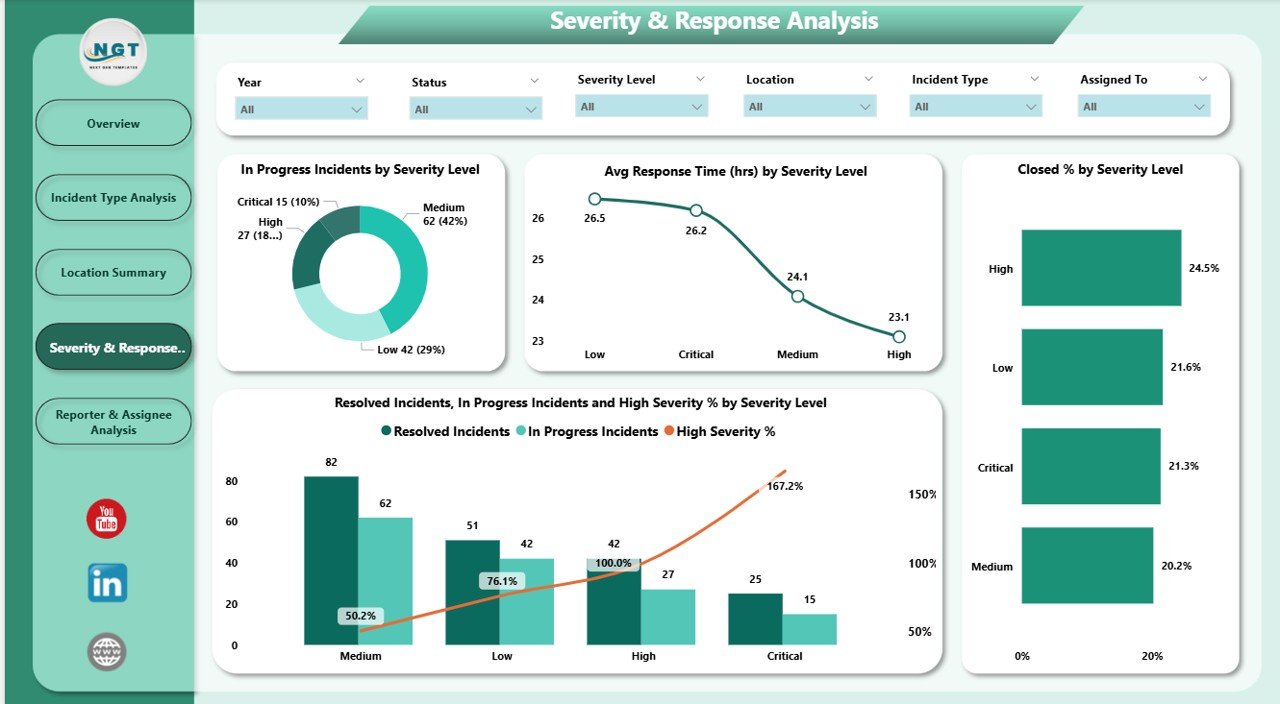
4. Severity & Response Analysis
Analyze incidents by severity to optimize response and resolution efforts:
Charts:
-
In Progress Incidents by Severity Level – Understand workload per severity level
-
Avg. Response Time by Severity Level – Identify delays in critical cases
-
Resolved, In Progress, and High Severity % by Severity Level – Monitor incident management performance
-
Closed % by Severity Level – Measure closure efficiency
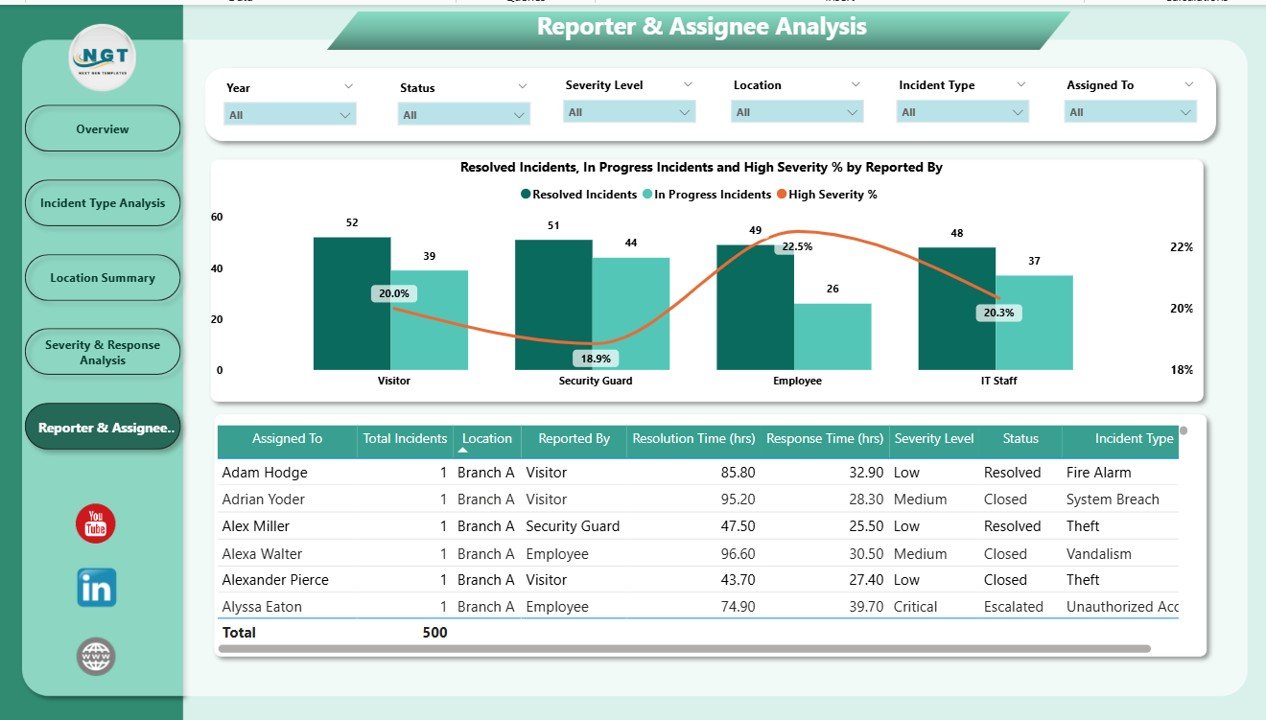
5. Closed % by Reported By
Evaluate performance based on the reporting source:
Charts:
-
Resolved, In Progress, and High Severity % by Reported By – Identify trends and effectiveness based on the person or department reporting incidents
This helps security teams optimize reporting and resource allocation.
Click to Buy Office Security Incident Dashboard in Power BI
Advantages of Using the Office Security Incident Dashboard
-
Centralized Incident Tracking: All incidents and metrics in one interactive dashboard
-
Real-Time Insights: Analyze incidents as they occur to respond quickly
-
Identify High-Risk Areas: Monitor high severity incidents by location and type
-
Optimize Response & Resolution: Track times and improve efficiency
-
Data-Driven Decisions: Allocate resources based on incident trends
-
Trend Analysis: Monitor monthly, by type, location, or reporter for actionable insights
Best Practices for Using the Dashboard
Click to Buy Office Security Incident Dashboard in Power BI
-
Update Data Promptly: Connect to live data sources to ensure real-time monitoring
-
Segment Analysis by Type and Location: Identify patterns and address recurring issues
-
Monitor Severity Metrics: Focus on high severity incidents to reduce risk
-
Track Response and Resolution Times: Set benchmarks and KPIs for security teams
-
Review Regularly: Use monthly or quarterly trend analysis for strategic planning
-
Use Filters and Drill-Throughs: Leverage Power BI’s interactive features to focus on specific incidents
How This Dashboard Helps Security Teams
-
Prioritize High Severity Incidents: Quickly identify critical cases for immediate action
-
Monitor Team Performance: Track response and resolution efficiency
-
Reduce Risk Exposure: Address recurring incidents and high-risk locations
-
Improve Reporting: Provide management with detailed visual insights
-
Allocate Resources Efficiently: Assign staff and resources based on trends and incident types
Frequently Asked Questions (FAQs)
Click to Buy Office Security Incident Dashboard in Power BI
Q1: Can I customize the dashboard for my organization?
Yes, Power BI dashboards are fully customizable. You can add additional KPIs, pages, or drill-throughs based on your needs.
Q2: How often should the data be updated?
Ideally, update incident data in real-time or daily for accurate monitoring and reporting.
Q3: Can I track incidents by location and severity simultaneously?
Yes, interactive filters and charts allow multi-dimensional analysis.
Q4: Does the dashboard show trends over time?
Yes, charts like Average Response Time by Month and Closed % by Severity Level track trends over time.
Q5: Can this dashboard help improve office security operations?
Absolutely. By identifying bottlenecks, recurring issues, and high-risk areas, it enables proactive management and resource allocation.
Conclusion
The Office Security Incident Dashboard in Power BI is a comprehensive tool for managing office security efficiently. With real-time insights, trend analysis, and interactive reporting, security teams can respond faster, resolve incidents effectively, and reduce risk exposure across the organization.
Visit our YouTube channel to learn step-by-step video tutorials
Watch the step-by-step video Demo:
Click to Buy Office Security Incident Dashboard in Power BI