Managing workplace incidents efficiently is critical for maintaining safety, compliance, and operational efficiency. The Office Incident Report Dashboard in Excel is a ready-to-use solution that allows organizations to monitor incidents, response times, resolution efficiency, and severity levels.
In this article, we will explain the features, advantages, and best practices of this dashboard to help organizations improve incident management processes.
What Is an Office Incident Report Dashboard?
An Office Incident Report Dashboard is an Excel-based tool that consolidates incident data into a visual, interactive format. It allows managers to track:
-
Total incidents and severity levels
-
Response and resolution times
-
Incident distribution by department, location, and reporter
-
Trends over time for proactive decision-making
By using this dashboard, organizations can enhance safety, reduce downtime, and optimize their response strategies.
Key Features of the Office Incident Report Dashboard
Click to Buy Office Incident Report Dashboard in Excel
This dashboard is structured into multiple sheets for comprehensive analysis:
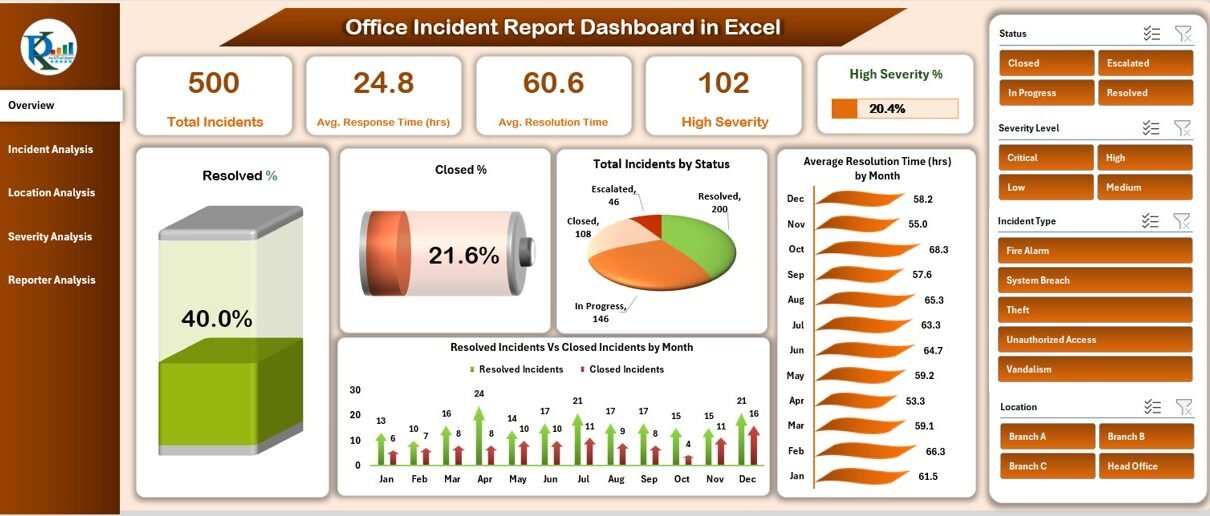
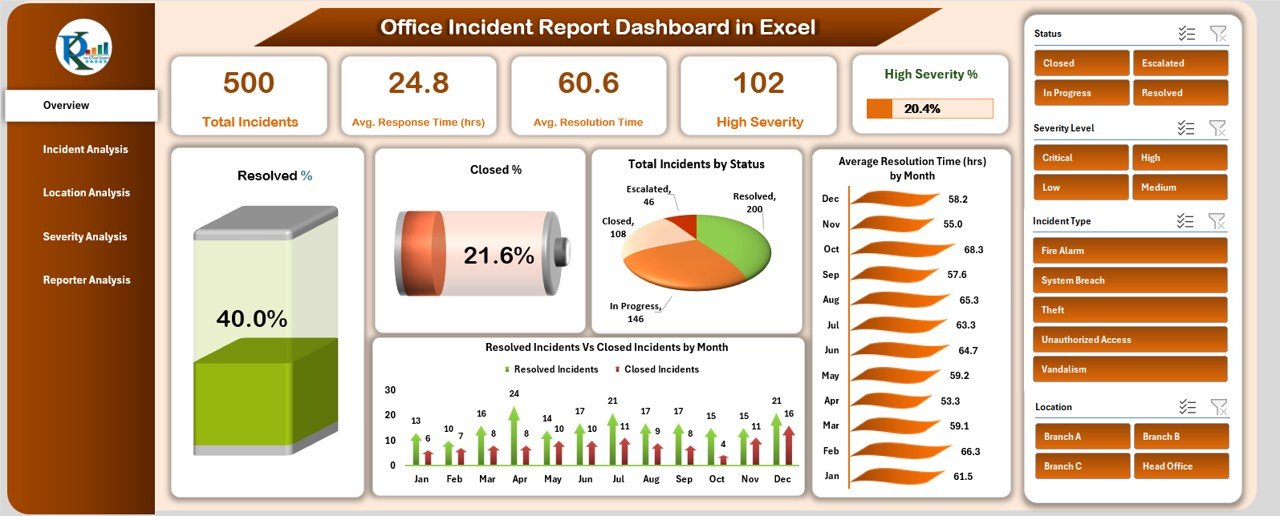
1. Overview Sheet
The Overview Sheet provides a high-level snapshot of incident management:
Cards:
-
Total Incidents: Total number of incidents reported
-
Avg. Response Time (hrs): Average time to respond to incidents
-
Avg. Resolution Time (hrs): Average time to resolve incidents
-
High Severity Incidents: Number of critical incidents
-
High Severity %: Percentage of high severity incidents
Charts:
-
Resolved % – Percentage of incidents resolved
-
Closed % – Percentage of incidents closed
-
Total Incidents by Status – Breakdown of incident statuses
-
Average Resolution Time by Month – Trend of resolution times
-
Resolved vs Closed Incidents by Month – Comparison over time
Click to Buy Office Incident Report Dashboard in Excel
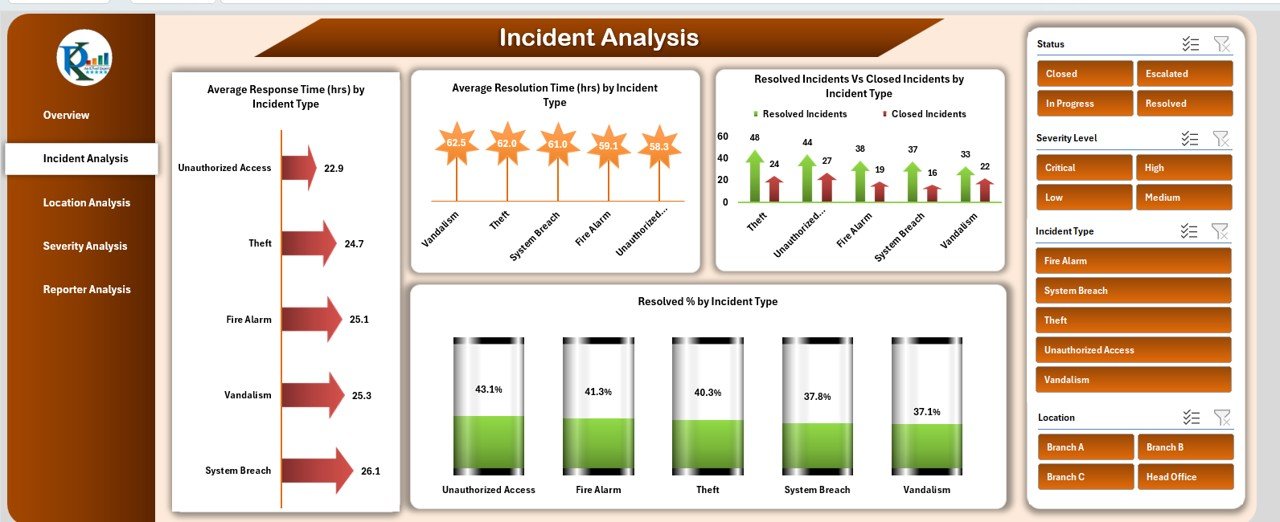
2. Incident Analysis Sheet
The Incident Analysis sheet focuses on metrics by incident type:
Charts:
-
Average Response Time by Incident Type
-
Average Resolution Time by Incident Type
-
Resolved vs Closed Incidents by Incident Type
-
Resolved % by Incident Type
This sheet helps identify high-risk incident types and areas for process improvement.
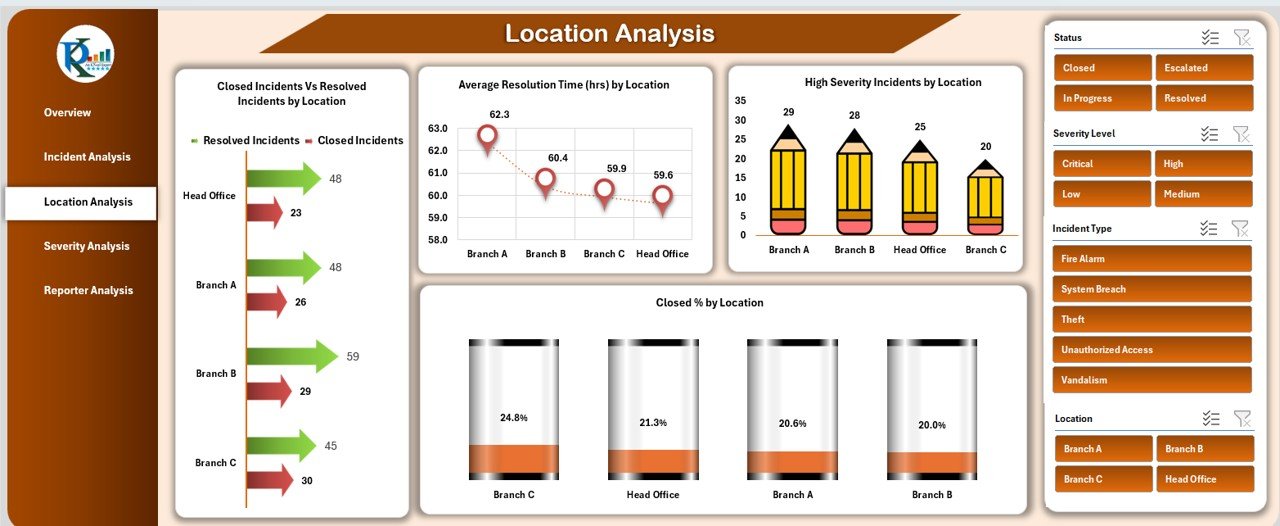
3. Location Analysis Sheet
The Location Analysis sheet monitors incident performance across office locations:
Charts:
-
Closed vs Resolved Incidents by Location
-
Average Resolution Time by Location
-
High Severity Incidents by Location
-
Closed % by Location
This analysis highlights locations requiring attention or additional resources.
Click to Buy Office Incident Report Dashboard in Excel
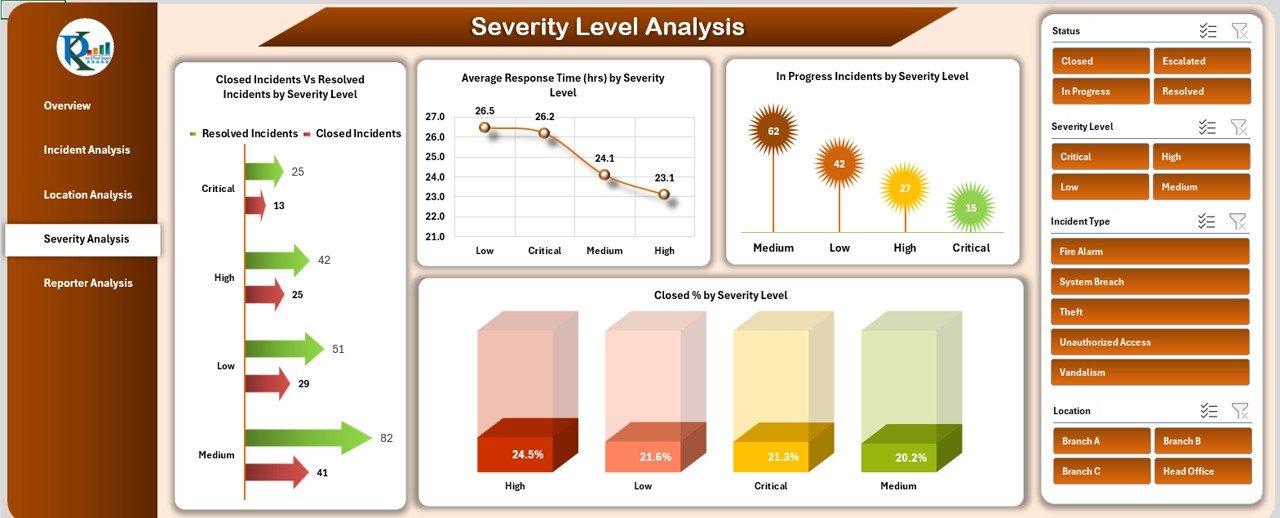
4. Severity Analysis Sheet
The Severity Analysis sheet tracks incidents based on severity levels:
Charts:
-
Closed vs Resolved Incidents by Severity Level
-
Average Response Time by Severity Level
-
In Progress Incidents by Severity Level
-
Closed % by Severity Level
It allows managers to prioritize high-severity incidents effectively.
Click to Buy Office Incident Report Dashboard in Excel
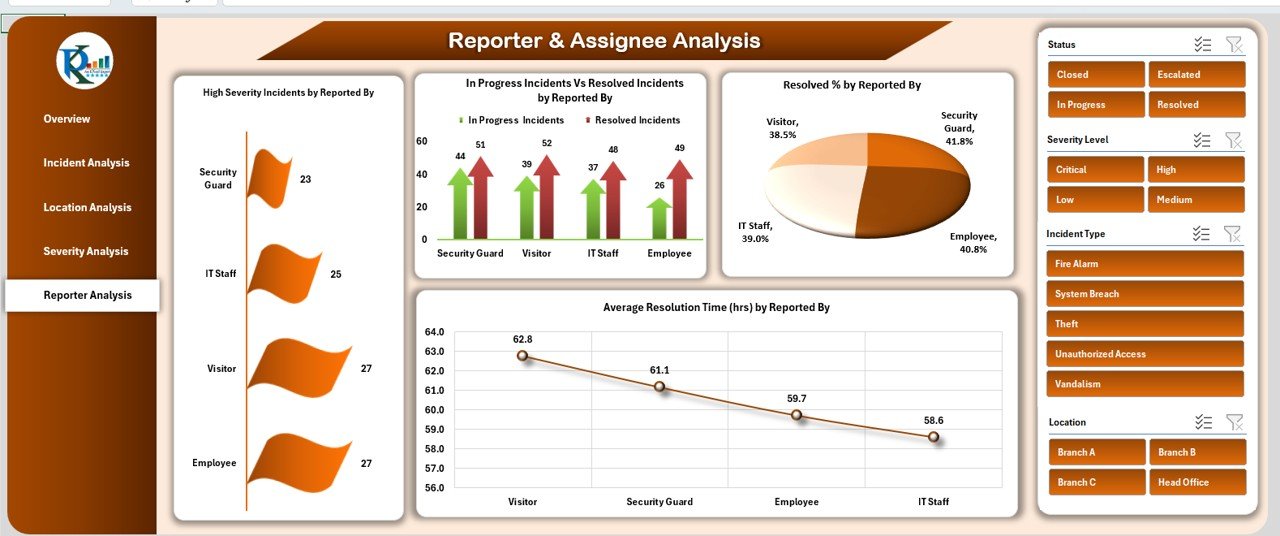
5. Reporter Analysis Sheet
The Reporter Analysis sheet evaluates incidents by the reporting personnel:
Charts:
-
High Severity Incidents by Reported By
-
In Progress vs Resolved Incidents by Reported By
-
Resolved % by Reported By
-
Average Resolution Time by Reported By
This helps identify trends, training needs, or reporting efficiency issues among employees.
Click to Buy Office Incident Report Dashboard in Excel
6. Data Sheet
The Data Sheet serves as the input source for all metrics and visualizations:
-
Includes details such as incident type, location, severity, reporter, response time, and resolution time
-
Updates in this sheet automatically reflect across all dashboard charts and cards
-
Ensures accuracy and consistency in reporting
Advantages of Using the Office Incident Report Dashboard
-
Centralized Data: All incident information is consolidated in one Excel file
-
Visual Insights: Cards and charts make it easy to track performance at a glance
-
Improved Response: Identify bottlenecks in response and resolution times
-
Location & Severity Tracking: Monitor high-risk areas and critical incidents
-
Trend Analysis: Observe monthly or yearly patterns for proactive decision-making
-
Actionable Insights: Allocate resources and prioritize incidents based on real-time data
Best Practices for Using the Dashboard
Click to Buy Office Incident Report Dashboard in Excel
-
Update Data Regularly: Ensure all incidents are logged promptly for accurate reporting
-
Monitor High-Severity Incidents: Prioritize critical issues for faster resolution
-
Track Department and Location Performance: Identify patterns and allocate resources efficiently
-
Use Conditional Formatting: Highlight overdue or critical incidents for quick visibility
-
Analyze Trends Over Time: Monthly or quarterly reviews can inform process improvements
-
Document Actions Taken: Keep notes in the Data Sheet for accountability
How This Dashboard Helps Organizations
-
Enhances Workplace Safety: Track and manage incidents to reduce risk
-
Improves Efficiency: Monitor response and resolution times to optimize operations
-
Supports Compliance: Maintain accurate records for audits and regulatory reporting
-
Identifies Training Needs: Analyze reporter trends and incident types to provide targeted training
-
Data-Driven Decision-Making: Use real-time insights to allocate resources and prevent recurring issues
Frequently Asked Questions (FAQs)
Click to Buy Office Incident Report Dashboard in Excel
Q1: Can I customize the dashboard for different departments?
Yes, you can filter or segment data by department to analyze specific areas.
Q2: How often should incident data be updated?
Ideally, data should be updated daily or weekly depending on the incident reporting volume.
Q3: Can I track both resolved and closed incidents separately?
Yes, the dashboard includes separate metrics for resolved and closed incidents to monitor workflow efficiency.
Q4: Is this dashboard suitable for multiple office locations?
Absolutely. Use the Location Analysis sheet to monitor and compare performance across sites.
Q5: Can I track trends over time?
Yes, charts like “Average Resolution Time by Month” and “Resolved vs Closed Incidents by Month” track trends effectively.
Conclusion
The Office Incident Report Dashboard in Excel is a comprehensive solution for monitoring and managing workplace incidents. With detailed insights across incident type, location, severity, and reporter, this dashboard helps organizations improve response times, enhance safety, and make data-driven decisions efficiently.
Visit our YouTube channel to learn step-by-step video tutorials
Watch the step-by-step video Demo:
Click to Buy Office Incident Report Dashboard in Excel