Maintaining environmental compliance is a critical responsibility for organizations across industries. The Environmental Compliance KPI Dashboard in Power BI is a ready-to-use solution that helps track key environmental performance indicators, monitor compliance metrics, and make data-driven decisions to reduce risk.
In this article, we will explain the features, advantages, best practices, and how to use this dashboard effectively.
What Is an Environmental Compliance KPI Dashboard?
An Environmental Compliance KPI Dashboard is a data visualization tool designed to monitor environmental metrics such as emissions, waste management, energy consumption, and regulatory adherence. Using Power BI, this dashboard consolidates data into an interactive and easy-to-read format.
It allows compliance officers, environmental managers, and executives to:
-
Track monthly and yearly compliance KPIs
-
Compare actual performance against targets and previous years
-
Identify areas of non-compliance or underperformance
-
Make informed decisions to improve environmental sustainability
Key Features of the Environmental Compliance KPI Dashboard
Click to Buy Environmental Compliance KPI Dashboard in Power BI
This dashboard is built with 3 pages in Power BI Desktop, offering a comprehensive view of compliance metrics.
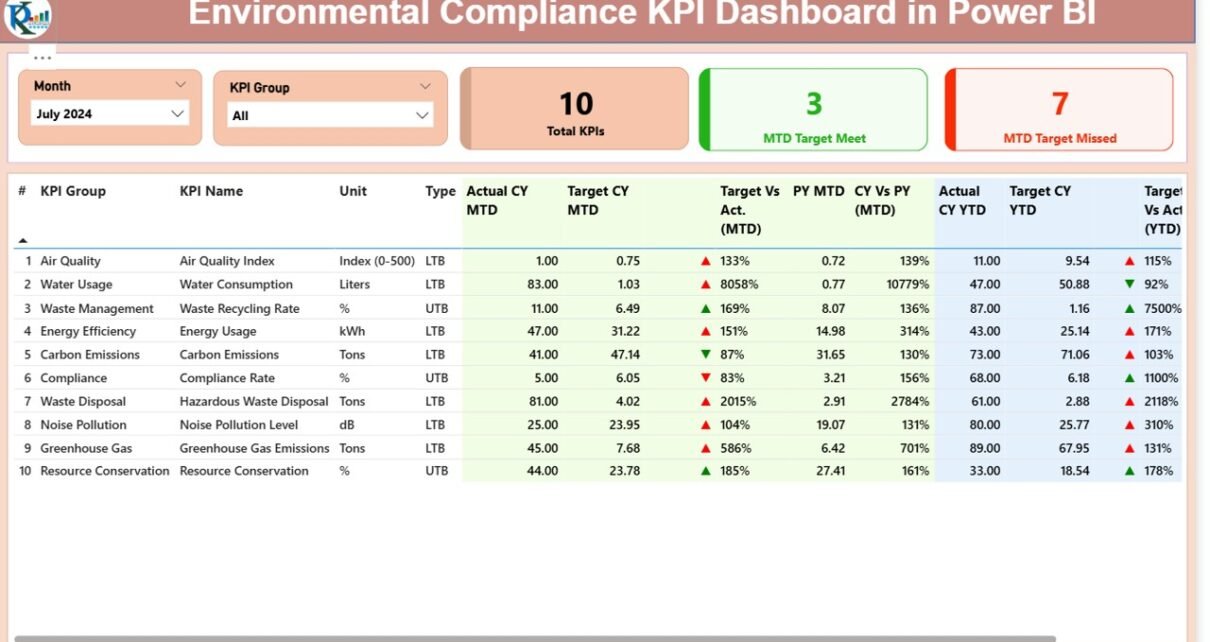
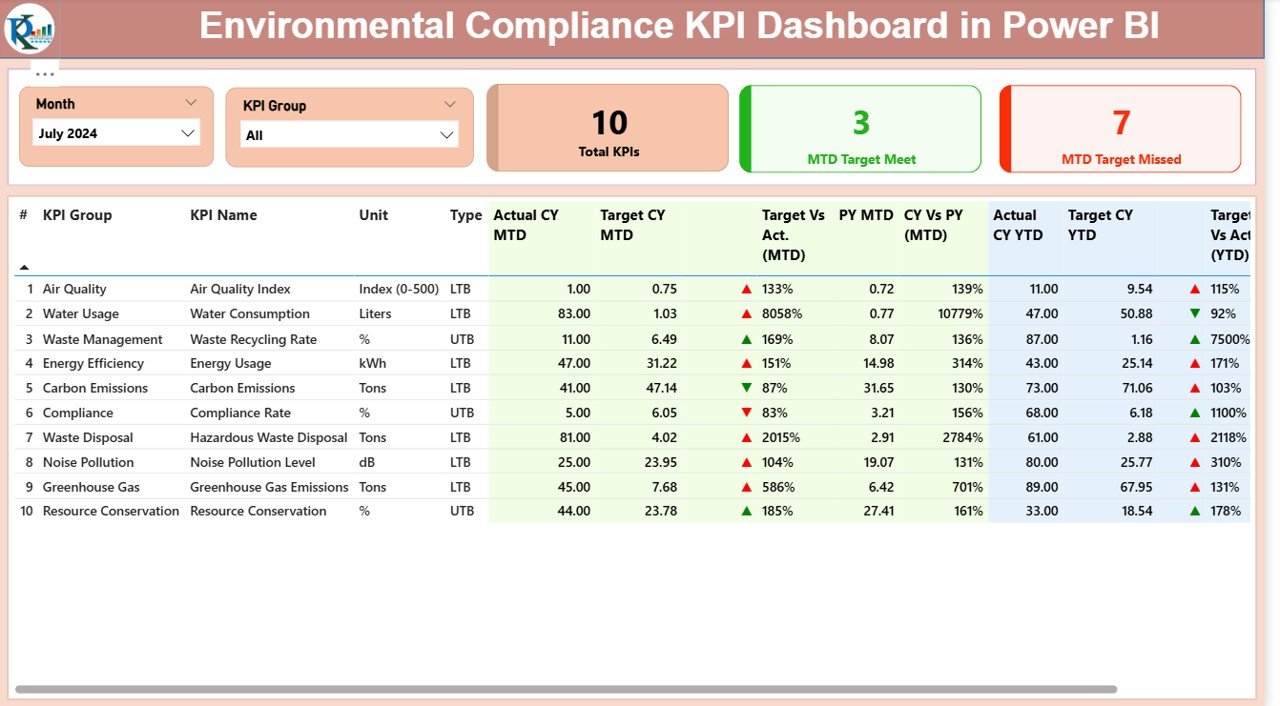
1. Summary Page
The Summary Page serves as the control center of the dashboard.
Cards:
-
Total KPIs Count – Total number of KPIs being tracked
-
MTD Target Meet Count – Number of KPIs that met the month-to-date target
-
MTD Target Missed Count – Number of KPIs that did not meet the target
Detailed Table:
The table provides the following information for each KPI:
-
KPI Number: Sequence number of the KPI
-
KPI Group: Category or group of the KPI
-
KPI Name: Name of the KPI
-
Unit: Measurement unit
-
Type: LTB (Lower-the-Better) or UTB (Upper-the-Better)
-
Actual CY MTD & Target CY MTD: Current year month-to-date actual and target
-
MTD Icon: Red or green arrow indicating performance against target
-
Target vs Actual (MTD): Percentage calculation = Actual ÷ Target
-
PY MTD: Previous year month-to-date value
-
CY vs PY (MTD): Comparison = Current Year ÷ Previous Year
-
Actual CY YTD & Target CY YTD: Year-to-date actual and target
-
YTD Icon: Conditional formatting for YTD performance
-
Target vs Actual (YTD): Percentage calculation = Actual ÷ Target
-
PY YTD & CY vs PY (YTD): Year-to-date previous year values and comparison
This layout allows quick evaluation of KPIs and instant identification of compliance issues.
Click to Buy Environmental Compliance KPI Dashboard in Power BI
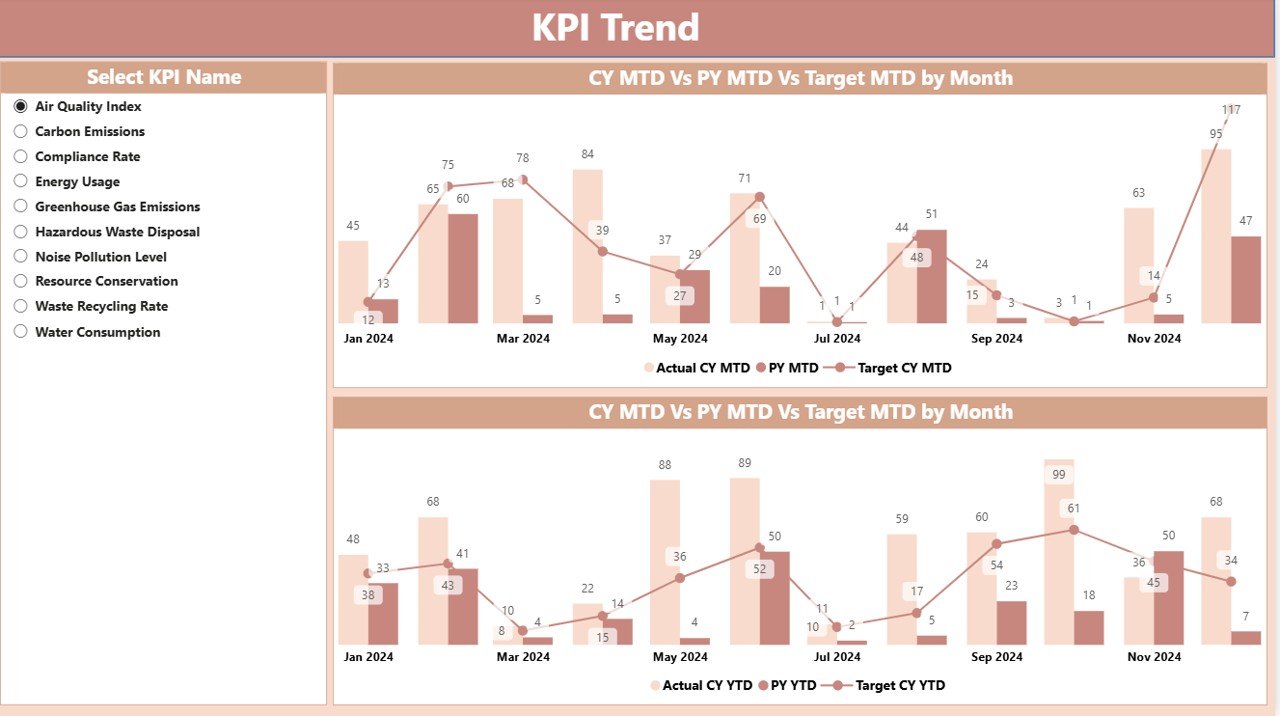
2. KPI Trend Page
The KPI Trend Page provides visual trend analysis for MTD and YTD performance.
-
Two combo charts display:
-
Actual numbers for current year
-
Previous year values
-
Target values
-
-
Slicer on the left allows selecting specific KPIs for drill-down analysis
This page helps monitor trends, identify patterns, and detect potential compliance gaps over time.
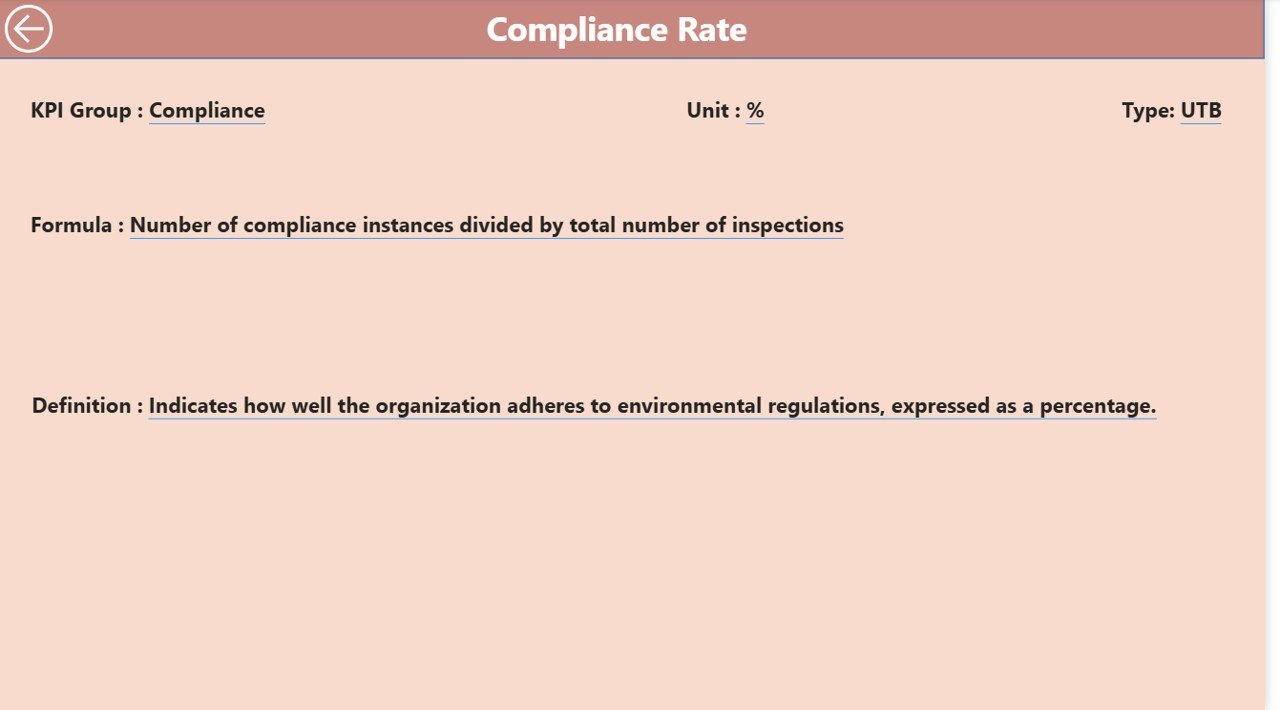
3. KPI Definition Page
The KPI Definition Page is a hidden drill-through page for detailed KPI information.
-
Includes KPI formula and definition for each metric
-
Accessible via drill-through from the Summary Page
-
Helps users understand how each KPI is calculated and interpreted
Click to Buy Environmental Compliance KPI Dashboard in Power BI
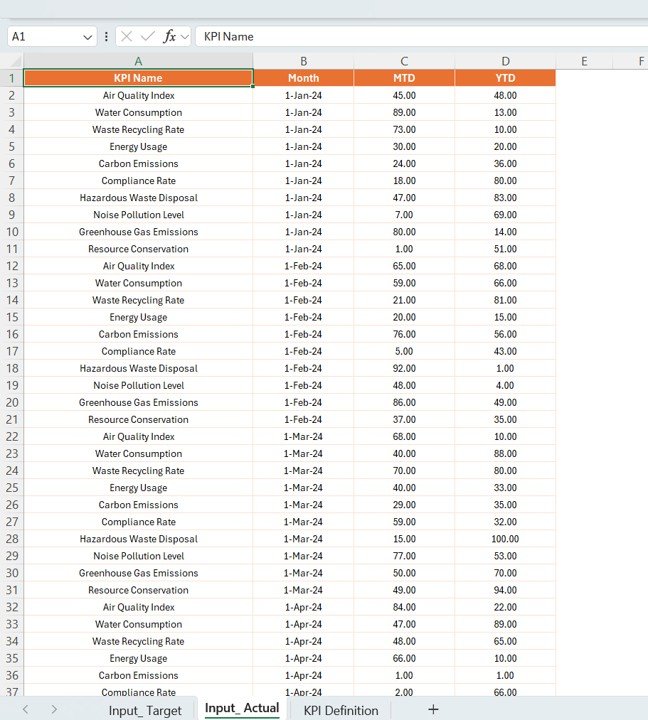
Excel Data Source
The dashboard uses an Excel file as its data source. It contains three worksheets:
-
Input_Actual Sheet:
-
Enter actual values for each KPI, including MTD and YTD numbers
-
Include the first date of the month for the MTD record
-
-
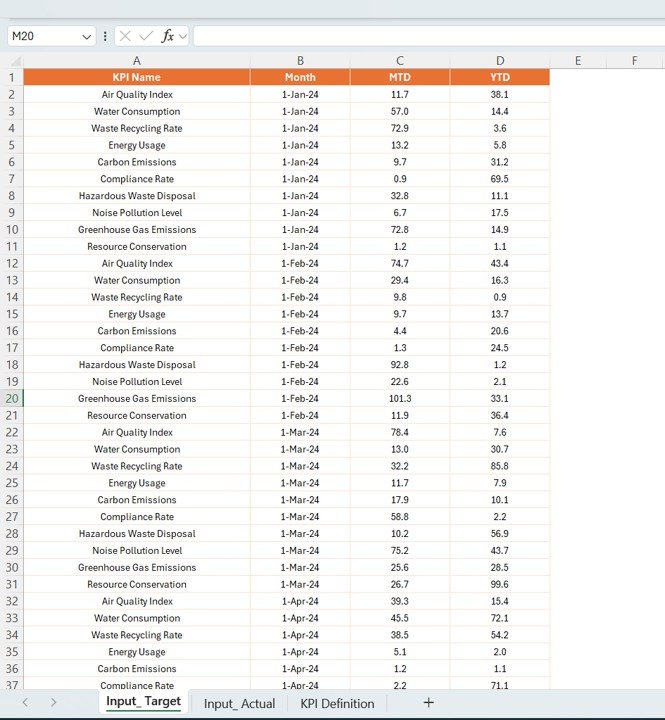
Input_Target Sheet:
-
Enter target values for each KPI, MTD and YTD
-
Click to Buy Environmental Compliance KPI Dashboard in Power BI
-
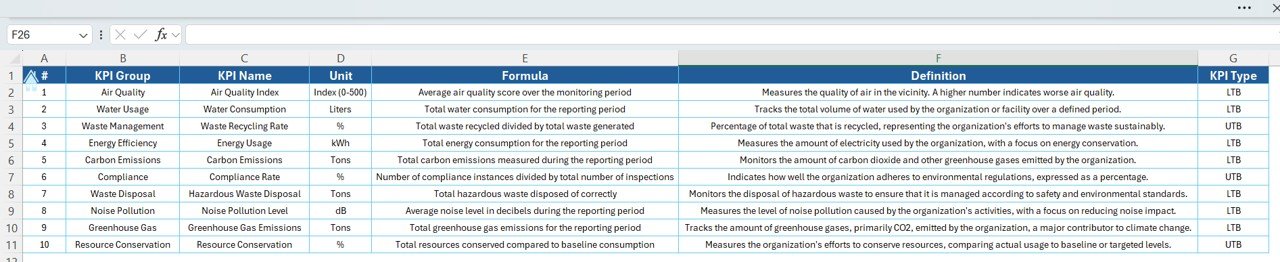
KPI Definition Sheet:
-
Fill KPI Number, KPI Group, KPI Name, Unit, Formula, Definition, and Type (LTB or UTB)
-
Accurate data input ensures reliable dashboard insights and meaningful trend analysis.
Advantages of Using the Environmental Compliance KPI Dashboard
-
Real-Time Monitoring: Track compliance KPIs instantly with Power BI visualizations
-
Data-Driven Decisions: Identify issues and take corrective actions quickly
-
Compare with Targets: Evaluate actual performance against defined goals
-
Year-over-Year Analysis: Monitor improvements and trends over time
-
Interactive and User-Friendly: Use slicers and drill-through for detailed insights
Best Practices for Using the Dashboard
Click to Buy Environmental Compliance KPI Dashboard in Power BI
-
Update Data Regularly: Ensure Excel inputs for MTD and YTD are up-to-date
-
Monitor Key Metrics: Focus on high-risk KPIs to prevent non-compliance
-
Use Conditional Formatting: Quickly identify KPIs performing below target
-
Review Trends Monthly: Detect deviations early and take corrective action
-
Document KPI Definitions: Maintain clarity and consistency in KPI calculations
How This Dashboard Helps Organizations
-
Ensures regulatory compliance and environmental standards
-
Reduces risks associated with non-compliance
-
Provides actionable insights for sustainability initiatives
-
Supports reporting to management and stakeholders
-
Identifies areas for improvement in environmental performance
Frequently Asked Questions (FAQs)
Click to Buy Environmental Compliance KPI Dashboard in Power BI
Q1: Can I customize the KPIs in this dashboard?
Yes, you can add or remove KPIs in the Excel source file, and the dashboard will update automatically.
Q2: How often should the data be updated?
Update monthly for MTD numbers and yearly for YTD values to maintain accuracy.
Q3: Can I compare KPIs with previous years?
Yes, the dashboard includes PY (Previous Year) values and comparisons for both MTD and YTD.
Q4: Is this dashboard suitable for large organizations?
Absolutely. Power BI handles large datasets and allows interactive drill-through analysis.
Q5: Does the dashboard show visual trends over time?
Yes, the KPI Trend page provides combo charts showing MTD, YTD, target, and previous year trends.
Conclusion
The Environmental Compliance KPI Dashboard in Power BI provides a comprehensive and interactive solution to monitor, analyze, and improve environmental performance. With clear visuals, trend analysis, and detailed KPI definitions, this dashboard helps organizations stay compliant, track progress, and make data-driven sustainability decisions.
Watch the step-by-step video Demo:
Visit our YouTube channel to learn step-by-step video tutorials
Click to Buy Environmental Compliance KPI Dashboard in Power BI