Managing a real estate business involves multiple dimensions — from sales and occupancy rates to rental yields and marketing performance. Without a clear performance tracking system, it becomes difficult to identify what’s working and what needs improvement. This is where a Real Estate KPI Scorecard in Excel plays a powerful role.
This ready-to-use Excel template helps real estate professionals track, analyze, and visualize key performance indicators (KPIs) efficiently. Whether you manage commercial properties, residential units, or real estate development projects, this scorecard gives you full control over your data-driven decision-making.
Click to buy Real Estate KPI Scorecard in Excel
What Is a Real Estate KPI Scorecard?
A Real Estate KPI Scorecard is an Excel-based performance tracking tool designed to measure, monitor, and evaluate the most important metrics of a real estate business.
It brings together operational, financial, and customer data in one structured view, allowing business owners and property managers to make informed decisions quickly.
You can view month-to-date (MTD) and year-to-date (YTD) values, analyze trends, and identify performance gaps — all through interactive dashboards and visual indicators.
Key Features of the Real Estate KPI Scorecard in Excel
This Excel template is built to simplify performance management. It includes four essential worksheet tabs, each serving a specific function. Let’s explore them one by one.
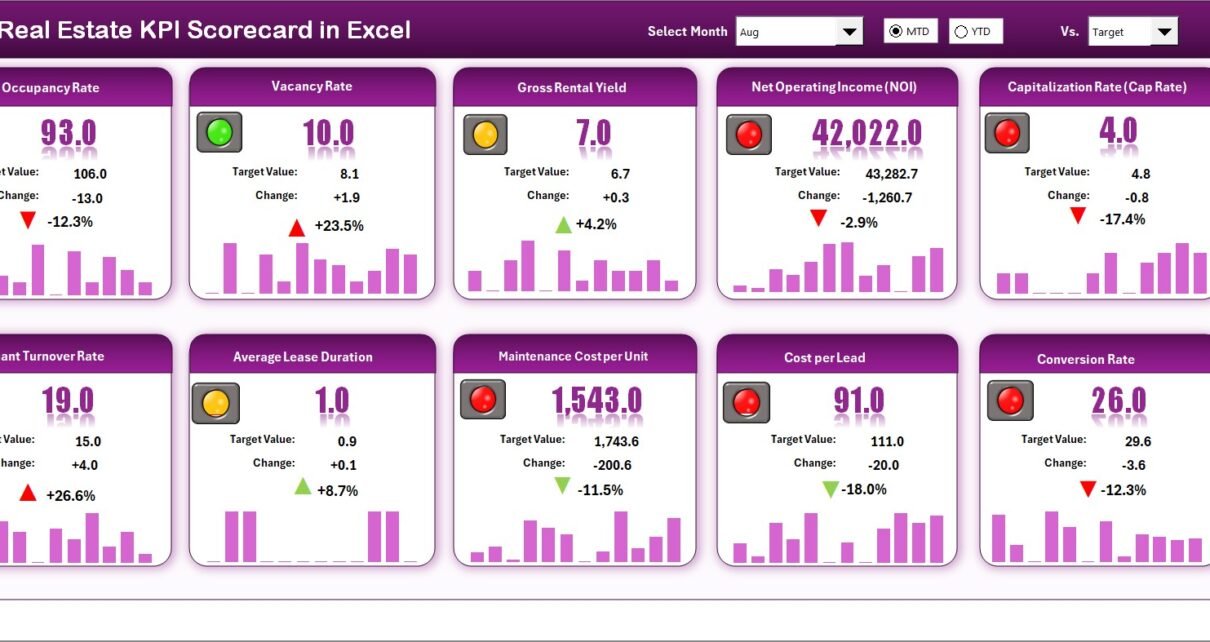
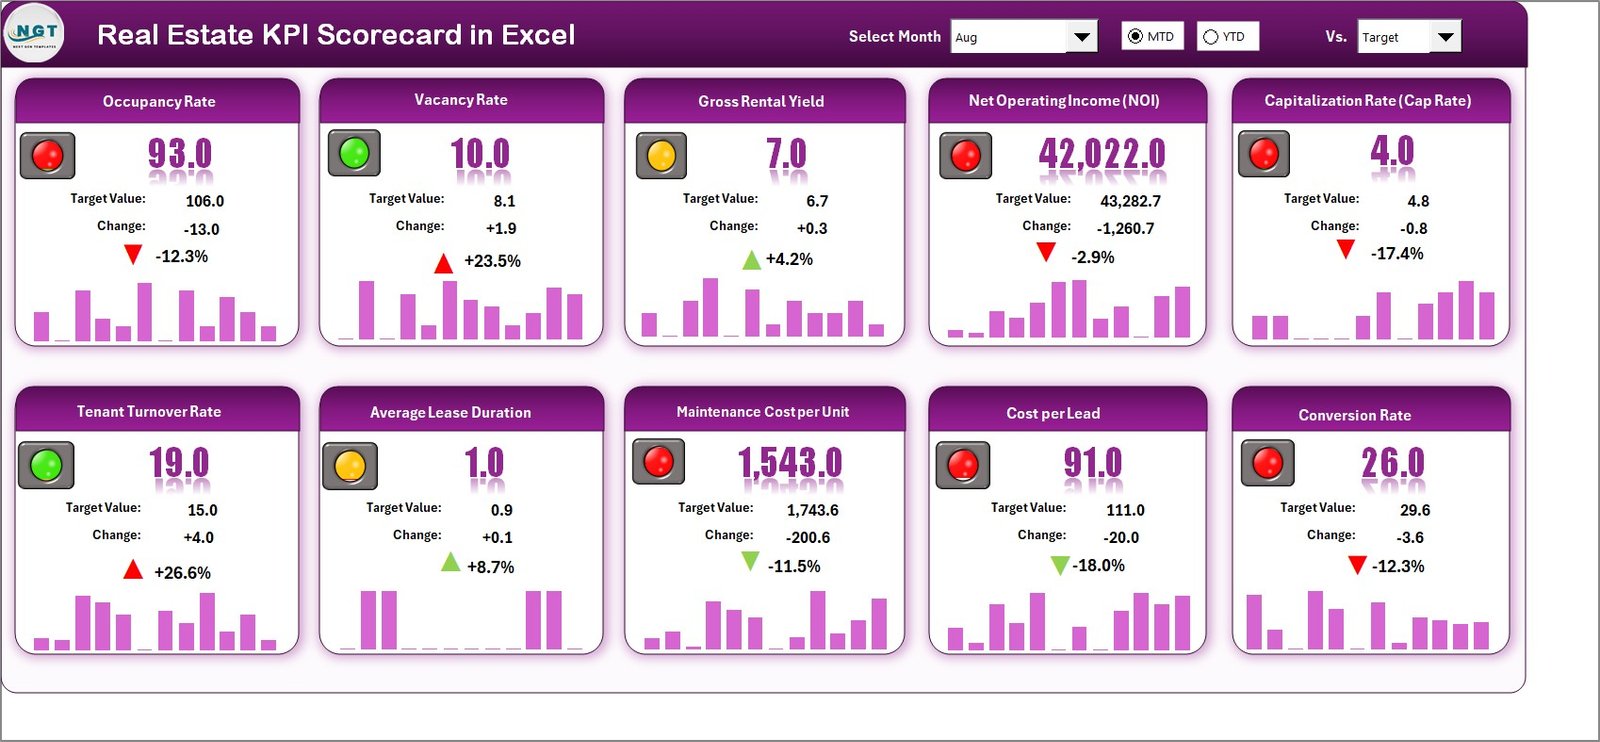
Scorecard Sheet
The Scorecard Sheet is the main page of the workbook — your central hub for real estate performance.
Key Features:
- Dropdown Menus: Select the desired month and period type (MTD or YTD) for analysis.
- Actual vs Target Comparison: Evaluate how close your performance is to your set goals.
- Color-Coded Indicators: Visual cues (green for good, red for poor) help you instantly spot performance issues.
- Comprehensive KPI Overview: View 10 KPIs at once, including financial, sales, and occupancy metrics.
- Dynamic Calculation: Automatically updates data when you refresh or input new numbers in the data sheet.
This sheet offers a 360° overview of your business performance without requiring any manual calculations.
Click to buy Real Estate KPI Scorecard in Excel
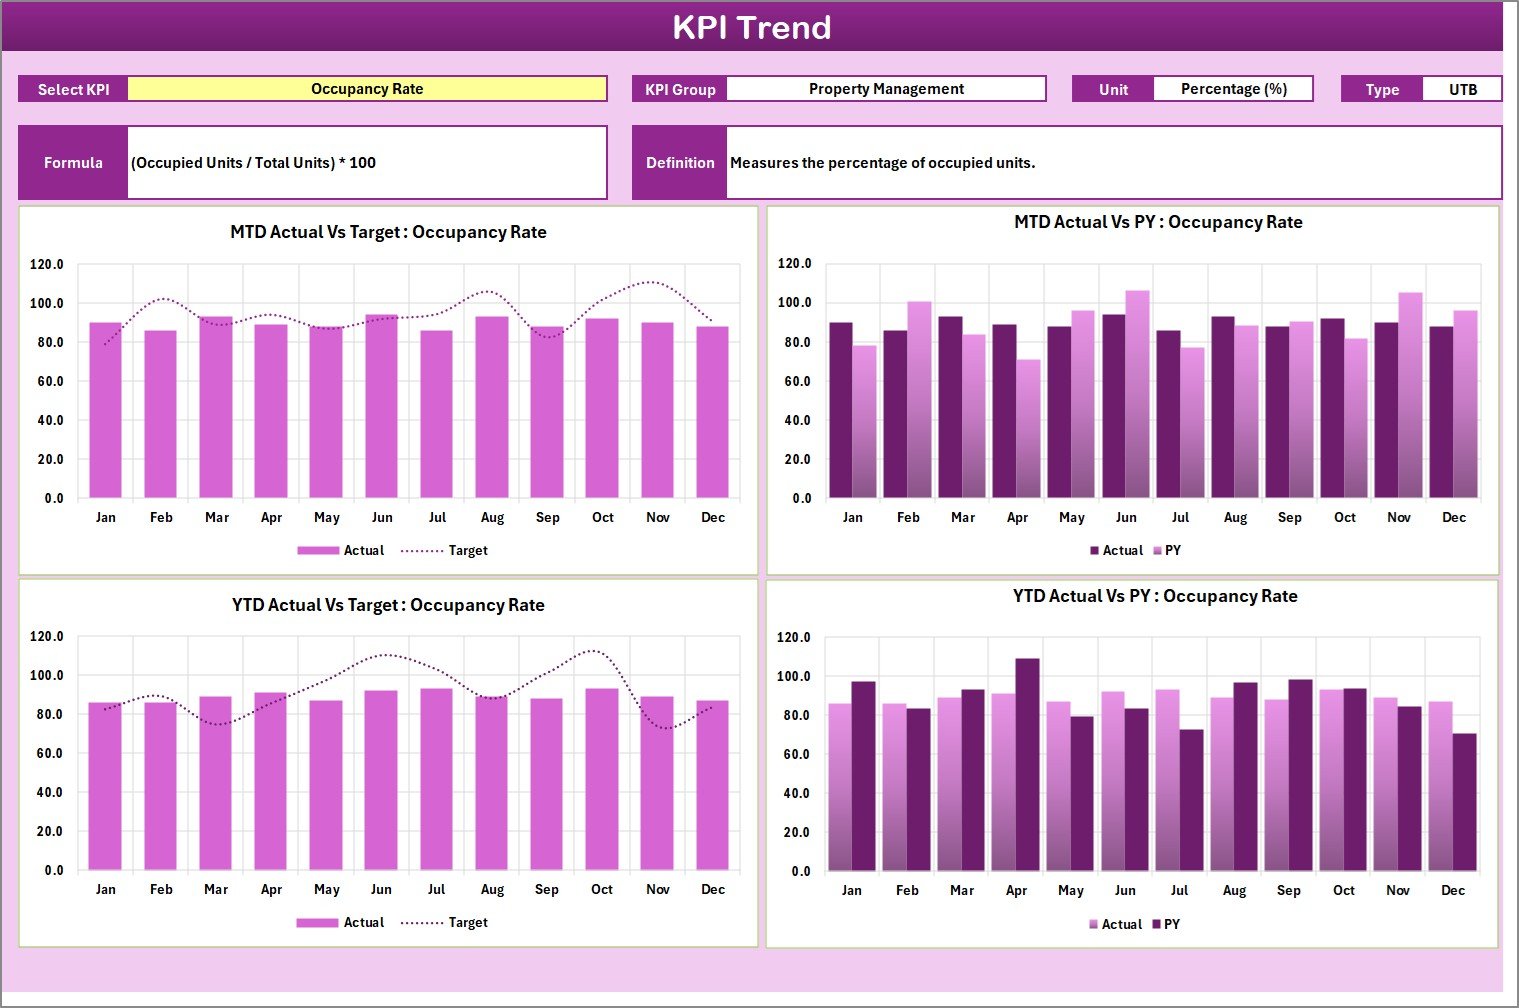
KPI Trend Sheet
The KPI Trend Sheet provides a detailed look into individual KPI performance.
Features and Insights:
- Dynamic KPI Selection: Use the dropdown in cell C3 to select a KPI for trend analysis.
- Detailed KPI Information: Automatically displays KPI Group, Unit, Formula, and Definition.
- Performance Type: See whether the KPI is “Lower the Better” (LTB) or “Upper the Better” (UTB).
- Trend Charts: Visualize MTD and YTD trends for Actual, Target, and Previous Year (PY) data.
- Comparative Analysis: Easily spot improvement or decline patterns across different timeframes.
This sheet helps managers understand not only how KPIs are performing but also why trends are changing.
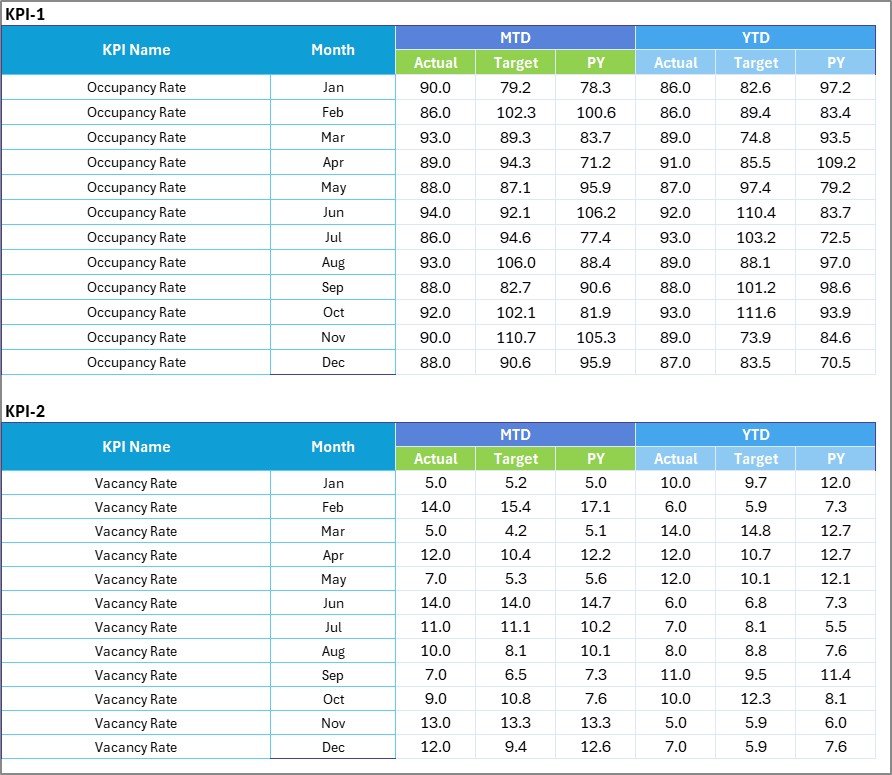
Input Data Sheet
This sheet is the data backbone of your entire scorecard.
🧾 Functions:
- Data Entry Section: Input actual, target, and previous year values for each KPI monthly.
- Flexible Structure: You can add or modify KPIs, months, or departments as per your business needs.
- Real-Time Updates: Any data changes automatically reflect across the dashboard and trend sheets.
- Ease of Maintenance: Simple table format with structured fields ensures easy data management.
This sheet ensures that your data-driven insights are always accurate, updated, and actionable.
Click to buy Real Estate KPI Scorecard in Excel
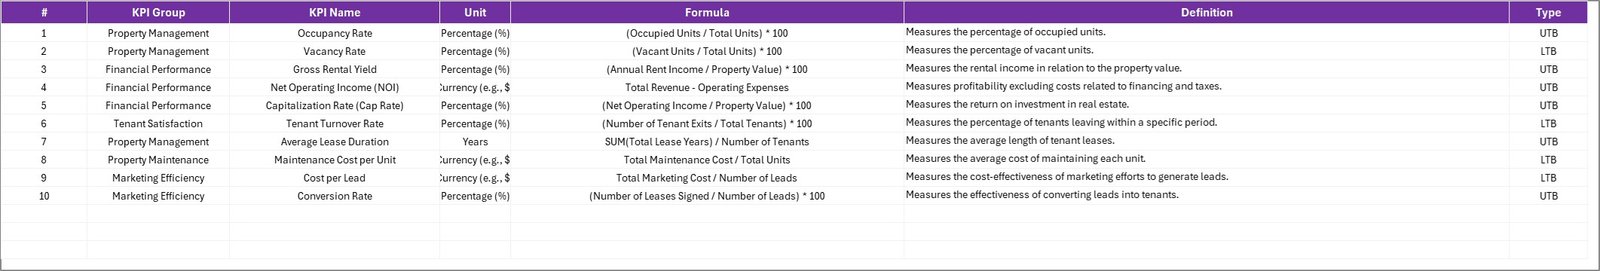
KPI Definition Sheet
A professional scorecard must clearly define every KPI used in reporting — and this tab fulfills that purpose.
Key Elements:
- KPI Name and Group: Categorize your metrics for better organization.
- Unit and Formula: Specify how each KPI is measured and calculated.
- Definition: Provide short, clear descriptions to avoid confusion.
- Consistency: Standard definitions ensure everyone in your organization interprets data the same way.
This sheet ensures data transparency and alignment across all departments.
Why Real Estate Businesses Need KPI Scorecards
Real estate operations involve many moving parts — sales, leasing, maintenance, marketing, and finance. Without clear visibility, inefficiencies can easily go unnoticed.
Here’s why using a Real Estate KPI Scorecard in Excel can transform your operations:
Centralized Data View
Track performance metrics from multiple sources in one place. No more switching between different reports or systems.
Improved Decision-Making
With clear visual insights, managers can quickly identify underperforming areas and take corrective action.
Goal Tracking
Monitor performance against targets — monthly, quarterly, or annually — ensuring alignment with business objectives.
Enhanced Accountability
Each KPI is linked to specific departments or individuals, promoting responsibility and performance ownership.
Trend Analysis
Spot seasonal or long-term patterns in metrics like occupancy rate, rental income, or maintenance costs.
These KPIs create a balanced view of your organization’s financial health, customer relationships, and operational efficiency.
How to Use the Real Estate KPI Scorecard in Excel
Using this scorecard template is straightforward. Here’s a step-by-step process:
Step 1: Enter Data in the Input Sheet
Fill in your actual, target, and previous year data for each KPI monthly. Make sure data accuracy is maintained.
Step 2: Define KPIs
Go to the KPI Definition Sheet and ensure every KPI has a clear definition, unit, and formula.
Step 3: View Performance on the Scorecard Sheet
Select your month and time period (MTD/YTD) from the dropdown menus to view instant insights.
Step 4: Analyze KPI Trends
Go to the KPI Trend Sheet to visualize progress over time. Identify whether performance is improving or declining.
Step 5: Take Corrective Action
Use insights from the dashboard to optimize operations, adjust targets, or reallocate budgets.
Advantages of Using a Real Estate KPI Scorecard in Excel
Here are some major benefits of using this Excel-based tool:
1. Simplifies Data Visualization
The dashboard converts raw numbers into easy-to-understand visuals like charts, cards, and indicators.
2. Saves Time
No more manual calculations or scattered reports. The template updates automatically with new data.
3. Customizable
You can easily add new KPIs, adjust formulas, or modify visuals to fit your unique business requirements.
4. Promotes Collaboration
With standardized data and KPI definitions, teams across departments can work together seamlessly.
5. Boosts Profitability
By monitoring metrics like occupancy rates, sales conversions, and maintenance costs, you can identify opportunities for cost optimization and revenue growth.
6. Enables Continuous Improvement
The trend analysis feature helps you establish benchmarks and pursue ongoing performance enhancement.
Opportunities for Improvement
Even though Excel-based scorecards are powerful, you can further enhance them by:
- Automating data entry using Power Query or VBA macros.
- Integrating with Power BI for advanced visualizations.
- Linking with CRM systems to import real-time data.
- Adding data validation rules to minimize manual errors.
- Using conditional formatting for more intuitive visual indicators.
Best Practices for the Real Estate KPI Scorecard in Excel
To get the best results, follow these proven best practices:
1. Choose the Right KPIs
Focus only on metrics that truly impact your business goals — avoid cluttering your dashboard with too many indicators.
2. Maintain Data Consistency
Keep consistent units, formats, and naming conventions across all sheets.
3. Review KPIs Monthly
Regularly review your performance metrics to ensure you are on track toward your targets.
4. Use Color Coding Wisely
Use traffic light indicators (green, yellow, red) to communicate performance status clearly.
5. Protect Formula Cells
Lock formula-driven cells to prevent accidental modification.
6. Ensure Version Control
If multiple users update the scorecard, maintain proper version management to avoid data duplication.
7. Backup Regularly
Store backup copies periodically, especially before making large changes or updates.
Real-World Applications of Real Estate KPI Scorecards
A Real Estate KPI Scorecard can be applied in various scenarios, including:
- Property Management Firms: Track rent collection, tenant satisfaction, and maintenance costs.
- Real Estate Developers: Monitor project progress, sales rates, and budget vs. spend.
- Commercial Real Estate: Measure occupancy, leasing performance, and client retention.
- Real Estate Agents: Track listings, conversion rates, and marketing ROI.
- Corporate Offices: Evaluate facility utilization, cost per square foot, and operational efficiency.
Example Use Case: Commercial Property Management
Imagine a commercial real estate company managing multiple office spaces across the city.
Using the Real Estate KPI Scorecard, they can:
- Track occupancy rates across different properties.
- Compare rental income vs target revenue monthly.
- Measure maintenance costs per property to identify costly locations.
- Monitor tenant satisfaction levels to improve service quality.
- Identify seasonal trends in property demand and renewals.
By combining these insights, managers can make data-backed decisions that directly improve profitability and operational efficiency.
Integrating the Scorecard with Other Tools
While Excel provides a great standalone environment, you can maximize its potential by integrating it with other tools:
- Power BI: Create interactive dashboards for web-based visualization.
- Google Sheets: Enable real-time collaboration for distributed teams.
- CRM Systems: Sync lead and sales data for better alignment.
- ERP Systems: Import cost and finance data to ensure consistent reporting.
These integrations make the scorecard more dynamic, automated, and accessible across teams.
Conclusion
A Real Estate KPI Scorecard in Excel is an essential tool for anyone serious about managing property performance with accuracy and clarity.
It provides a structured framework to measure financial, operational, and customer-related metrics — all within one easy-to-use Excel file.
By regularly updating and reviewing the scorecard, you can track goals, identify gaps, and make informed decisions that drive sustainable business growth.
Frequently Asked Questions (FAQs)
- What is a KPI in real estate?
A KPI (Key Performance Indicator) is a measurable metric that helps assess the effectiveness of real estate operations — such as occupancy rate, revenue growth, or maintenance efficiency.
- Can I customize the KPIs in this Excel Scorecard?
Yes, the template is fully customizable. You can add, remove, or modify KPIs according to your business needs.
- How often should I update the KPI data?
It’s best to update your data monthly or quarterly, depending on your business reporting cycle.
- Does this scorecard work for both commercial and residential properties?
Absolutely. You can use it for any type of real estate business, including residential, commercial, or mixed-use properties.
- Can I link this Excel scorecard to other data sources?
Yes. Using Excel Power Query or VBA, you can automate data imports from other sources like databases or CSV files.
- What are the main advantages of using Excel for KPI tracking?
Excel is accessible, flexible, and powerful. It allows easy customization, visualization, and data management without requiring expensive software.
- How can I visualize trends in KPI performance?
Use the built-in KPI Trend Sheet to track MTD and YTD progress over time using charts and comparative visuals.
- Is any technical skill required to use the template?
Not at all. The template is beginner-friendly and requires only basic Excel knowledge.
Visit our YouTube channel to learn step-by-step video tutorials
Watch the step-by-step video tutorial:
Click to buy Real Estate KPI Scorecard in Excel