In today’s fast-paced digital environment, marketing teams must measure performance accurately to stay competitive. Tracking campaigns, leads, and conversions across multiple channels can get complicated without a centralized system. This is where the Marketing KPI Scorecard in Excel becomes a powerful ally.
A Marketing KPI Scorecard helps teams organize and visualize key metrics in one place. It turns raw data into actionable insights that guide smarter decisions. Built entirely in Excel, this scorecard is both flexible and easy to maintain — perfect for marketers who want real-time performance visibility without complex tools or subscriptions.
In this article, you’ll learn everything about the Marketing KPI Scorecard in Excel — how it works, what sheets it includes, the advantages, and the best practices to follow for accurate performance tracking.
Click to buy Marketing KPI Scorecard in Excel
What Is a Marketing KPI Scorecard in Excel?
A Marketing KPI Scorecard is an Excel-based performance management tool designed to track, evaluate, and visualize marketing metrics over time. It consolidates critical KPIs such as lead generation, conversion rate, website traffic, cost per click, ROI, and campaign engagement into one structured view.
Instead of juggling multiple reports, marketing teams can use the scorecard to monitor both Month-to-Date (MTD) and Year-to-Date (YTD) performance for each KPI. With color-coded indicators and interactive dropdowns, teams can instantly identify which metrics meet targets and which require improvement.
Structure of the Marketing KPI Scorecard Template
This Excel template comes with four well-designed worksheet tabs that make performance analysis simple and dynamic.
Scorecard Sheet
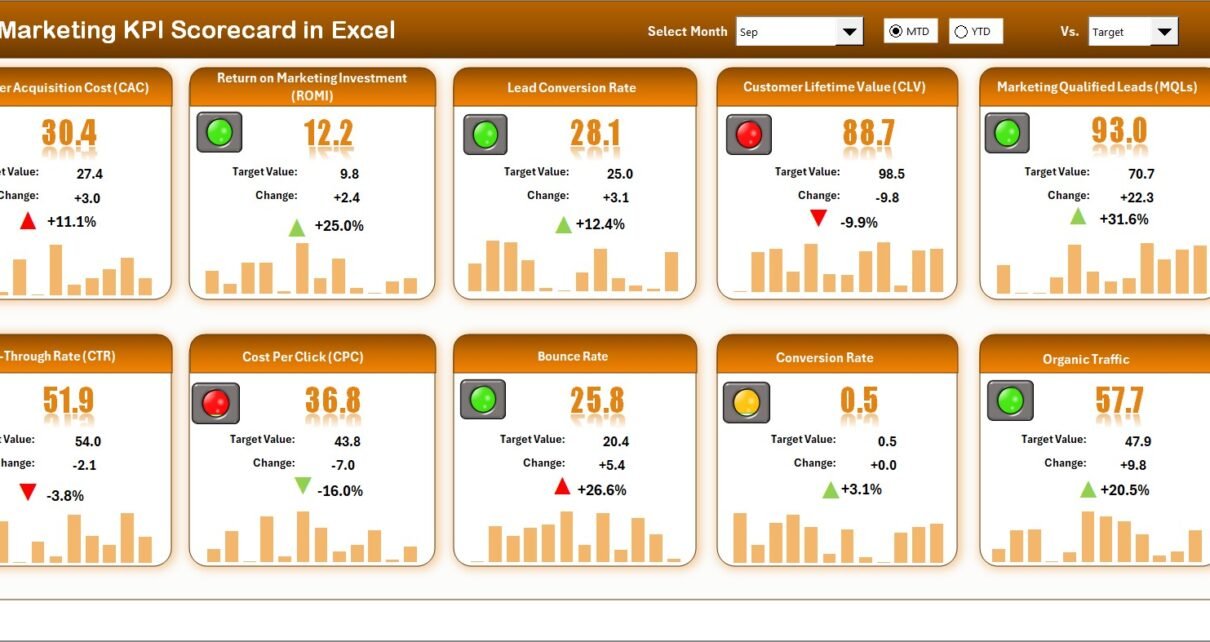
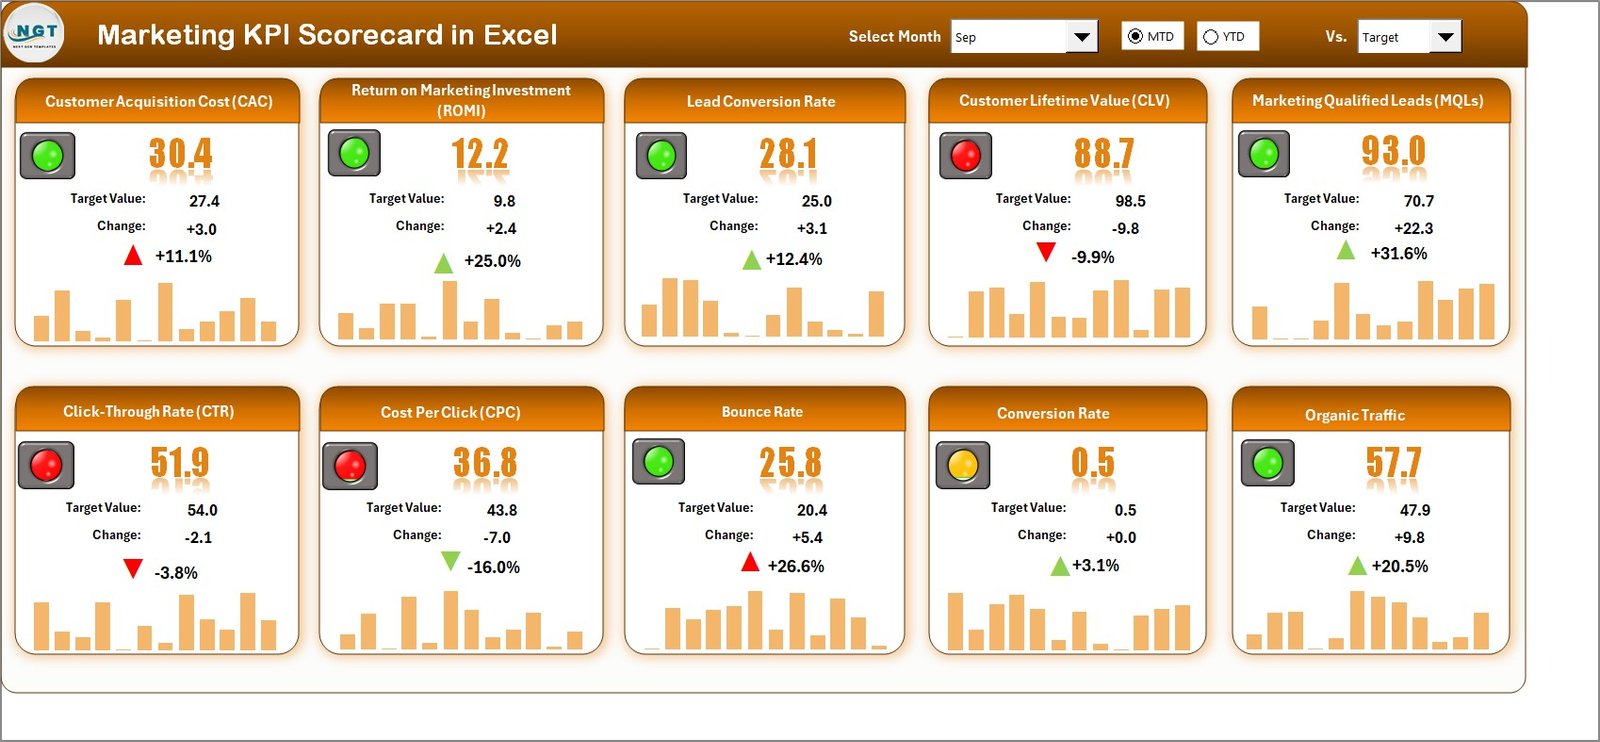
The Scorecard Sheet serves as the main interface of the dashboard. It provides a comprehensive overview of KPI performance with key features such as:
- Dropdown Menus:
Choose a specific month or time frame (MTD or YTD) to instantly view results for that period. - Actual vs Target Comparison:
See how each KPI performs against its target values with visual clarity. - Color-Coded Indicators:
Quickly identify areas of success or concern using green (on track) and red (below target) formatting. - Comprehensive KPI Display:
The scorecard presents 10 KPIs in one view, giving decision-makers instant visibility into overall marketing effectiveness.
This sheet helps marketers visualize performance at a glance — no formulas or manual charts required.
Click to buy Marketing KPI Scorecard in Excel
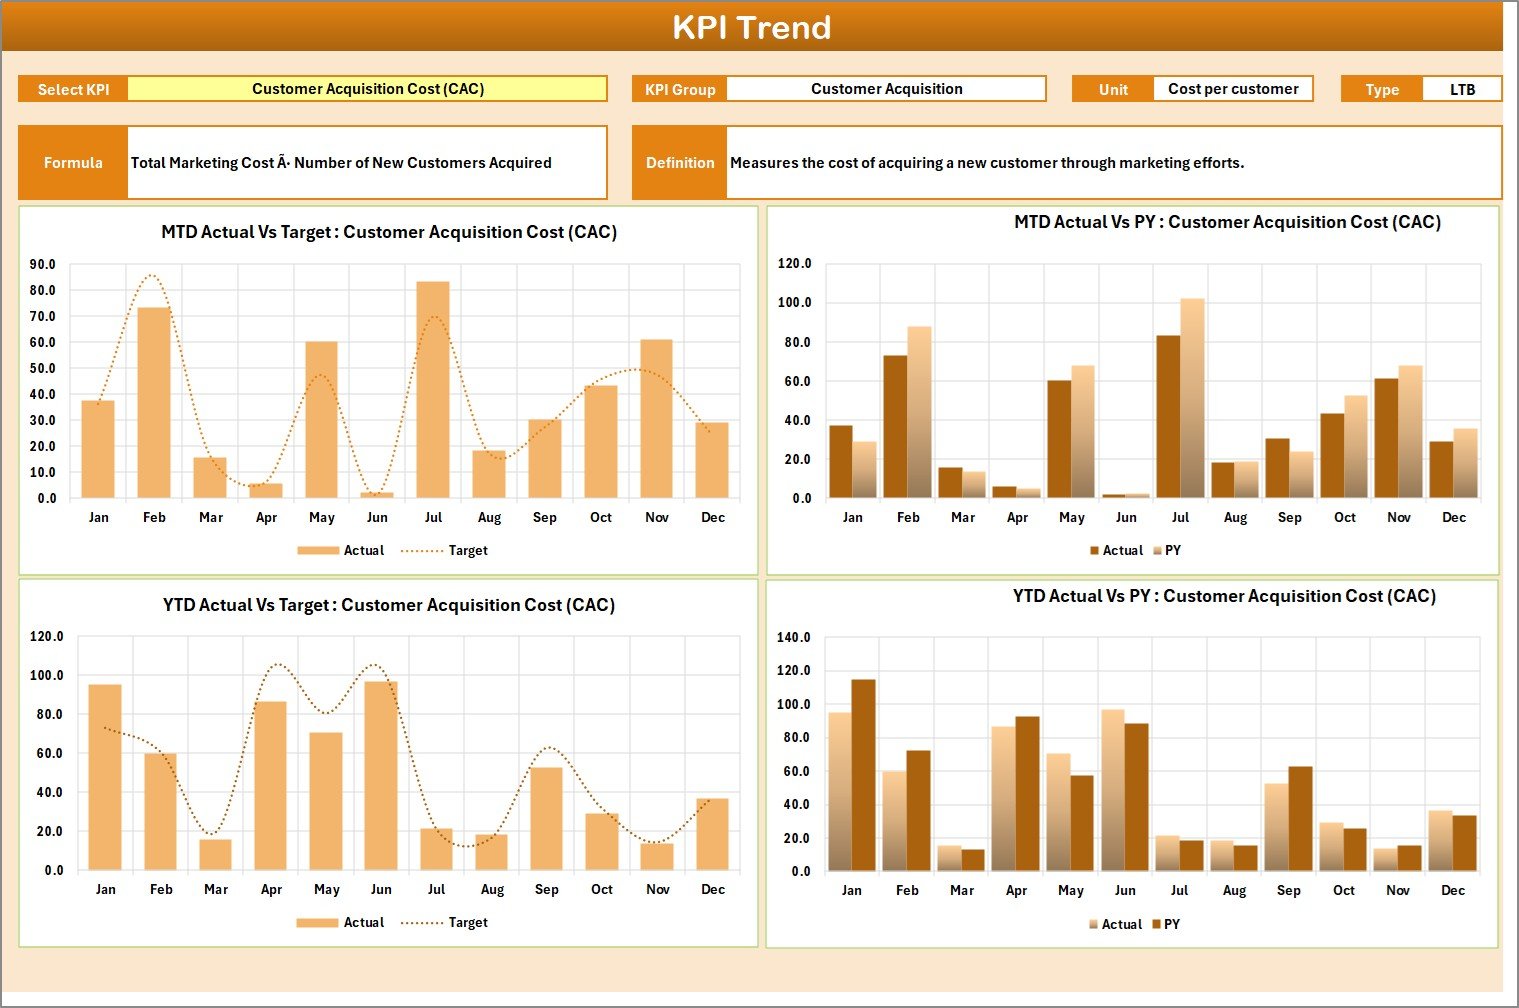
KPI Trend Sheet
The KPI Trend Sheet is designed to analyze how performance changes over time.
Key functionalities include:
- KPI Selection:
Choose any KPI from the dropdown in cell C3 to analyze its performance. - Dynamic Details:
Automatically displays KPI Group, Unit, Type (Lower-the-Better or Upper-the-Better), Formula, and Definition. - Trend Charts:
Interactive line or column charts show MTD and YTD trends for Actual, Target, and Previous Year (PY) data.
With this tab, marketing managers can visualize seasonality, campaign impact, or long-term improvements in any metric.
Click to buy Marketing KPI Scorecard in Excel
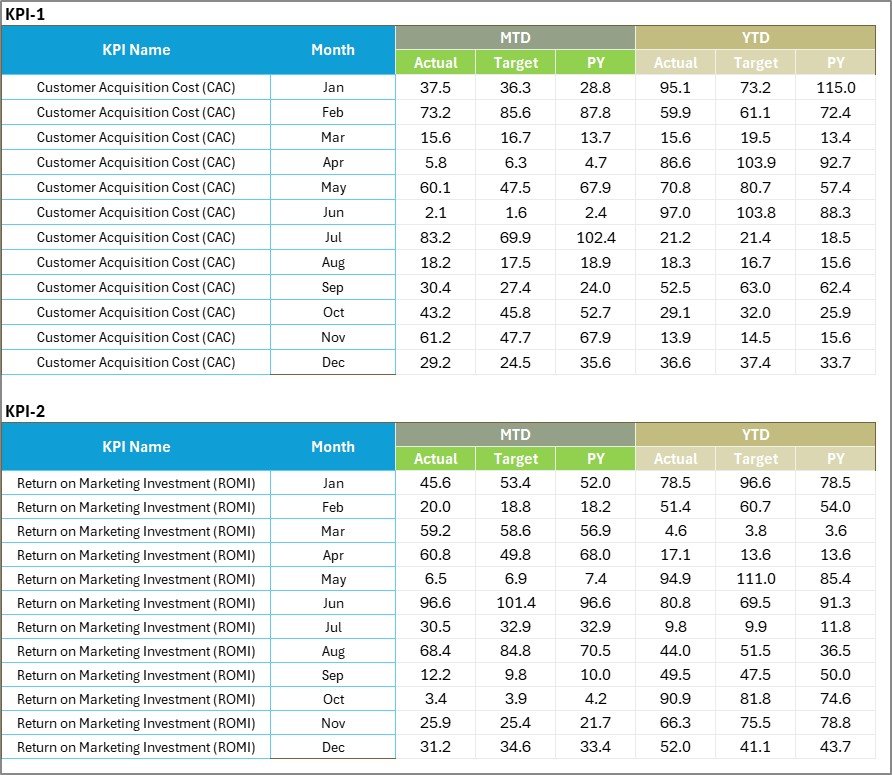
Input Data Sheet
This is the backbone of the scorecard.
In the Input Data Sheet, you enter the raw data that drives all calculations and charts.
Features include:
- Data Entry Fields:
Record KPI values for each month, including actual, target, and previous-year numbers. - Flexibility:
The sheet is designed for easy updates, ensuring your scorecard stays current and accurate. - Automation Ready:
Once the data is entered, all linked dashboards automatically update to reflect the latest figures.
This sheet ensures that every metric remains synchronized across all views.
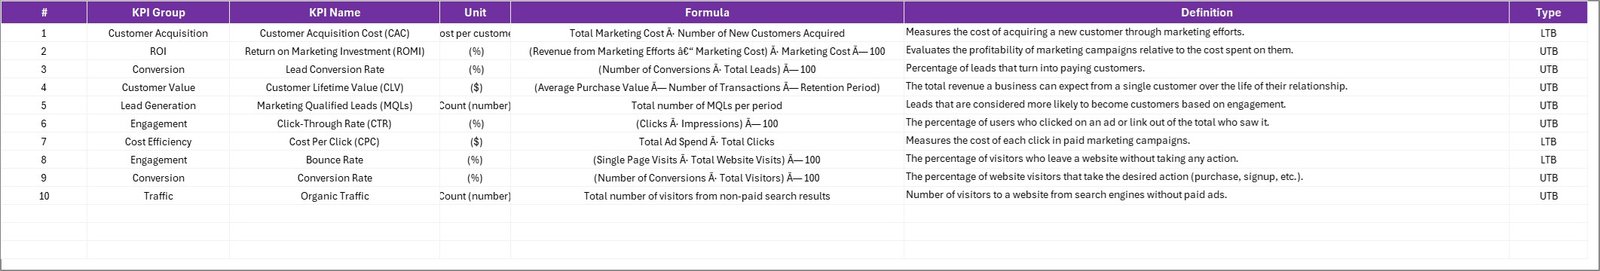
KPI Definition Sheet
The KPI Definition Sheet provides a structured database of every marketing KPI used in the scorecard.
Here, you’ll define the following for each metric:
- KPI Name
- KPI Group (e.g., Digital Marketing, Social Media, Advertising)
- Unit (%, $, Number, etc.)
- Formula (Calculation Logic)
- Definition (Short Description)
- Type (UTB or LTB)
This tab acts as a quick reference for anyone using the dashboard, ensuring consistency and understanding across the team.
Click to buy Marketing KPI Scorecard in Excel
How the Marketing KPI Scorecard Helps Teams
An Excel-based scorecard is not just about numbers — it empowers decision-making.
Here’s how it benefits marketing teams:
- Centralized Performance View – Get all KPIs in one interactive sheet.
- Real-Time Tracking – Instantly update performance data and monitor progress.
- Actionable Insights – Identify trends and problem areas faster.
- Goal Alignment – Keep every campaign aligned with organizational objectives.
- Data-Driven Decisions – Use visual data to make better marketing choices.
Advantages of a Marketing KPI Scorecard in Excel
Implementing a Marketing KPI Scorecard offers multiple advantages:
- Simplicity and Accessibility
Excel is familiar to almost every marketing professional. You don’t need special training or software to manage KPIs effectively.
- Complete Customization
You can modify formulas, KPI definitions, colors, and visuals according to your business needs.
- Real-Time Visibility
Instantly see how your campaigns perform every month with automated updates and charts.
- Cost-Effective
Unlike expensive BI tools, this Excel-based solution offers all analytical capabilities without extra costs.
- Improved Decision-Making
Quickly identify which campaigns drive ROI and which need optimization.
- Historical Analysis
Compare current performance with previous months or years using YTD data tracking.
- Enhanced Team Communication
All departments — from marketing to finance — can access and interpret results in one unified format.
How to Use the Marketing KPI Scorecard
Using this Excel tool is straightforward:
- Open the Input Data Sheet and enter all monthly data.
- Define KPIs in the KPI Definition Sheet.
- Navigate to the Scorecard Sheet to view overall performance.
- Analyze Trends in the KPI Trend tab for deeper insights.
- Adjust Targets based on the trends and insights discovered.
Within minutes, you’ll have a clear view of your marketing performance metrics.
Why Excel Is Ideal for Marketing Performance Tracking
Although there are many marketing analytics platforms, Excel remains a preferred choice because:
- It provides complete control over structure and design.
- You can easily share and collaborate within teams.
- Excel’s formulas and charts make it highly flexible for KPI analysis.
- You can import data from Google Analytics, Ads, or CRM systems directly into your sheet.
For small and mid-sized businesses, Excel is a practical and affordable solution.
Best Practices for Using the Marketing KPI Scorecard
To make the most of your scorecard, follow these proven best practices:
- Define Clear Objectives
Ensure every KPI aligns with specific marketing goals such as brand awareness, lead generation, or conversion optimization.
- Keep KPI Definitions Consistent
Use the KPI Definition Sheet to maintain clarity about how each metric is calculated and interpreted.
- Automate Data Updates
If possible, link the scorecard with your data sources (like Google Sheets or Power Query) for real-time updates.
- Review Regularly
Analyze MTD and YTD performance at least once per month to identify improvement areas quickly.
- Use Conditional Formatting Wisely
Visual cues like arrows, colors, or icons help teams instantly identify success or failure.
- Limit KPIs to What Matters
Avoid overcrowding the scorecard — focus on 10–15 high-impact metrics that align with your strategy.
- Communicate Results
Share the insights from your scorecard during team meetings or performance reviews for transparency.
- Archive Historical Data
Keep older data in a separate file to maintain performance history without slowing down your dashboard.
Opportunities for Improvement
While Excel is powerful, users can enhance the Marketing KPI Scorecard experience by:
- Integrating Power BI or Google Data Studio: For more visual dashboards.
- Automating Data Pulls: Using APIs or connectors to fetch campaign data automatically.
- Adding Forecasting Models: Predict future marketing trends using Excel’s built-in functions.
- Collaborating via Cloud Platforms: Share live scorecards through OneDrive or Google Drive.
These enhancements can elevate your performance monitoring to the next level.
Conclusion
A Marketing KPI Scorecard in Excel is a practical, cost-effective, and flexible tool for marketing professionals who need clarity and control over campaign performance. It brings together data from multiple sources into one organized, visual, and easy-to-analyze format.
With dropdown filters, trend analysis, and real-time comparisons between actual and target values, marketers can quickly identify what’s working — and what’s not. Whether you manage digital campaigns, social media, or lead generation, this Excel scorecard provides the insights you need to make smarter decisions.
If you want to streamline marketing reporting, boost transparency, and make data-driven strategies a habit — the Marketing KPI Scorecard in Excel is the perfect solution.
Frequently Asked Questions (FAQs)
- What is a Marketing KPI Scorecard in Excel?
It’s an Excel-based dashboard that tracks and visualizes key marketing performance metrics like leads, conversions, and ROI in one place.
- How many KPIs can I track using this scorecard?
The template supports around 10 KPIs per view, but you can add or remove KPIs depending on your marketing goals.
- Can I customize the KPIs in the scorecard?
Yes. You can easily modify KPI names, formulas, and targets in the KPI Definition and Input Data sheets.
- What is the difference between MTD and YTD in this scorecard?
MTD (Month-to-Date) shows current month progress, while YTD (Year-to-Date) shows cumulative performance for the year.
- Can this Excel scorecard be used for digital marketing analysis?
Absolutely. It’s ideal for tracking metrics such as website traffic, ad performance, and social media engagement.
- Is Excel suitable for KPI tracking compared to other tools?
Yes. Excel offers flexibility, affordability, and complete control — making it perfect for small to medium-sized marketing teams.
- How often should I update the Marketing KPI Scorecard?
You should update it monthly or after every major campaign for accurate and timely analysis.
- Can I create charts and visual dashboards using this scorecard?
Yes. The KPI Trend and Scorecard sheets already include built-in visuals for better data presentation.
- How can this scorecard improve decision-making?
By presenting real-time data in a structured way, it helps managers identify performance gaps and allocate resources effectively.
- Is this scorecard suitable for agencies and in-house marketing teams?
Yes. Both agencies and internal teams can use it to evaluate performance, optimize campaigns, and communicate results with clients or management.
Visit our YouTube channel to learn step-by-step video tutorials
h3>Watch the step-by-step video tutorial:
Click to buy Marketing KPI Scorecard in Excel