In today’s competitive telecom industry, customer retention is more important than ever. With multiple service providers offering similar plans, keeping existing customers satisfied and loyal is critical for profitability and growth. Measuring and analyzing key retention metrics helps telecom companies identify at-risk customers, evaluate service quality, and make data-driven improvements.
The Telecom Customer Retention KPI Dashboard in Excel provides a powerful yet easy-to-use solution for monitoring performance metrics related to customer loyalty, churn rate, complaint resolution, and service satisfaction. Built entirely in Excel, this dashboard consolidates essential KPIs into a single interactive view—helping decision-makers take timely actions to improve retention.
Click to buy Telecom Customer Retention KPI Dashboard in Excel
What Is a Telecom Customer Retention KPI Dashboard in Excel?
A Telecom Customer Retention KPI Dashboard is an analytical Excel tool designed to track and visualize the performance of key metrics that influence customer retention. It brings together multiple datasets—customer feedback, churn statistics, support response rates, and renewal trends—to give a comprehensive overview of how well the organization retains its subscribers.
This dashboard is ideal for telecom managers, analysts, and customer experience teams who want to:
- Track Monthly and Year-to-Date (MTD/YTD) performance across all KPIs
- Compare Actual vs. Target vs. Previous Year (PY) performance
- Identify problem areas using visual cues such as up/down arrows
- Monitor long-term trends in customer satisfaction and loyalty
The best part? You don’t need coding skills or complex software. Everything runs in Microsoft Excel using familiar formulas, charts, and interactive elements.
Key Features of the Telecom Customer Retention KPI Dashboard
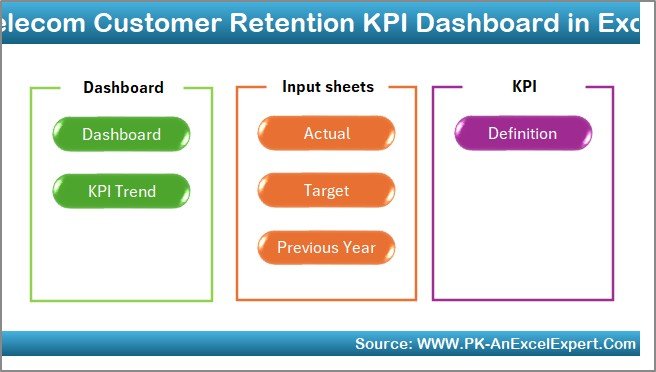
This ready-to-use Excel dashboard includes seven well-structured worksheets, each serving a specific purpose to ensure smooth data management and analysis.
Home Sheet — The Control Center
The Home Sheet serves as an intuitive navigation hub. It includes six easy-to-use buttons that allow users to jump directly to other sheets such as the Dashboard, KPI Trend, Actual Numbers Input, Target, Previous Year, and KPI Definition.
Highlights:
- Simplifies navigation
- Enhances user experience
- Ideal for both technical and non-technical users
By using the Home Sheet, users can access any part of the workbook instantly, saving time and reducing confusion.
Click to buy Telecom Customer Retention KPI Dashboard in Excel
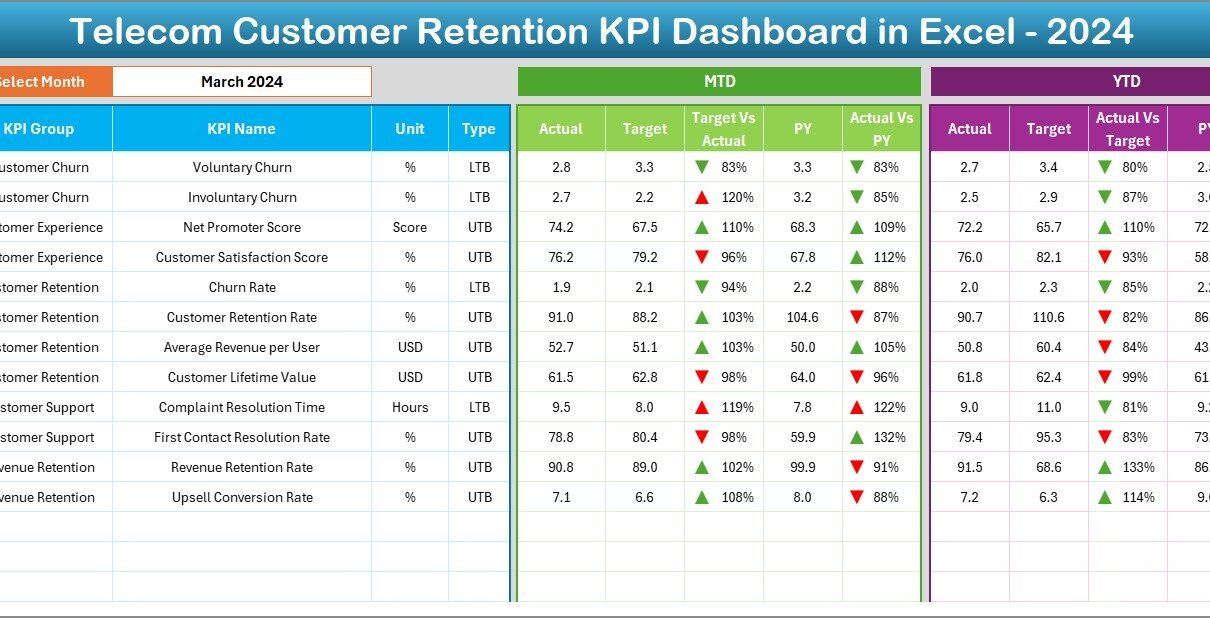
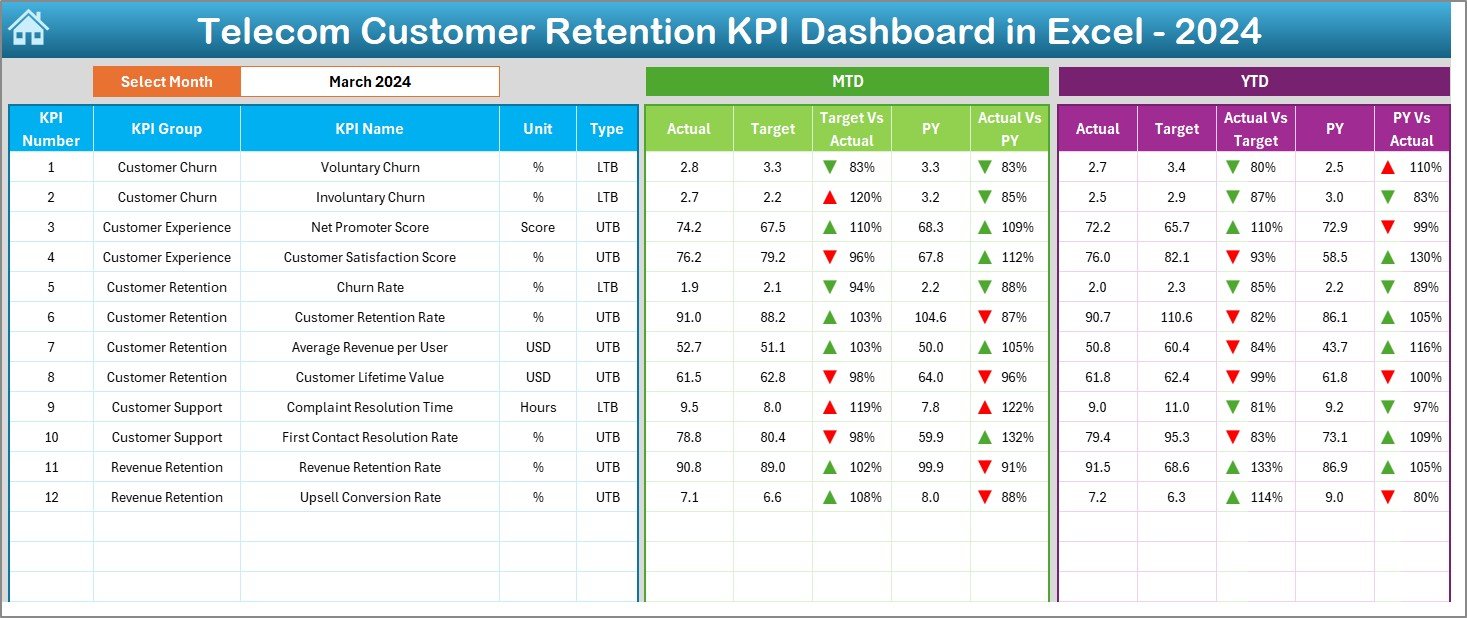
Dashboard Sheet — The Visual Performance Summary
The Dashboard Sheet is the heart of this Excel tool. It visually displays all essential KPIs related to customer retention.
On cell D3, users can select the desired month from a drop-down menu, automatically updating all visuals and data points across the sheet.
Click to buy Telecom Customer Retention KPI Dashboard in Excel
Key Functionalities:
- Displays MTD (Month-to-Date) and YTD (Year-to-Date) data
- Compares Actual vs Target vs Previous Year (PY) values
- Uses conditional formatting arrows (↑ or ↓) to indicate performance trends
- Highlights underperforming metrics in red and improving metrics in green
This sheet helps managers instantly see which KPIs are improving and which require immediate attention—making performance tracking effortless.
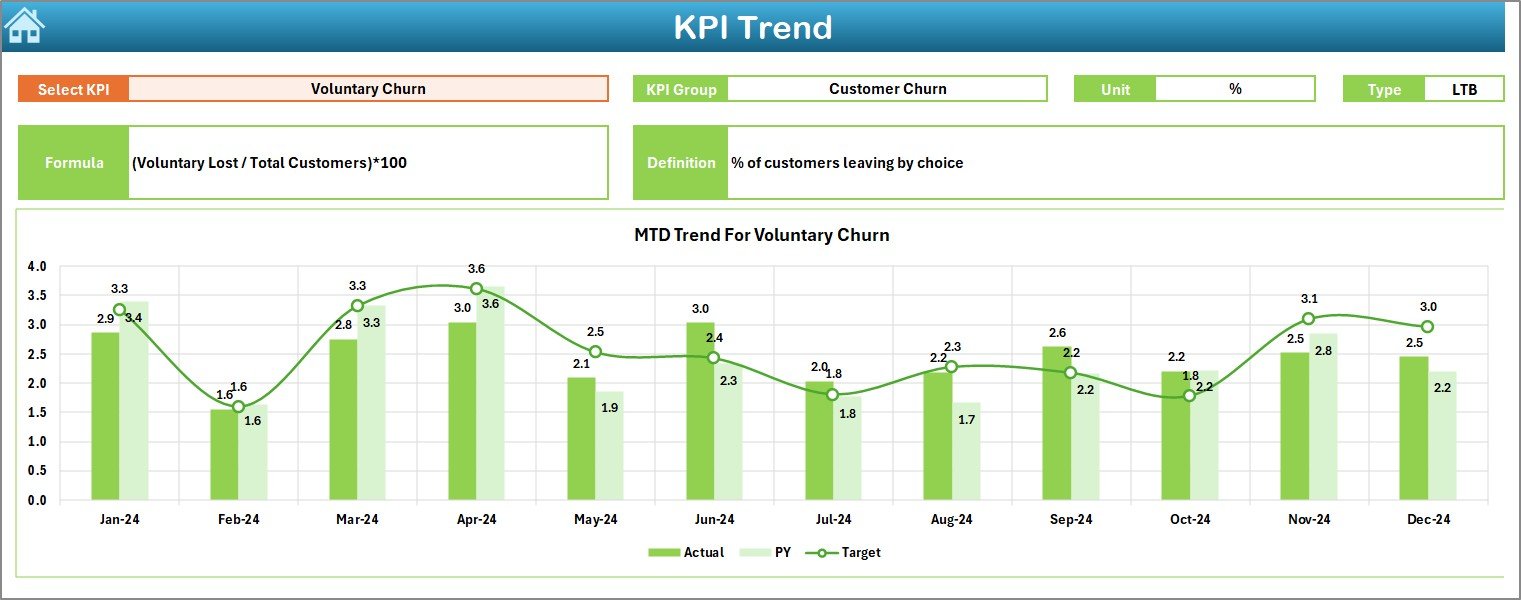
KPI Trend Sheet — The Analytical Insight Page
The KPI Trend Sheet provides an in-depth look at how each KPI behaves over time. You can choose a specific KPI from the drop-down list in cell C3.
For every KPI, the sheet displays:
- KPI Group
- Unit of Measurement
- Type (UTB – Upper the Better, or LTB – Lower the Better)
- Formula
- Definition
It also includes MTD and YTD trend charts comparing Actual, Target, and Previous Year data. These trend charts help identify whether customer satisfaction, retention rate, or complaint resolution times are improving or declining month over month.
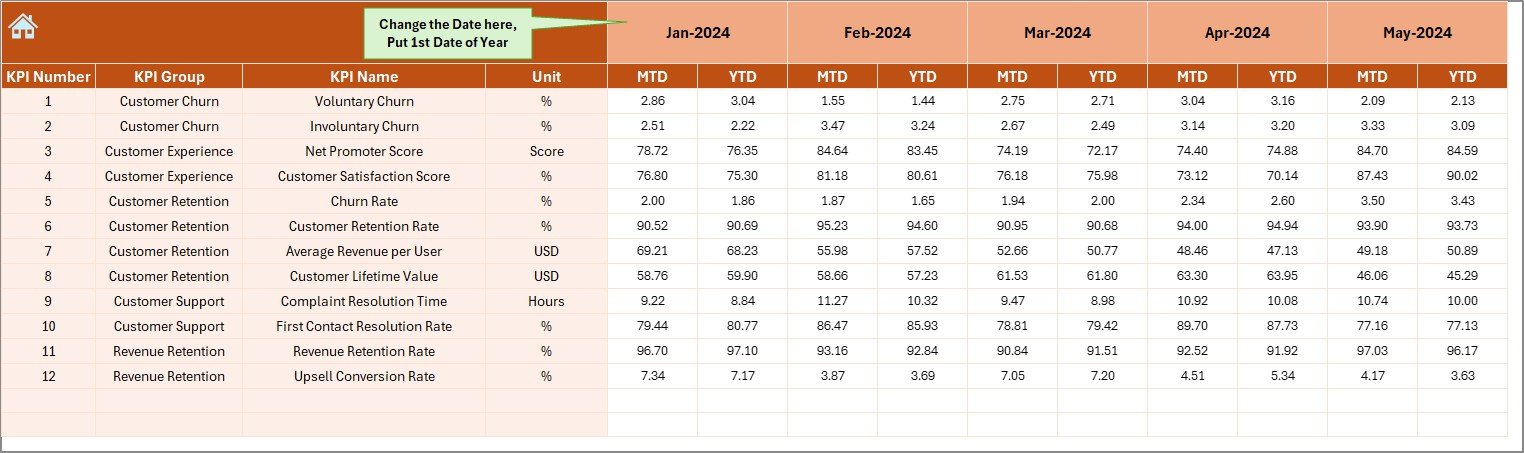
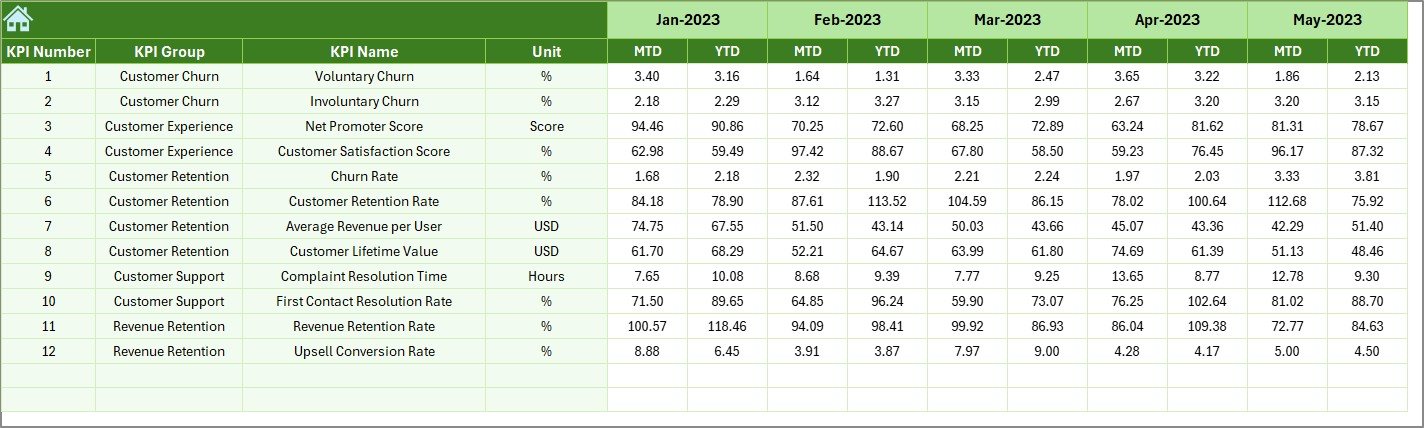
Actual Numbers Input Sheet — Record Real-World Data
The Actual Numbers Input Sheet is where you input the real performance figures for each month. This sheet accepts both MTD and YTD data for every KPI.
Key Details:
- Use cell E1 to enter the first month of the fiscal year
- Automatically adjusts columns and calculations based on your input
- Designed for fast data entry and easy updates
For example, if January 2024 is entered in cell E1, all monthly columns from January to December 2024 automatically appear, ready for input. This structure ensures that data entry stays consistent and error-free.
Click to buy Telecom Customer Retention KPI Dashboard in Excel
Target Sheet — Set Goals for the Year
The Target Sheet lets you define monthly and yearly targets for every KPI. Clear targets make performance comparison meaningful.
Benefits of Target Tracking:
- Enables clear goal setting for teams
- Helps evaluate progress in real time
- Encourages accountability among departments
Targets for MTD and YTD data ensure both short-term and long-term focus. For example, if your goal is to reduce churn by 5% monthly, you can easily monitor actual performance against this target.
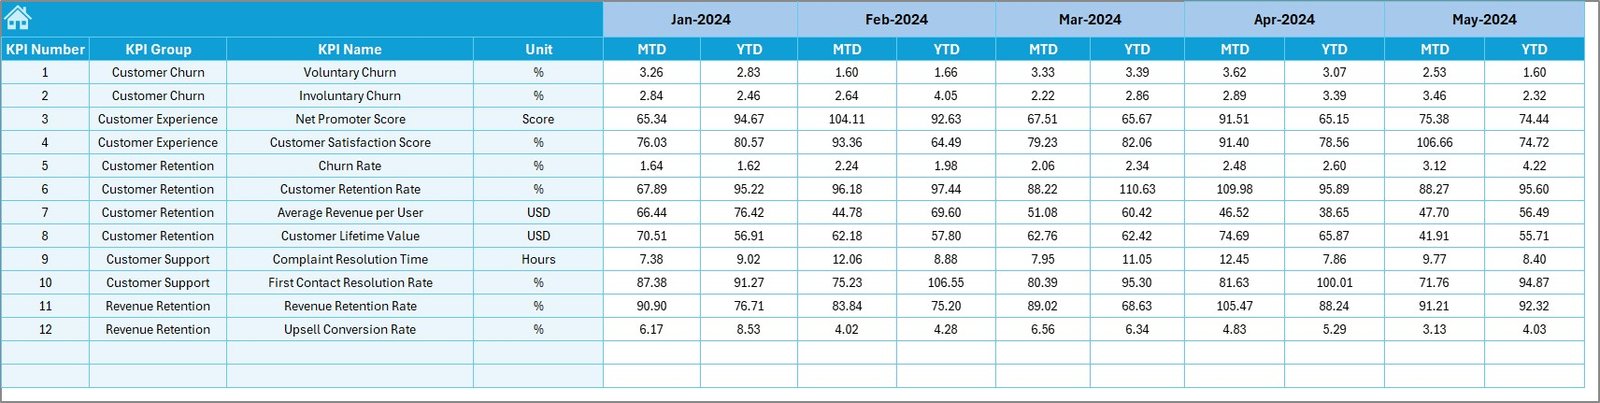
Previous Year Numbers Sheet — Analyze Year-Over-Year Trends
Understanding past performance is vital for forecasting and strategy. The Previous Year Sheet stores MTD and YTD data from the prior year.
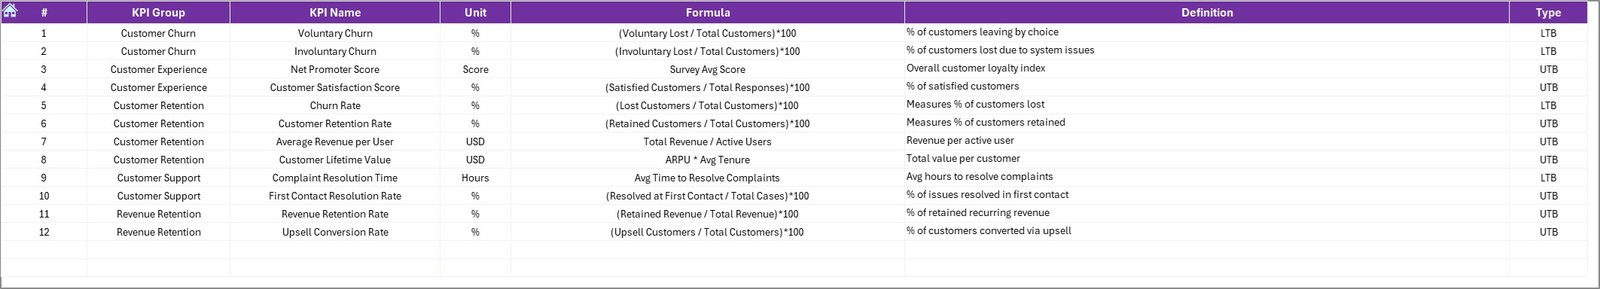
KPI Definition Sheet — Maintain Clarity
The KPI Definition Sheet provides a detailed list of all KPIs used in the dashboard. Each KPI entry includes:
- KPI Name
- KPI Group
- Unit
- Formula
- Definition
This ensures every stakeholder understands what each metric means and how it’s calculated—avoiding confusion and improving data accuracy.
Click to buy Telecom Customer Retention KPI Dashboard in Excel
Why Use Excel for Customer Retention Analysis?
While there are many analytics tools available, Excel remains a favorite for many professionals due to its flexibility and accessibility.
Advantages of Excel for Dashboards:
- No subscription or external software needed
- Easy data import/export capabilities
- Highly customizable charts and visuals
- Ideal for small to medium-sized businesses
- Secure, offline data handling
With Excel, teams can control every aspect of the dashboard—from design to data structure—without needing expensive BI tools.
Advantages of the Telecom Customer Retention KPI Dashboard in Excel
This dashboard offers numerous benefits for telecom businesses aiming to improve retention rates and overall customer satisfaction.
Centralized Data Management
All customer retention KPIs are stored and analyzed in one place, reducing manual effort and eliminating data silos.
Real-Time Performance Tracking
Instantly view how the organization performs against targets using dynamic drop-downs and visual cues.
Data-Driven Decision Making
Charts and comparison visuals highlight areas that need improvement, empowering managers to make quick, informed decisions.
Improved Accountability
Each department can track its own KPIs, fostering a performance-driven culture and better teamwork.
Easy to Customize
Users can add or remove KPIs, modify targets, and adjust visuals according to business needs without technical help.
Enhanced Trend Analysis
The KPI Trend Sheet makes it easy to visualize changes across months or years, helping forecast future trends.
Best Practices for Using the Telecom Customer Retention Dashboard
To maximize the value of your dashboard, follow these proven best practices:
1. Update Data Monthly
Keep both actual and target numbers updated each month to ensure accuracy and relevance.
2. Set Realistic Targets
Targets should be ambitious yet achievable. Unrealistic goals can lead to frustration and inaccurate assessments.
3. Review KPI Definitions Regularly
Ensure that KPI formulas and definitions align with evolving business objectives.
4. Use Conditional Formatting Smartly
Visual indicators (green for good, red for poor) help interpret data quickly. Don’t overuse colors—keep visuals clean.
5. Analyze Trends, Not Just Monthly Values
Look at year-to-date and previous-year comparisons to understand long-term patterns.
6. Involve All Stakeholders
Share the dashboard with customer service, marketing, and finance teams to get a complete view of retention performance.
7. Automate Where Possible
Use Excel formulas, named ranges, and dynamic charts to reduce manual updates.
8. Back Up Historical Data
Maintain historical sheets to preserve long-term trend data for future reference.
How This Dashboard Improves Customer Retention
The dashboard helps telecom organizations improve retention by focusing on three critical areas:
- Early Detection of Churn – Identifies when customers start disengaging based on churn or complaint patterns.
- Proactive Customer Engagement – Helps target retention campaigns by understanding which customer segments are most at risk.
- Operational Efficiency – Highlights service bottlenecks and delays in resolving customer issues.
Together, these insights allow telecom companies to take action before customer dissatisfaction turns into churn.
Conclusion
The Telecom Customer Retention KPI Dashboard in Excel is more than just a reporting tool—it’s a comprehensive performance management solution. By integrating actual, target, and historical data into one visual platform, it empowers telecom professionals to monitor progress, identify challenges, and take action promptly.
Its simplicity, flexibility, and analytical depth make it an essential tool for any telecom organization focused on improving customer loyalty and reducing churn. Whether you’re a manager, analyst, or executive, this Excel dashboard can help you make informed, strategic decisions.
Frequently Asked Questions (FAQs)
- What is the purpose of a Telecom Customer Retention KPI Dashboard?
It helps telecom companies track and analyze metrics like churn rate, customer satisfaction, and complaint resolution to improve retention.
- Who can use this dashboard?
Customer experience managers, analysts, marketing teams, and operations executives in telecom organizations can use it effectively.
- Does it require any technical skills?
No. It’s fully built in Microsoft Excel with formulas and drop-downs, so no coding or advanced software is needed.
- Can I add more KPIs to this dashboard?
Yes, the dashboard is fully customizable. You can add more KPIs, modify formulas, or include additional visuals based on your requirements.
- How often should I update the dashboard?
You should update it every month with actual and target data to ensure the insights remain current and accurate.
- Can it be used for different telecom divisions?
Yes. It’s suitable for mobile, broadband, and enterprise divisions—just adjust KPIs to match each area’s retention goals.
- What are the key metrics to start with?
Begin with churn rate, retention rate, complaint resolution time, ARPU, and customer satisfaction score.
Visit our YouTube channel to learn step-by-step video tutorials
Watch the step-by-step video tutorial:
Click to buy Telecom Customer Retention KPI Dashboard in Excel