Managing performance across shipping operations, logistics, and port management can be challenging without the right tools. The Maritime KPI Scorecard in Excel solves this problem with a structured and visual approach to monitor key performance indicators (KPIs) for your maritime business.
Whether you manage fleet operations, shipping logistics, or marine safety compliance, this Excel-based scorecard helps you measure efficiency, identify gaps, and make data-driven decisions with confidence.
In this article, we’ll explore everything about the Maritime KPI Scorecard in Excel — including its structure, features, benefits, setup process, and best practices. By the end, you’ll have a clear understanding of how to use it to improve operational performance and profitability.
Click to buy Maritime KPI Scorecard in Excel
What Is a Maritime KPI Scorecard in Excel?
A Maritime KPI Scorecard in Excel is a performance tracking tool designed for professionals and companies in the maritime industry. It helps you record, monitor, and analyze KPIs such as fuel efficiency, vessel turnaround time, cargo volume, on-time delivery, and operational costs.
The template offers a structured format that allows you to compare Actual vs Target performance, analyze trends over time, and visualize results using dynamic charts and color-coded indicators.
Instead of using complex software or multiple spreadsheets, this Excel-based scorecard centralizes all maritime performance data in one interactive file — making it easier to interpret results, generate insights, and plan improvements.
Why Do Maritime Companies Need a KPI Scorecard?
Maritime operations involve multiple departments — such as fleet management, maintenance, logistics, safety, and port operations — each with unique KPIs. Without a centralized monitoring tool, performance tracking becomes inconsistent and time-consuming.
Here’s why every maritime organization needs a KPI scorecard:
- Centralized Data Monitoring: All key performance indicators are recorded and displayed in one Excel dashboard.
- Real-Time Visibility: Managers can view performance status by month or year-to-date (YTD).
- Quick Decision-Making: Identify which KPIs are meeting targets and which need attention.
- Improved Accountability: Assign clear ownership to departments or teams responsible for each KPI.
- Simplified Reporting: Generate reports instantly for management reviews or operational audits.
Key Features of the Maritime KPI Scorecard in Excel
This ready-to-use Excel template comes with four structured worksheets, each serving a unique function to make performance tracking efficient and transparent.
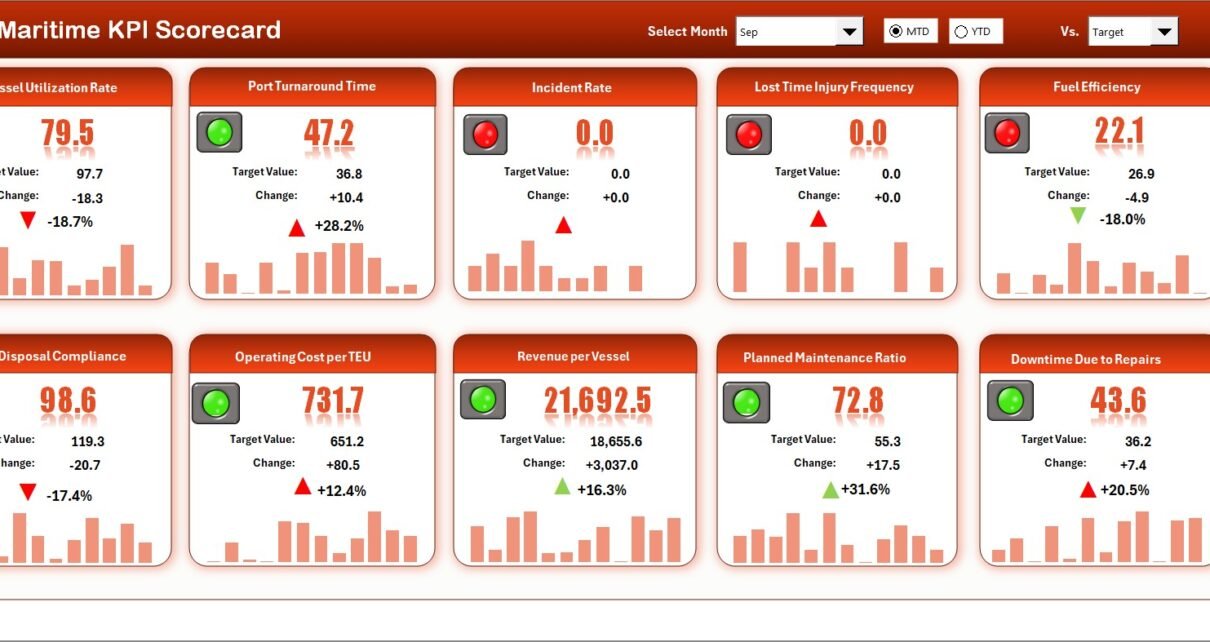
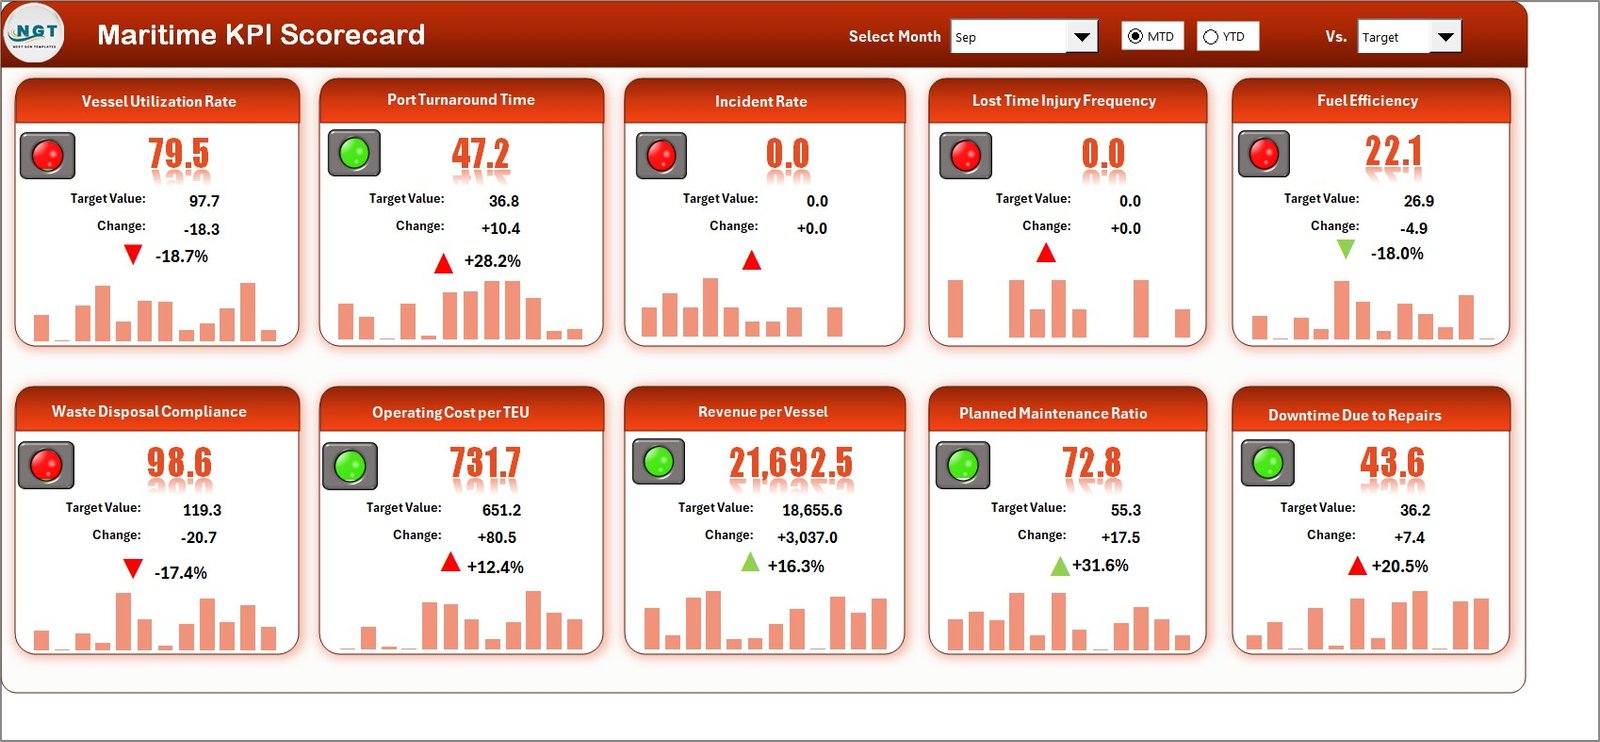
Scorecard Sheet (Main Dashboard)
The Scorecard Sheet is the core of the template — it provides a clean, visual interface to review performance at a glance.
Key Highlights:
- Dropdown Menus: Choose the reporting period such as Month, MTD (Month-to-Date), or YTD (Year-to-Date).
- Actual vs Target Comparison: View side-by-side values for every KPI.
- Visual Indicators: Automatic color-coded signals (green, yellow, red) instantly show performance levels.
- Comprehensive KPI Overview: Access up to 10 KPIs in one view, ensuring clarity across different metrics.
- Dynamic Updates: When data changes in the input sheet, the dashboard updates automatically.
This sheet acts as your command center — you can instantly identify top-performing KPIs and those needing attention.
Click to buy Maritime KPI Scorecard in Excel
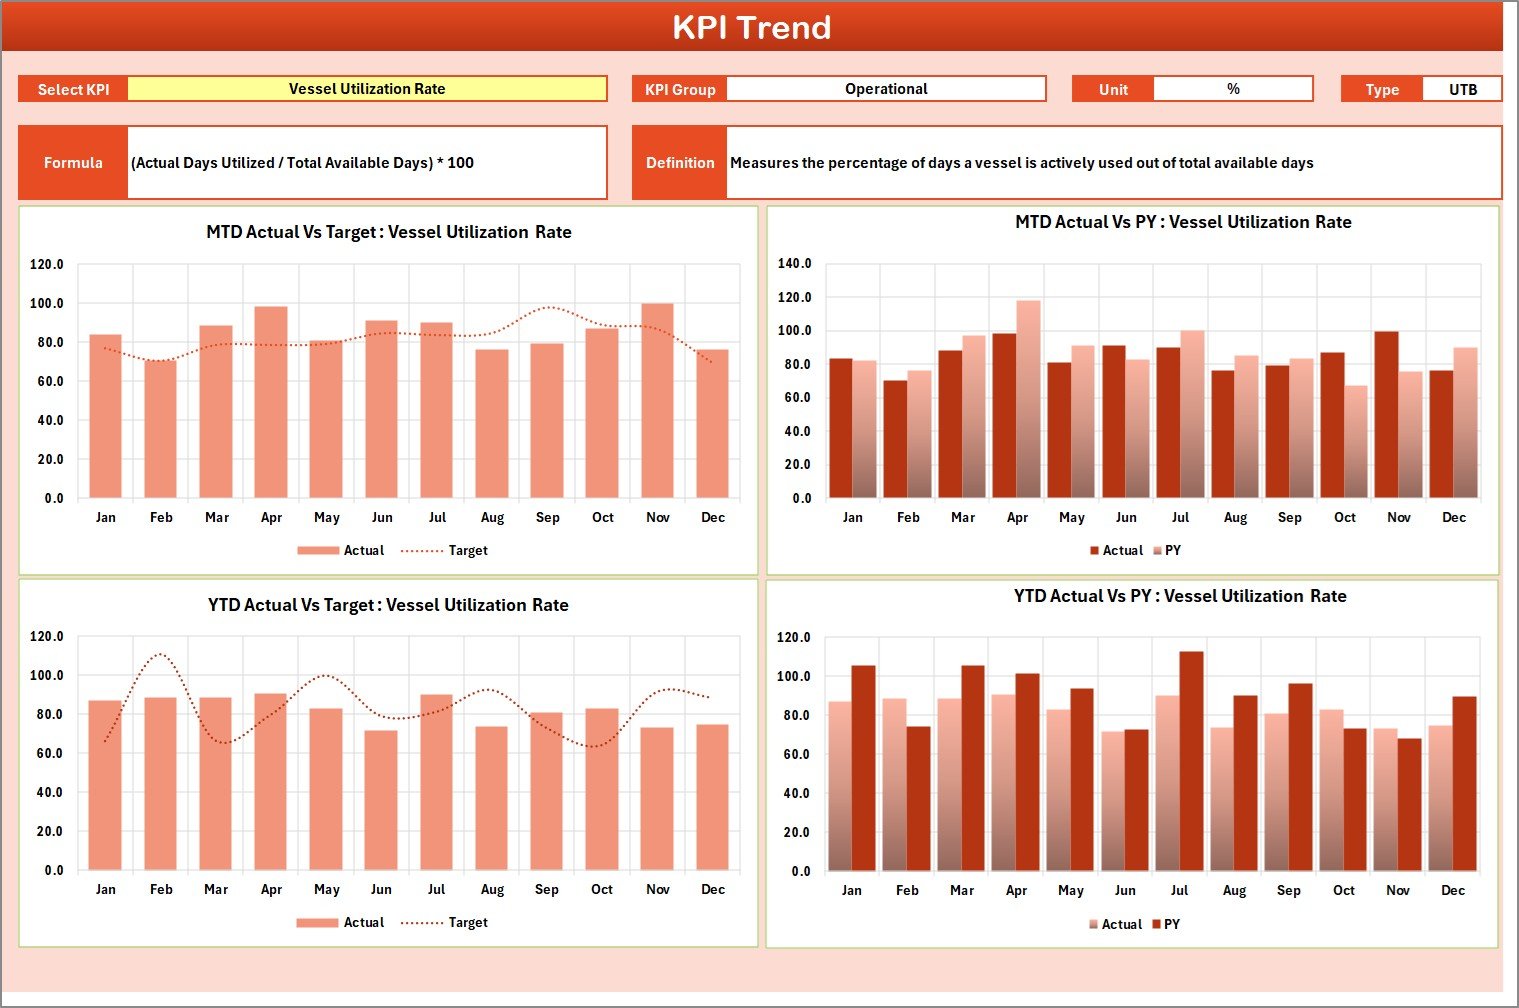
KPI Trend Sheet
The KPI Trend Sheet offers in-depth performance analysis for individual KPIs.
Here’s what it includes:
- KPI Name Selection (Dropdown in Cell C3): Choose any KPI to analyze.
- Details Displayed: The system automatically shows KPI Group, Unit, Type (LTB/UTB), Formula, and Definition.
- Performance Trends: Visual charts display Actual, Target, and Previous Year (PY) values for both MTD and YTD.
- Historical Tracking: See how performance evolves over time and detect patterns.
This sheet helps analysts and managers focus on one KPI at a time for root-cause analysis and trend visualization.
Click to buy Maritime KPI Scorecard in Excel
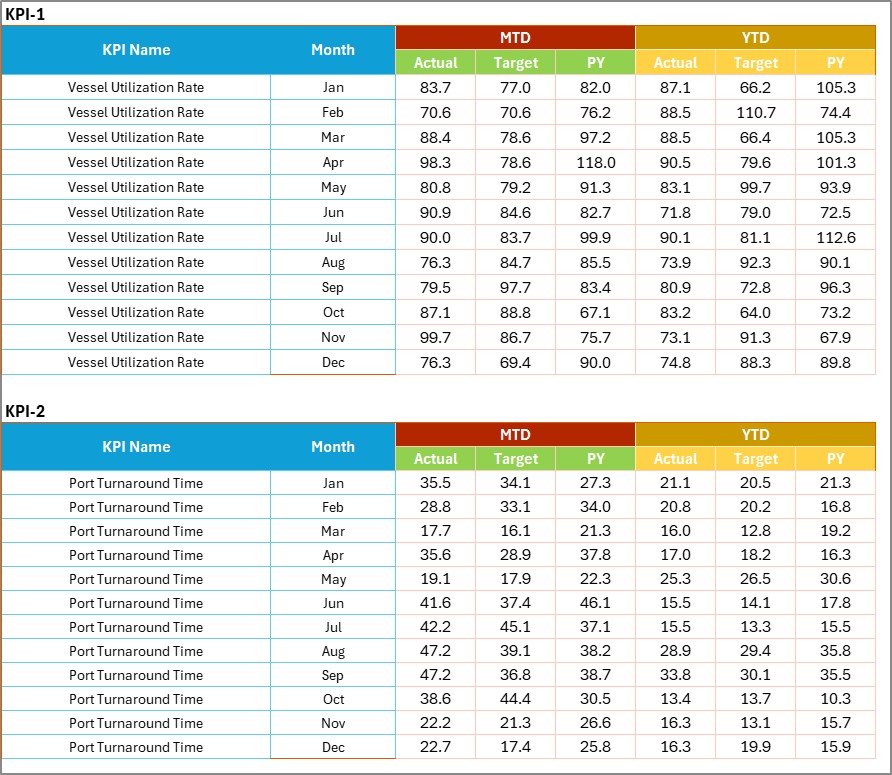
The Input Data Sheet serves as the backbone of the entire scorecard.
Features include:
- Data Entry Section: Record actual and target values for each KPI by month.
- Editable Structure: Add or modify KPI values easily as new data becomes available.
- Automation Ready: The formulas are prelinked to automatically reflect changes in the Scorecard and Trend sheets.
- Error-Proof Design: Conditional formatting ensures that missing data or incorrect entries stand out.
It’s designed to make data management smooth, accurate, and efficient for any team member.
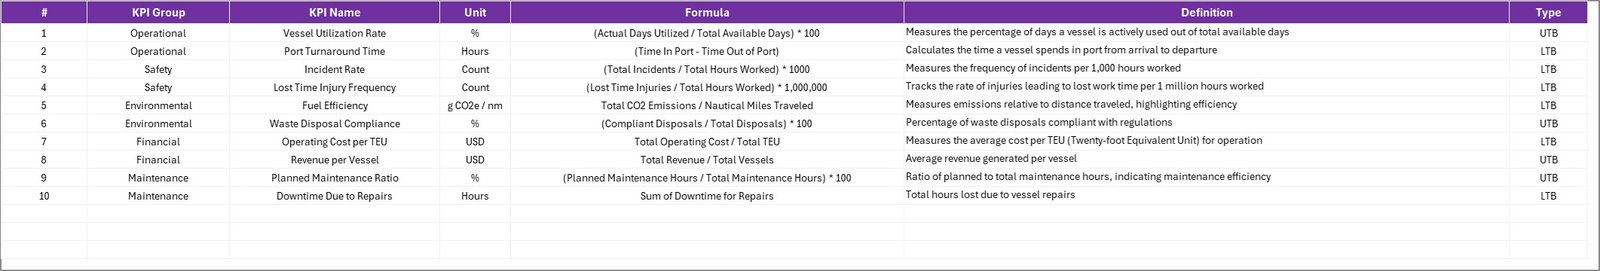
KPI Definition Sheet
This sheet documents the meaning and calculation method of every KPI.
You can record:
- KPI Name
- KPI Group (such as Operations, Safety, Logistics, Maintenance, etc.)
- Unit of Measurement
- Formula
- Definition
This documentation ensures consistency across departments and helps new team members quickly understand the performance criteria.
Click to buy Maritime KPI Scorecard in Excel
How to Use the Maritime KPI Scorecard in Excel
Implementing the scorecard is simple and intuitive, even for beginners.
Step 1: Define Your KPIs
List down the critical performance indicators for your operations — such as:
- Vessel Turnaround Time
- Cargo Throughput
- Fuel Consumption Rate
- On-Time Departure Percentage
- Equipment Downtime
- Maintenance Cost per Vessel
- Crew Training Hours
Step 2: Enter KPI Details
Go to the KPI Definition Sheet and input each KPI’s details — name, group, unit, formula, and definition.
Step 3: Add Monthly Data
Open the Input Data Sheet and record the actual and target values for each month. You can also include last year’s data for comparison.
Step 4: Analyze Performance
Switch to the Scorecard Sheet to review overall performance.
Use dropdowns to toggle between MTD and YTD views, and observe whether KPIs meet or miss their targets.
Step 5: Dive Deeper
Head to the KPI Trend Sheet to view detailed trend charts and spot monthly or yearly patterns.
This process ensures that your maritime operations stay on track — with real-time visibility and accurate metrics.
Advantages of Using the Maritime KPI Scorecard in Excel
The Maritime KPI Scorecard brings structure, clarity, and data-driven efficiency to your operations. Here are the top advantages:
- Simplifies Performance Management
It centralizes all KPI tracking in one place, reducing manual effort and errors.
- Improves Decision-Making
Real-time insights help management take quick, informed actions to improve performance.
- Enhances Communication
Visual reports and color codes make it easy to explain results in meetings and presentations.
- Ensures Accountability
Each KPI can be linked to a specific team or department, promoting ownership.
- Saves Time and Cost
Since it’s Excel-based, you don’t need additional software or subscriptions.
- Scalable and Flexible
Easily customize KPIs, formulas, and visuals to suit your company’s unique needs.
- Ideal for Reporting
Export graphs or entire scorecards into PowerPoint or PDF for management review meetings.
Visual Indicators and Performance Colors
Visuals are a key component of the scorecard. They make data easier to understand.
- Green: KPI has met or exceeded the target.
- Yellow: KPI is close to the target but needs improvement.
- Red: KPI has missed the target by a significant margin.
These color cues make it possible to assess performance within seconds, even during high-level meetings.
How Does the Scorecard Help Maritime Professionals?
The Maritime KPI Scorecard is designed for all stakeholders in the maritime industry — including:
- Fleet Managers: Track operational performance across vessels.
- Port Authorities: Monitor throughput, service times, and logistics.
- Marine Engineers: Analyze maintenance performance.
- Safety Officers: Ensure compliance with safety KPIs.
- Finance Teams: Review costs, margins, and profitability KPIs.
By integrating performance data across functions, the scorecard encourages collaboration and strategic alignment.
Best Pactices for Using the Maritime KPI Scorecard in Excel
To get the most from your scorecard, follow these expert recommendations:
- Keep KPIs Limited and Focused
Track only those KPIs that directly affect operational performance. Avoid cluttering the dashboard.
- Update Data Regularly
Refresh data monthly or weekly to ensure timely insights and avoid outdated analysis.
- Use Clear KPI Definitions
Maintain consistency by ensuring everyone understands how each KPI is calculated.
- Benchmark Against Industry Standards
Compare your performance with global maritime benchmarks to stay competitive.
- Automate Where Possible
Use formulas, conditional formatting, and Excel automation (VBA or Power Query) to reduce manual effort.
- Review Trends, Not Just Numbers
The trend sheet provides context — helping you identify gradual improvements or declines.
- Encourage Team Ownership
Assign specific KPIs to departments and review them in monthly performance meetings.
- Protect Data Integrity
Lock formula cells and protect sheets to prevent accidental edits or data manipulation.
Tips for Customizing the Maritime KPI Scorecard
- Rename KPI Groups (e.g., “Fleet Operations,” “Marine Safety”).
- Add company branding, logos, and color themes.
- Include slicers or filters for department, vessel, or route.
- Add a summary card showing “% of KPIs On Track.”
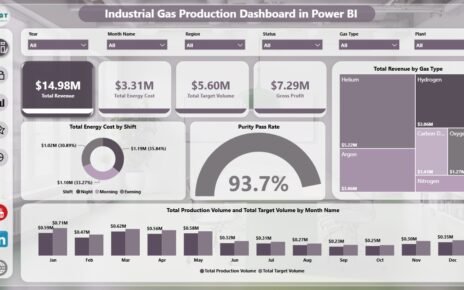
- Integrate with Power BI for enhanced visualization.
These customizations make the scorecard not just functional but also visually appealing and company-specific.
Conclusion
The Maritime KPI Scorecard in Excel is more than just a reporting template — it’s a strategic management tool that brings transparency, accountability, and efficiency to maritime operations.
By combining interactive visuals, data automation, and structured KPI tracking, it enables shipping companies, ports, and marine organizations to monitor their performance effortlessly.
If you’re aiming to enhance decision-making, reduce inefficiencies, and create a performance-driven culture in your maritime business, this Excel scorecard is the perfect solution to start with.
Frequently Asked Questions (FAQs)
- What is the purpose of a Maritime KPI Scorecard?
The purpose is to monitor and evaluate the performance of maritime operations using measurable KPIs related to safety, logistics, fuel efficiency, and financial outcomes.
- Can I customize the KPIs in the Excel scorecard?
Yes, the scorecard is fully customizable. You can add or remove KPIs, modify formulas, and rename KPI groups based on your organizational needs.
- Does the template require advanced Excel knowledge?
No, it’s user-friendly and designed with prebuilt formulas and dropdowns. Even basic Excel users can operate it easily.
- How often should I update the KPI data?
It’s best to update the Input Data Sheet monthly to ensure that the MTD and YTD analyses remain accurate and relevant.
- Can I connect this Excel scorecard to Power BI?
Yes, you can link it to Power BI for advanced visualizations and automated data refresh features.
- What kind of organizations can use this template?
It’s suitable for shipping companies, logistics providers, port authorities, and marine service firms.
- How does it improve decision-making?
By presenting real-time performance visuals, management can easily identify problem areas and act before issues escalate.
- Is there a mobile version of this tool?
You can use it on Excel Online or through OneDrive to access it on mobile devices.
- Can multiple users work on the same file?
Yes, when shared via cloud platforms like OneDrive or Google Drive, multiple team members can collaborate simultaneously.
- Why choose Excel instead of specialized software?
Excel offers affordability, flexibility, and complete control over customization without needing expensive enterprise tools.
Visit our YouTube channel to learn step-by-step video tutorials
Watch the step-by-step video tutorial:
Click to buy Maritime KPI Scorecard in Excel