In today’s competitive retail environment, understanding and optimizing profit margins is crucial for sustainable growth. Businesses that rely solely on manual spreadsheets or fragmented reports often struggle to identify where profits are gained or lost. The Retail Profit Margin KPI Dashboard in Power BI provides a modern solution — a dynamic, interactive tool that empowers retailers to track, visualize, and analyze profit performance with precision.
This article explores everything you need to know about the Retail Profit Margin KPI Dashboard in Power BI — from its structure and data integration to its advantages, best practices, and implementation tips.
Click to buy Retail Profit Margin KPI Dashboard in Power BI
What Is a Retail Profit Margin KPI Dashboard in Power BI?
A Retail Profit Margin KPI Dashboard in Power BI is an analytical visualization tool designed to monitor and evaluate profitability performance across different retail segments, product lines, and time periods.
Using Power BI, this dashboard transforms raw Excel data into insightful visuals that help decision-makers monitor key profit-related metrics such as:
- Gross Profit Margin (%)
- Net Profit Margin (%)
- Cost of Goods Sold (COGS)
- Total Revenue
- Operating Expenses
- Profit Growth vs. Targets
- Month-to-Date (MTD) and Year-to-Date (YTD) comparisons
Instead of manually compiling reports, managers can access real-time performance insights that guide strategic pricing, cost control, and operational decisions.
Click to buy Retail Profit Margin KPI Dashboard in Power BI
Structure of the Dashboard
The Retail Profit Margin KPI Dashboard in Power BI includes three interactive pages that collectively provide a 360-degree view of retail profitability.
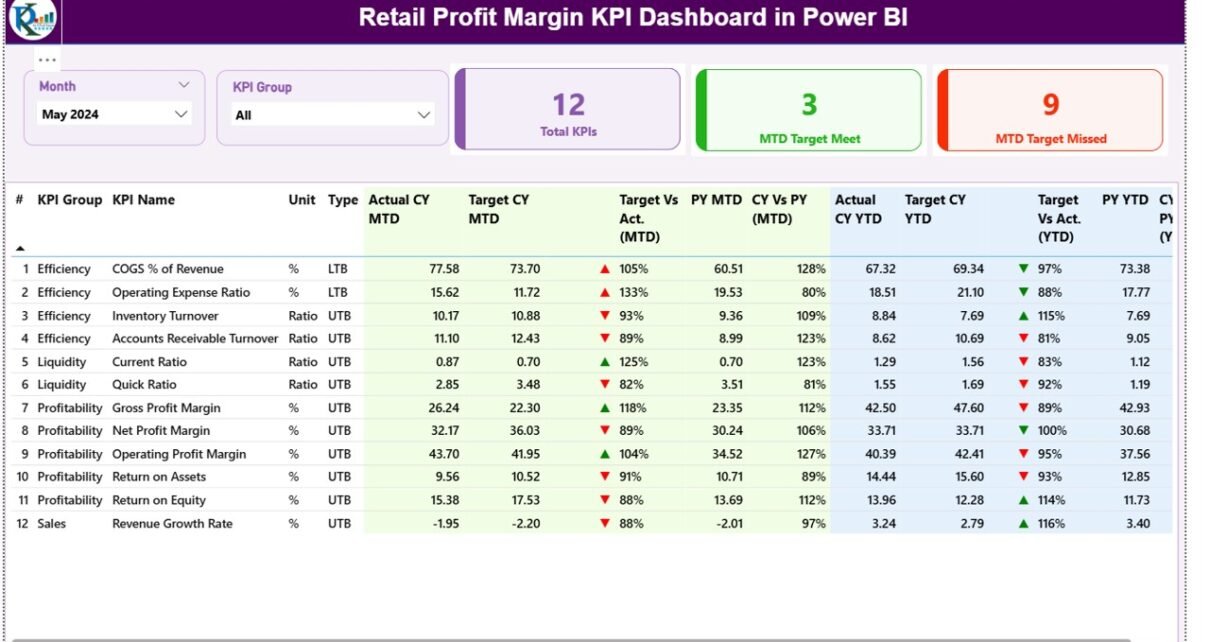
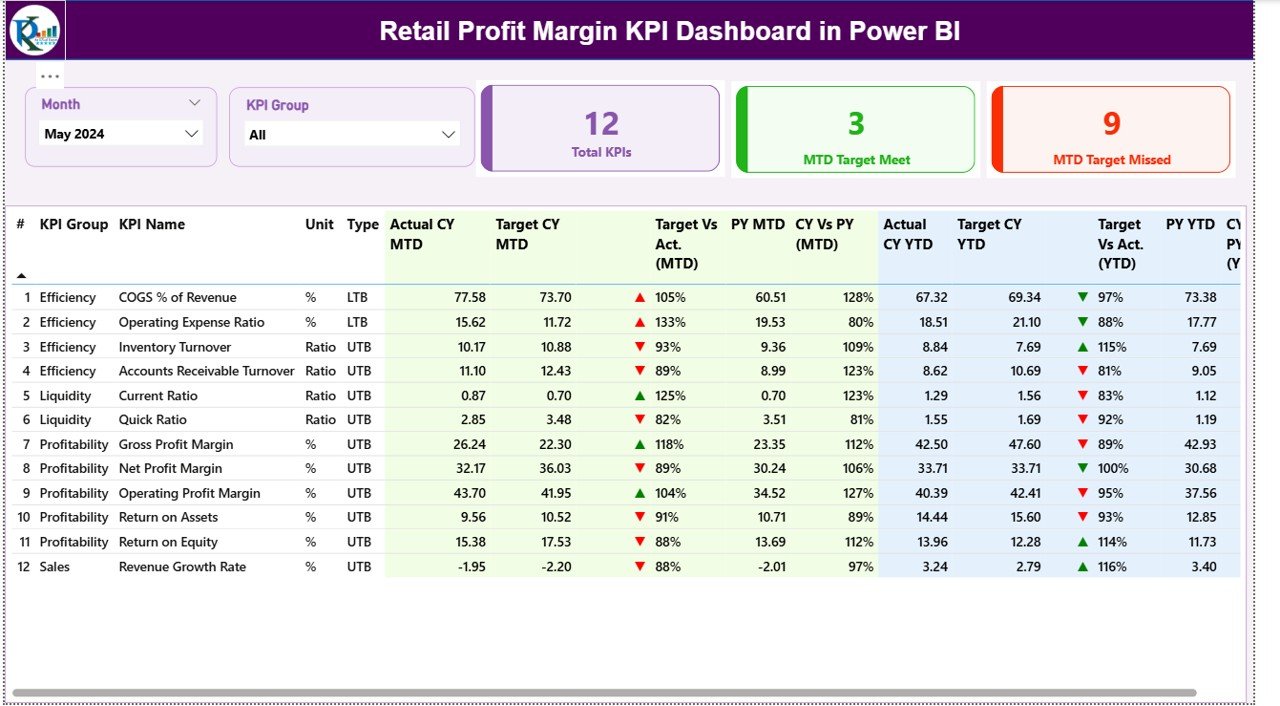
Summary Page
The Summary Page acts as the central hub of the dashboard. It offers a complete snapshot of all key performance indicators (KPIs).
Key features include:
- Month & KPI Group Slicers: Allow users to filter data by month or KPI category for quick insights.
- Performance Cards: Display essential counts such as:
- Total number of KPIs
- MTD Target Met count
- MTD Target Missed count
- Detailed KPI Table: Displays in-depth performance information, including:
- KPI Number – Unique sequence for each KPI
- KPI Group – The category or department the KPI belongs to
- KPI Name – The specific KPI being measured (e.g., Gross Margin %)
- Unit – Unit of measurement (e.g., %, USD)
- Type – Indicates whether “Lower the Better (LTB)” or “Upper the Better (UTB)”
- Actual CY MTD / Target CY MTD – Shows Month-to-Date actual vs. target
- MTD Icon – Visual red (▼) or green (▲) indicators for performance
- Target vs. Actual (MTD) – Displays % achievement using the formula:
Actual MTD / Target MTD - PY MTD – Last year’s Month-to-Date number for comparison
- CY vs. PY (MTD) – Comparison ratio between current and previous year’s MTD
- Actual CY YTD / Target CY YTD – Displays cumulative year performance
- YTD Icon – Visual indicators for year-to-date performance
- Target vs. Actual (YTD) – Calculated as Actual YTD / Target YTD
- PY YTD – Last year’s YTD number
- CY vs. PY (YTD) – Percentage comparison of this year vs. last year
This page delivers both high-level insights and granular analysis in one view, helping management instantly identify which areas exceed or lag behind targets.
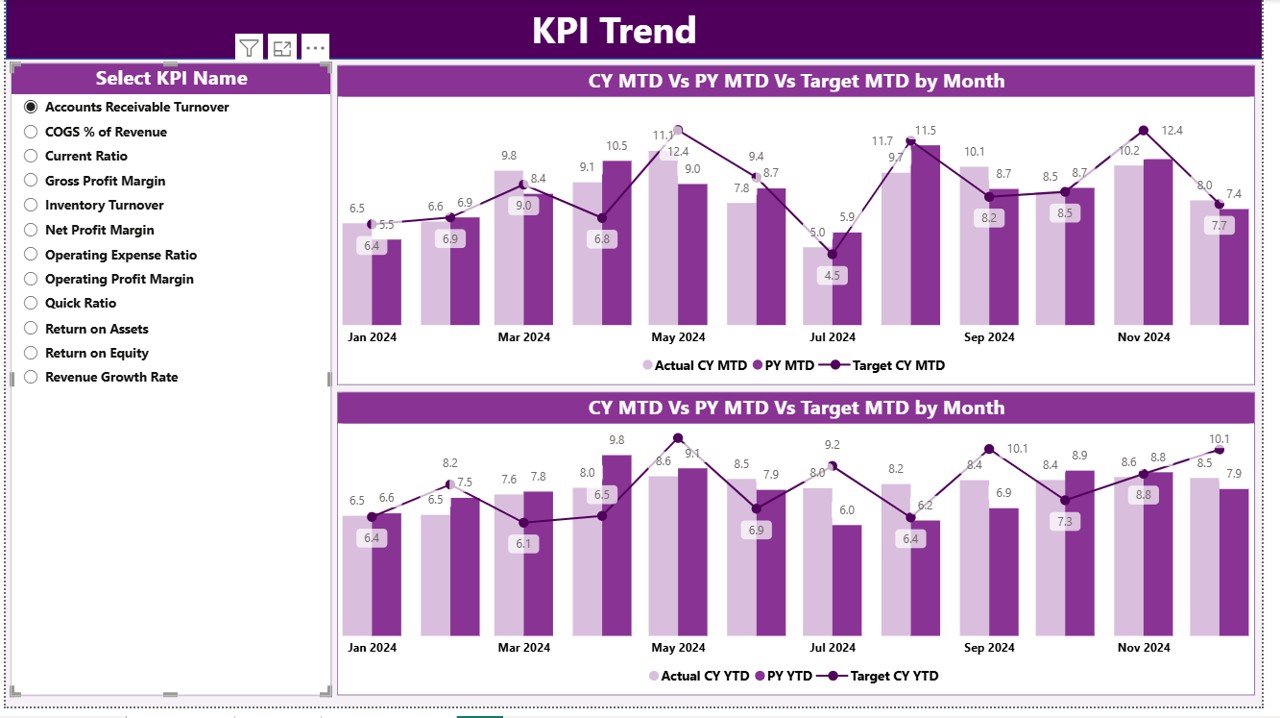
KPI Trend Page
The KPI Trend Page visualizes the progression of profit-related KPIs across months.
Key elements include:
- Slicer for KPI Name – Select a specific KPI for focused trend analysis.
- Two Combo Charts –
- One for Month-to-Date (MTD) Actual, Target, and Previous Year comparison
- Another for Year-to-Date (YTD) trend tracking
- Interactive Insights – Enables users to quickly interpret trends and detect deviations between targets and actuals over time.
This section helps business leaders understand whether performance improvements are consistent, seasonal, or one-off spikes.
Click to buy Retail Profit Margin KPI Dashboard in Power BI
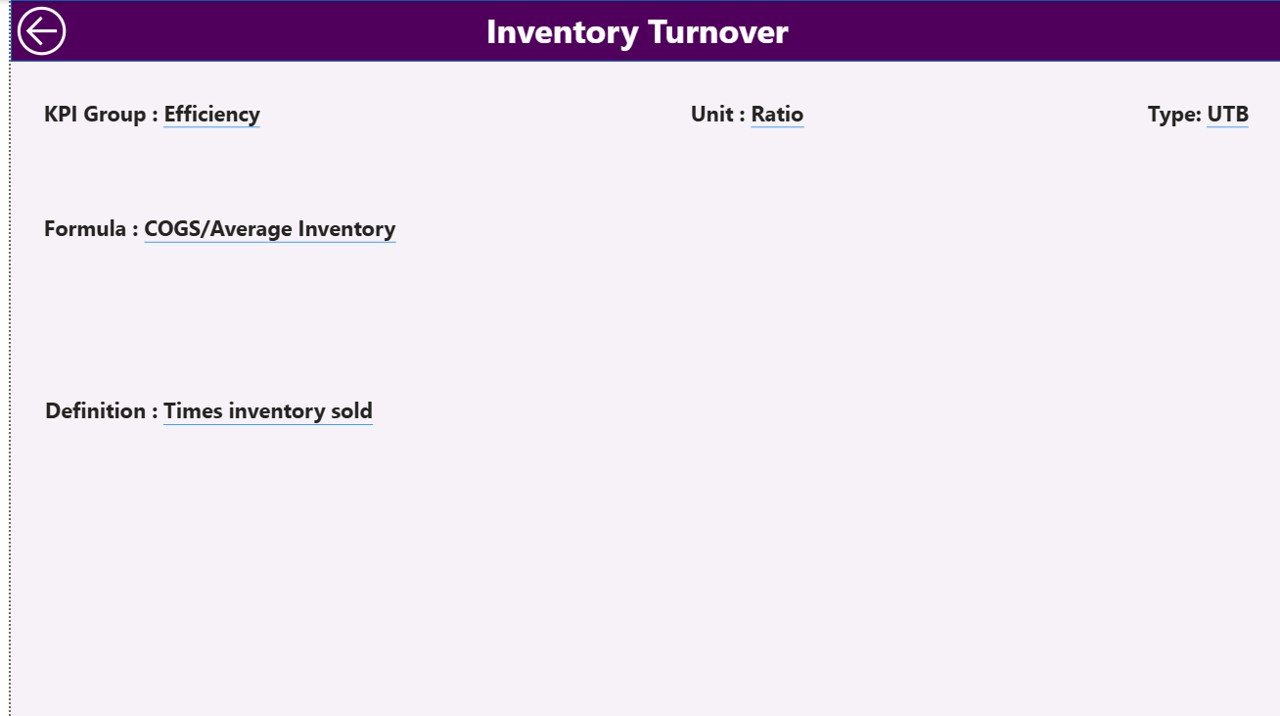
KPI Definition Page
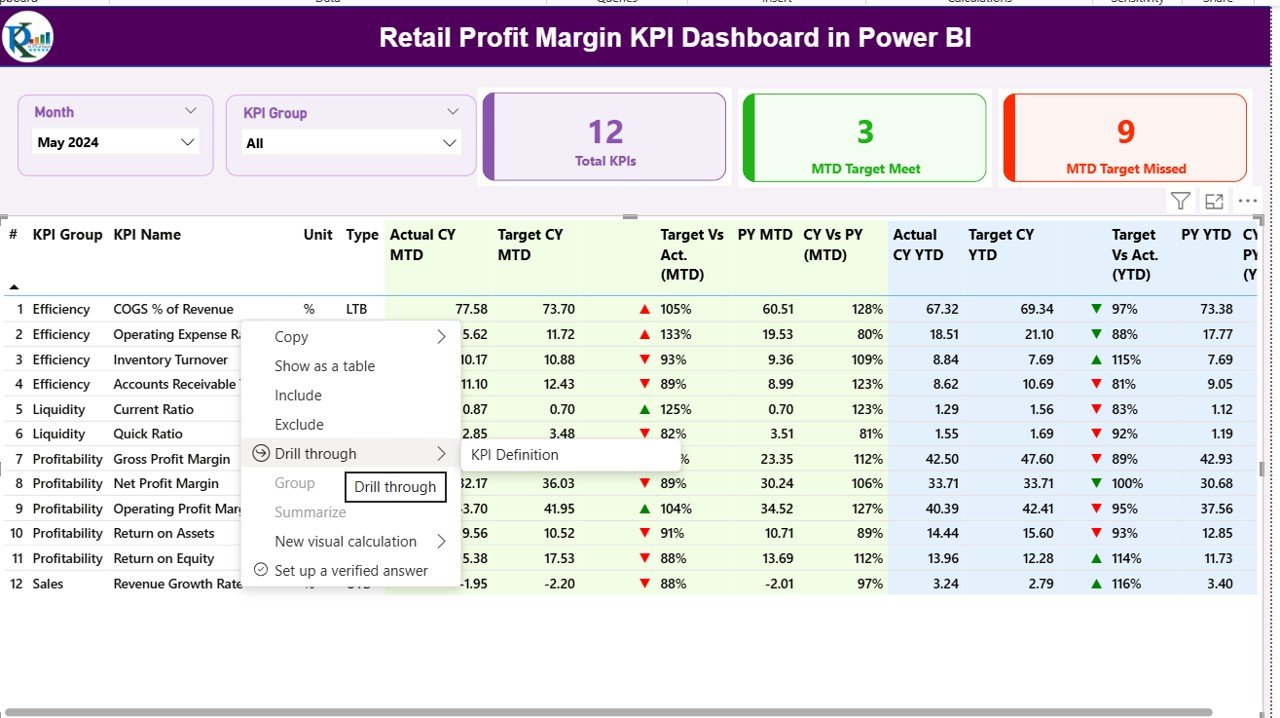
The KPI Definition Page is a hidden drill-through page designed for deeper exploration. From the Summary Page, users can drill through any KPI to view its formula and definition, ensuring transparency in calculation methods.
This page includes:
- KPI Number
- KPI Group
- KPI Name
- Unit
- Formula
- Definition
- Type (LTB/UTB)
Users can navigate back to the main page using the back button in the top-left corner.
Click to buy Retail Profit Margin KPI Dashboard in Power BI
Excel Data Integration
The backbone of this dashboard is an Excel-based data model, which ensures flexibility and ease of updates. The dashboard pulls its data from three key sheets in an Excel workbook:
Click to buy Retail Profit Margin KPI Dashboard in Power BI
This sheet stores actual performance data for each KPI.
- Columns include: KPI Name, Month (first day of month), MTD number, and YTD number.
⃣Input_Target Sheet
Here you enter target values for each KPI.
- Similar structure as the actual sheet, with Month, MTD Target, and YTD Target.
KPI Definition Sheet
This sheet holds the metadata and definitions for all KPIs, including KPI Number, Group, Unit, Formula, and Type (LTB or UTB).
By simply updating these Excel sheets, the dashboard refreshes automatically, keeping your analysis current and accurate.
Why Use Power BI for Retail Profit Margin Analysis?
Power BI provides a superior analytical environment for managing large, complex retail datasets. Here’s why it’s the perfect tool for retail profit margin tracking:
- Automation: No need to manually compile data — one-click refresh updates the entire dashboard.
- Visual Storytelling: Power BI’s visuals turn numbers into easy-to-understand insights.
- Comparative Analysis: Quickly compare MTD vs. YTD or Current Year vs. Previous Year.
- Interactive Exploration: Use slicers and drill-throughs for in-depth analysis.
- Scalability: Can integrate with future data sources like SQL or cloud-based POS systems.
How to Use the Retail Profit Margin KPI Dashboard
Using the dashboard is simple and intuitive.
Update the Excel data — Enter the latest actuals, targets, and KPI definitions.
Open Power BI Desktop — Load or refresh your dataset.
Navigate through pages —
- Start with the Summary Page for a high-level view.
- Move to the KPI Trend Page for performance evolution.
- Drill into specific KPIs via the KPI Definition Page if you need details.
Use slicers to filter by month or KPI group.
Interpret visuals — Use color-coded icons and trend lines to assess performance.
This workflow ensures consistent and accurate monitoring of profit performance across multiple business areas.
Advantages of Retail Profit Margin KPI Dashboard in Power BI
Using this dashboard provides numerous benefits for retailers of all sizes.
1. Centralized Profit Tracking
All profit-related KPIs are consolidated into one dashboard, eliminating fragmented reporting.
2. Real-Time Insights
Users can access up-to-date performance data instantly after refreshing the Excel source.
3. Visual Clarity
Color-coded indicators and combo charts make it easy to spot trends, outliers, or underperforming KPIs.
4. Improved Decision-Making
Managers can make data-driven decisions about pricing, discount strategies, and operational efficiency.
5. Historical Comparison
Compare this year’s results with previous periods to identify consistent performance improvements.
6. Transparent KPI Definitions
The hidden drill-through page ensures that everyone understands how KPIs are calculated.
7. Easy Integration
Since it’s Excel-based, even non-technical users can maintain and update data without specialized skills.
Opportunities for Improvement
While the Retail Profit Margin KPI Dashboard in Power BI is powerful, continuous improvement can make it even more effective.
- Add Forecasting Models: Use Power BI’s AI visuals to forecast profit margins for future months.
- Incorporate Cost Drivers: Include metrics like marketing spend or supplier costs for better root-cause analysis.
- Enable Departmental Dashboards: Create mini dashboards for store managers or regional heads.
- Add Alerts: Configure Power BI data alerts to notify users when KPIs fall below a threshold.
- Expand Data Sources: Connect with ERP or POS systems for real-time automation.
Use Cases of Retail Profit Margin KPI Dashboard
This dashboard can be applied across various retail business contexts:
- Apparel and Fashion Retailers: Track margins by product line and season.
- Supermarkets: Monitor profit trends by category (dairy, produce, frozen, etc.).
- Electronics Stores: Analyze profitability across brands or store locations.
- E-commerce Platforms: Compare online vs. offline margin performance.
- Franchise Businesses: Evaluate regional profitability and royalty income trends.
Key KPIs Typically Tracked
Here are some commonly tracked KPIs that this dashboard can accommodate:
- Gross Profit Margin (%)
- Net Profit Margin (%)
- Operating Profit Margin (%)
- Revenue per Store
- COGS as % of Revenue
- Discount Rate Impact
- Profit per Product Category
- YTD vs. Target Achievement %
These indicators collectively help identify which areas contribute most to profitability and which require attention.
Insights You Can Gain
This dashboard isn’t just about numbers; it’s about actionable intelligence.
You can uncover:
- Which departments meet profit goals consistently.
- Which product lines underperform compared to targets.
- How seasonality affects margins.
- The impact of cost changes on profitability.
- Which locations or channels perform better in revenue-to-cost ratios.
Such insights guide smarter business strategy and continuous performance improvement.
Best Practices for Using the Retail Profit Margin KPI Dashboard
Follow these best practices to make the most of your dashboard:
Keep Data Updated
Regularly refresh the Excel source files to maintain accuracy.
Define Clear KPI Targets
Set measurable and realistic targets for each KPI.
Use Consistent Formatting
nsure KPI definitions and formulas remain uniform across reporting periods.
Leverage Power BI Bookmarks
Create bookmarks for executive views (e.g., “MTD Summary” or “Top 5 KPIs”).
Enable Role-Based Access
Restrict data access based on departments or management levels for better data security.
Review Trends Monthly
Use the KPI Trend page to review recurring issues and act before they escalate.
Encourage Team Collaboration
Share Power BI reports via the Power BI service so teams can collaborate in real time.
Conclusion
The Retail Profit Margin KPI Dashboard in Power BI is more than a reporting tool — it’s a strategic asset. It empowers retailers to transform raw data into insights, identify profitability gaps, and drive smarter decisions.
With its Excel integration, intuitive visuals, and KPI tracking structure, this dashboard bridges the gap between data complexity and business clarity. Whether you run a single store or manage a national retail chain, implementing this dashboard ensures your profit margin monitoring stays efficient, transparent, and future-ready.
Frequently Asked Questions (FAQs)
What data sources can I use for this dashboard?
You can start with Excel data, but Power BI can also connect to databases, APIs, or cloud systems for automation.
How often should I update the dashboard?
Ideally, refresh data monthly for MTD/YTD tracking, but weekly updates work best for dynamic retail environments.
Can I customize KPIs in the dashboard?
Yes, the dashboard structure is flexible — you can add, edit, or remove KPIs directly from the Excel sheets.
Is Power BI necessary for this analysis?
Yes, Power BI offers superior visualization and automation capabilities compared to traditional Excel charts.
What skill level is required to use it?
Basic Excel and Power BI knowledge is sufficient. The dashboard is designed to be user-friendly and intuitive.
Can I use this dashboard for multiple stores?
Absolutely. You can extend the model to include store-level or regional filters for multi-location analysis.
How does it handle previous-year comparisons?
It calculates MTD and YTD comparisons automatically using formulas built into Power BI visuals.
Visit our YouTube channel to learn step-by-step video tutorials
Watch the step-by-step video tutorial:
Click to buy Retail Profit Margin KPI Dashboard in Power BI