The renewable energy industry is growing rapidly, driven by the global need to reduce carbon emissions and transition toward sustainable power sources. However, success in this fast-changing sector depends on more than just installing solar panels or wind turbines — it requires continuous tracking, analysis, and improvement.
That’s where a Renewable Energy KPI Scorecard in Excel comes in.
This powerful and ready-to-use tool enables renewable energy companies, sustainability managers, and energy analysts to monitor key performance indicators (KPIs) across projects, plants, and regions — all within a simple, interactive Excel environment.
Whether you’re tracking solar efficiency, wind farm productivity, carbon offset, or cost per kWh, this KPI scorecard helps you turn data into decisions.
In this article, we’ll explore what this scorecard is, how it works, its structure, key features, advantages, and best practices — along with a detailed FAQ section to help you use it effectively.
Click to buy Renewable Energy KPI Scorecard in Excel
What Is a Renewable Energy KPI Scorecard in Excel?
A Renewable Energy KPI Scorecard is a data-driven performance tracking tool built entirely in Microsoft Excel. It provides a centralized view of all critical energy KPIs that help evaluate operational efficiency, financial performance, and environmental impact.
Unlike complex software systems, this Excel-based scorecard offers simplicity, flexibility, and customization. It’s designed to be user-friendly so that managers, analysts, and sustainability teams can easily:
- Input data,
- Compare actuals vs. targets,
- Identify deviations,
- Visualize performance trends, and
- Make data-backed decisions.
By combining automation, visualization, and analytics, the Renewable Energy KPI Scorecard becomes a complete performance management solution for the clean energy sector.
Structure of the Renewable Energy KPI Scorecard
This scorecard is organized into four interactive worksheets, each serving a specific purpose. Let’s explore each one in detail.
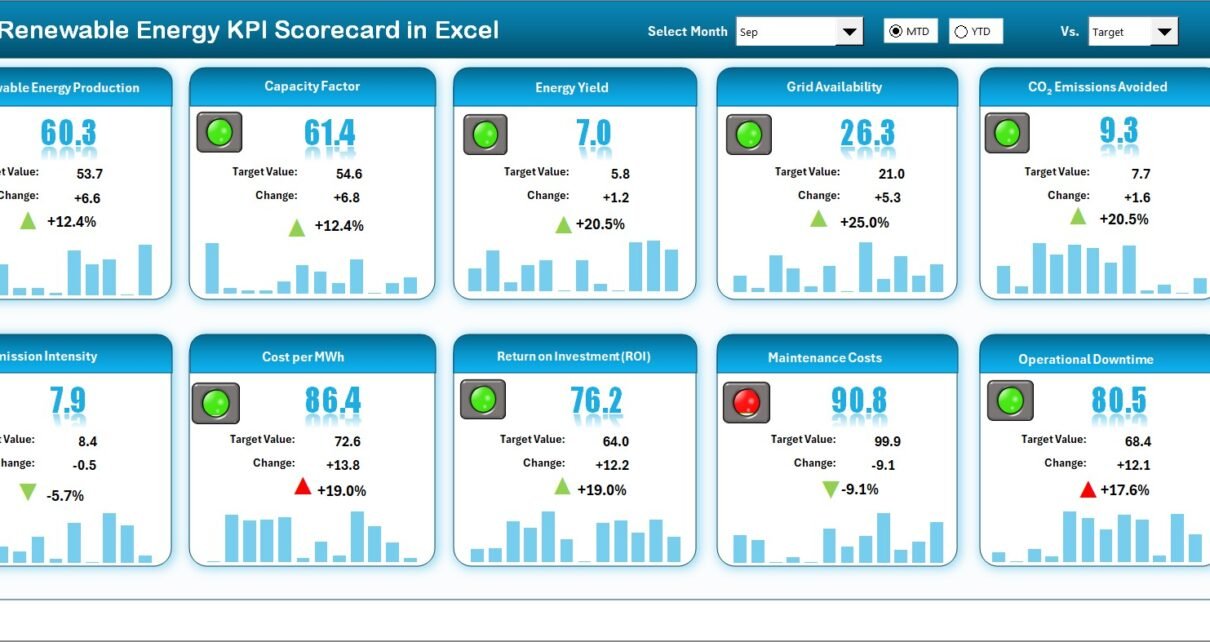
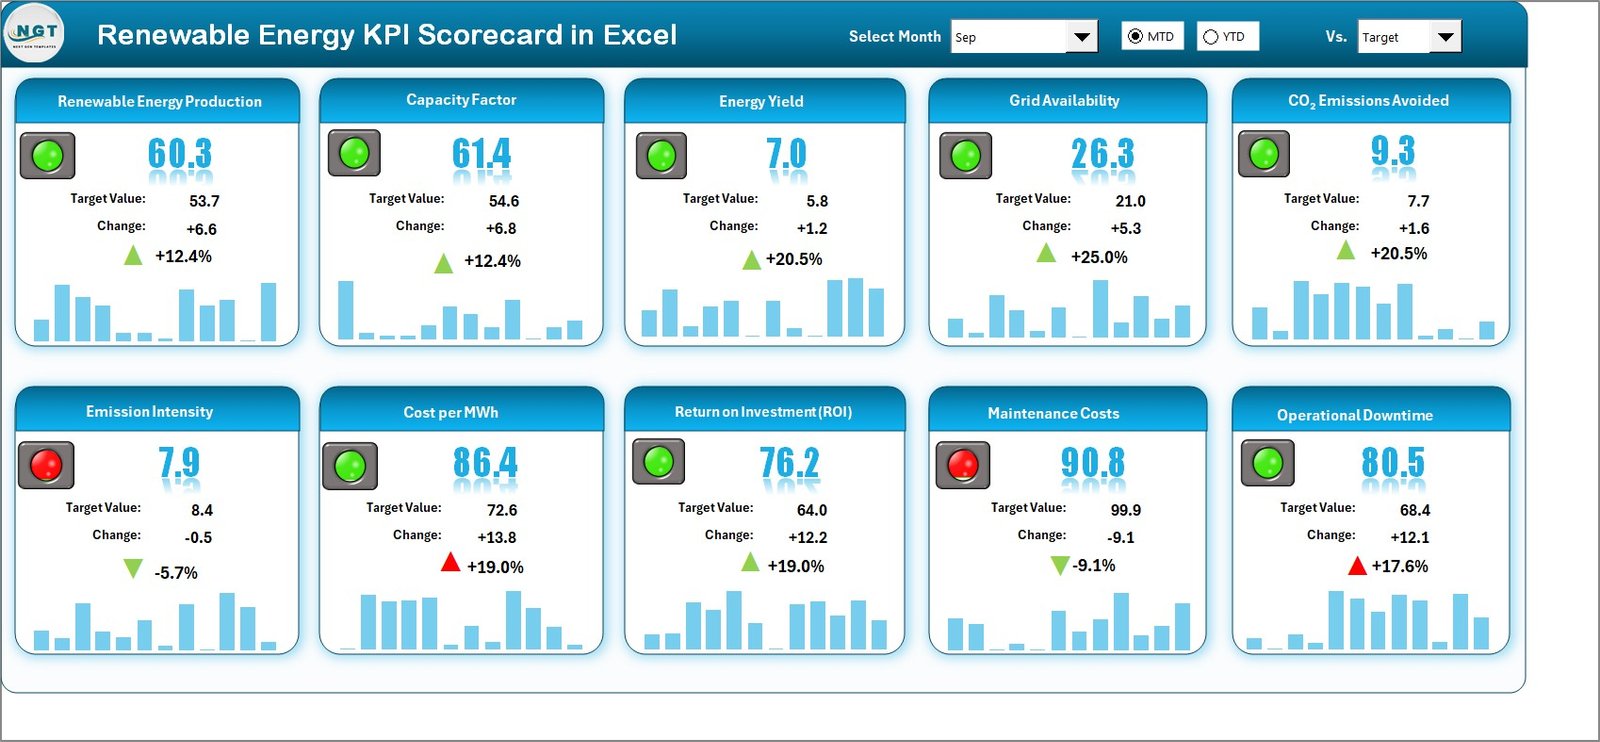
Scorecard Sheet – Your Main Dashboard
This is the heart of the tool, where you can instantly visualize overall performance.
Key Features Include:
- Dropdown Menus: Choose any month, and toggle between MTD (Month-to-Date) and YTD (Year-to-Date) analysis.
- Actual vs. Target Comparison: See where your KPIs stand against their goals.
- Visual Indicators: Color-coded signals (green for good, red for poor) provide instant insight.
- Comprehensive View: View 10 KPIs at a glance — from energy generation efficiency to CO₂ reduction percentage.
- Ease of Navigation: Clean layout with slicers for KPI groups and periods ensures quick filtering.
Click to buy Renewable Energy KPI Scorecard in Excel
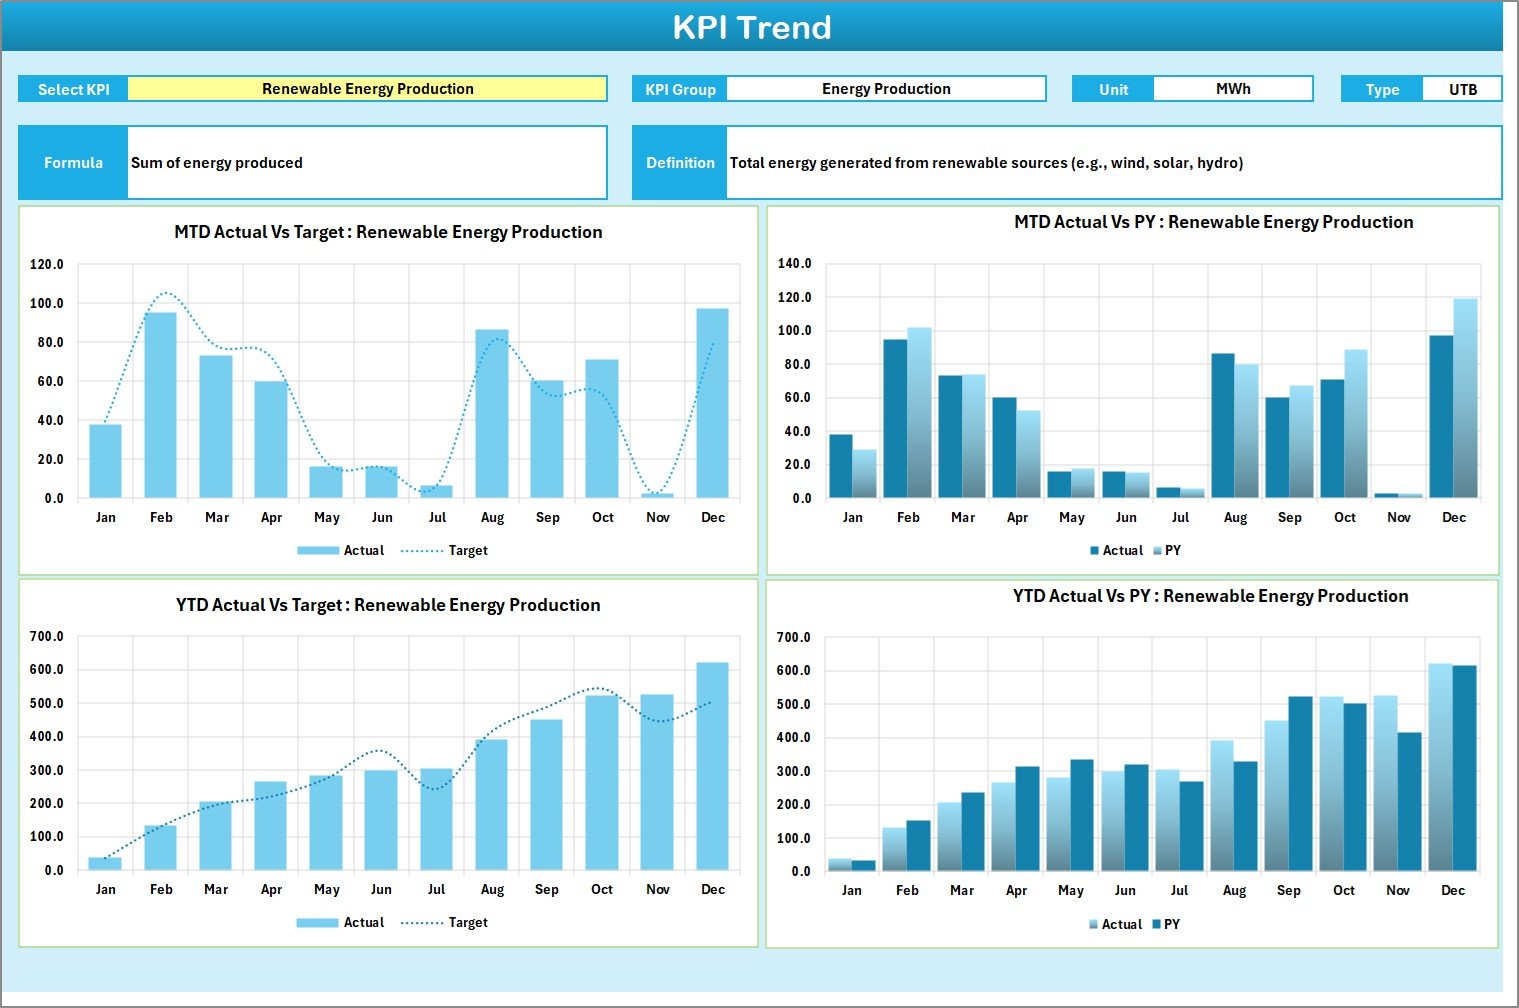
KPI Trend Sheet – Analyze Performance Over Time
In this sheet, you can select any KPI from the dropdown menu (cell C3) to see its trend across months.
You’ll find:
- KPI Group and Unit for context.
- KPI Type (LTB – Lower The Better, UTB – Upper The Better).
- Formula used for calculation.
- Definition for clarity.
- Dynamic line chart displaying MTD, YTD, Target, and Previous Year trends.
This page helps identify whether a metric is improving, declining, or stable, which is crucial for decision-making and forecasting.
Click to buy Renewable Energy KPI Scorecard in Excel
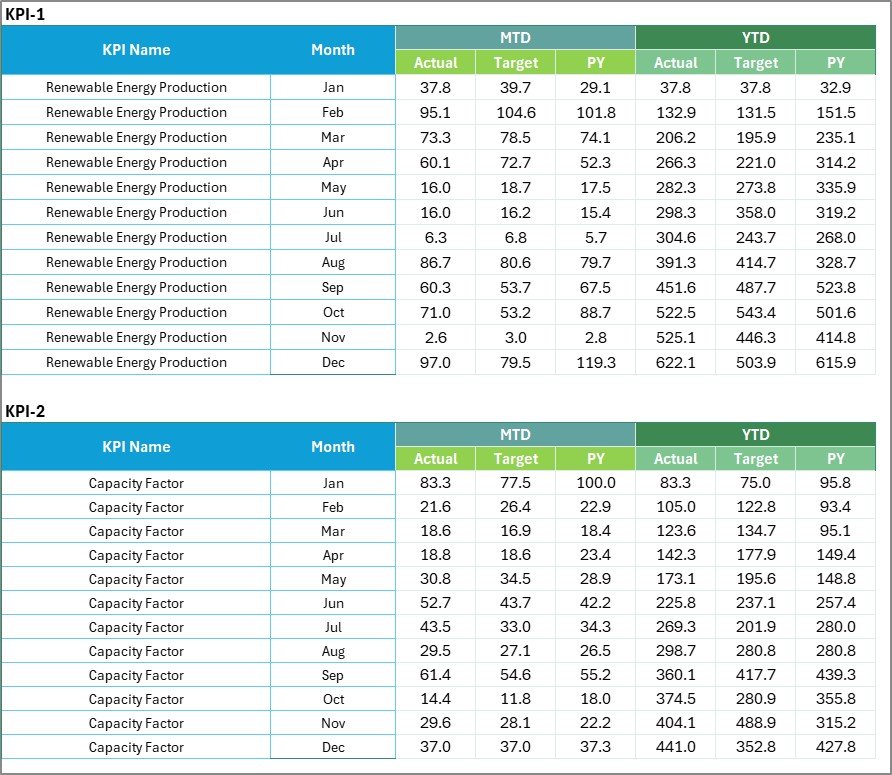
Input Data Sheet – Feed the Engine
All performance data lives here. You can easily enter:
- Monthly values,
- Actual and Target figures,
- Previous year numbers, and
- Category or department details.
Since it’s Excel, you can automate data entry, link from other sheets, or import from systems like ERP or SCADA.
Click to buy Renewable Energy KPI Scorecard in Excel
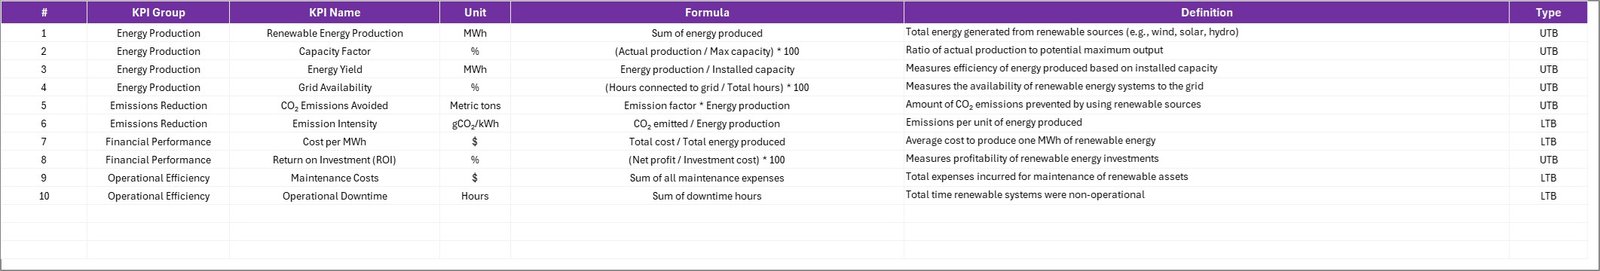
KPI Definition Sheet – The Knowledge Base
Every KPI deserves clarity. This tab lists:
- KPI Name
- KPI Group
- Unit of Measurement
- Formula
- Definition
This documentation ensures all users understand how KPIs are calculated and what they represent. It builds transparency and consistency across teams.
Click to buy Renewable Energy KPI Scorecard in Excel
Why Do You Need a Renewable Energy KPI Scorecard?
Renewable energy projects involve multiple moving parts — from turbine uptime to cost efficiency, from grid connectivity to carbon offset achievements. Managing all these aspects without a structured system leads to confusion and inefficiency.
Here’s why this Excel-based scorecard is indispensable:
- Consolidates data in one place for easy comparison and analysis.
- Reduces manual errors and promotes data accuracy.
- Improves communication across departments by presenting visual insights.
- Enables faster decisions through real-time KPI monitoring.
- Supports sustainability goals by tracking renewable output and emission reduction metrics.
Simply put, it’s your all-in-one control center for green energy performance📈 How to Use the Scorecard Effectively
- Start by defining your KPIs. Use the KPI Definition Sheet to align on goals and formulas.
- Enter monthly data in the Input Data Sheet.
- Open the Scorecard sheet and choose the month to see all metrics.
- Check visual indicators to identify underperforming areas.
- Use the KPI Trend sheet to analyze time-based progress.
- Take corrective actions based on insights — for example, scheduling preventive maintenance or optimizing energy loads.
The entire process helps organizations move from reactive reporting to proactive management.
Advantages of the Renewable Energy KPI Scorecard
The benefits of implementing this Excel-based scorecard are numerous.
- Comprehensive Visibility
Gain a complete view of all renewable energy operations in one place. It saves time and eliminates scattered reports.
- Real-Time Decision Support
Monitor MTD and YTD performance to take timely actions. No need to wait for end-of-month summaries.
- Sustainability Alignment
Measure how well your projects support corporate ESG and carbon neutrality targets.
- Operational Excellence
Spot bottlenecks in production, maintenance, or grid supply through trend visualization.
- Financial Optimization
Track cost per kWh and ROI to improve profitability without compromising on sustainability.
- Ease of Customization
Modify KPIs, formulas, or layouts based on organizational needs without coding.
- Data-Driven Culture
Encourages every team member to rely on facts rather than assumptions.
Best Practices for Using the Renewable Energy KPI Scorecard
To get the best out of your KPI scorecard, follow these practical tips:
Standardize KPI Definitions
Ensure everyone uses the same formulas and interpretations for each KPI. Update the Definition Sheet regularly.
Automate Data Collection
Link Excel with external systems like SCADA or ERP using Power Query to reduce manual work.
Review KPIs Monthly
Schedule monthly review meetings to assess performance trends and improvement actions.
Focus on Actionable Metrics
Avoid overwhelming your team with too many KPIs. Focus on those that drive meaningful outcomes.
Use Conditional Formatting Wisely
Leverage color indicators (green, yellow, red) for intuitive understanding.
Keep Historical Data
Maintain at least three years of data to analyze seasonal patterns and long-term performance.
Ensure Data Accuracy
Cross-verify inputs before each reporting cycle. Accuracy ensures credibility.
Make It Interactive
Add slicers, dropdowns, and charts to keep the dashboard engaging and insightful.
How It Supports Renewable Energy Decision-Making
By implementing this KPI Scorecard, organizations can make smarter choices in several ways:
- Resource Allocation: Identify which projects deliver the best return.
- Maintenance Scheduling: Predict failures based on downtime and trend analysis.
- Policy Evaluation: Check how policies impact performance metrics.
- Sustainability Reporting: Generate accurate reports for stakeholders and investors.
- Continuous Improvement: Establish a feedback loop that promotes long-term success.
The result is an organization that runs efficiently, saves costs, and meets its sustainability targets confidently.
Integrating the Scorecard With Other Tools
Although built in Excel, this scorecard can seamlessly connect with other systems.
- Power BI Integration: Import data from Excel to create advanced visuals.
- Google Sheets Connection: Share the same file for collaborative reporting.
- Cloud Storage: Use OneDrive or SharePoint for version control.
- Automation: Use VBA macros or Power Automate for regular data refresh.
These integrations transform Excel from a static file into a dynamic performance hub.
Common Challenges Solved by This Scorecard
- Data Fragmentation: Centralizes scattered information from multiple plants.
- Inconsistent Reporting: Provides uniform KPI definitions and calculations.
- Slow Decision-Making: Delivers real-time visuals and MTD insights.
- Limited Visibility: Combines technical, financial, and environmental views.
- Complex Tools: Offers all features within a simple Excel interface.
Conclusion
The Renewable Energy KPI Scorecard in Excel is a simple yet powerful solution for energy organizations that want to track, analyze, and improve performance without relying on expensive or complicated software.
It turns everyday data into strategic insights — helping you increase efficiency, reduce costs, and achieve sustainability targets.
From solar farms to wind energy projects, this tool ensures every kilowatt generated contributes effectively to a cleaner, greener planet.
Frequently Asked Questions (FAQs)
- What is the purpose of a Renewable Energy KPI Scorecard?
It helps monitor and analyze key performance metrics across renewable energy projects to ensure efficiency, profitability, and sustainability.
- Can I customize the KPIs in this scorecard?
Yes. You can easily modify KPI names, units, and formulas in the KPI Definition Sheet to suit your organization’s goals.
- How does this scorecard differ from a dashboard?
The scorecard focuses on performance metrics and comparisons, while a dashboard provides visual analytics and summaries. Both complement each other.
- Is this tool suitable for small renewable startups?
Absolutely. It’s cost-effective, easy to use, and requires no technical setup — perfect for startups and SMEs.
- Can it track both MTD and YTD data?
Yes. The built-in dropdown lets you switch between Month-to-Date and Year-to-Date performance analysis.
- How often should I update the data?
Ideally, update monthly for accurate tracking. However, it can also be updated weekly for high-frequency monitoring.
- Does it require Excel macros?
No macros are mandatory, but you can add VBA scripts to automate data refresh or reports.
- Can I integrate this scorecard with Power BI or Google Sheets?
Yes. You can import the Excel data into Power BI or sync it with Google Sheets for collaborative analytics.
- What are the most important renewable energy KPIs to track?
Energy generation efficiency, carbon offset, cost per kWh, downtime, and ROI are among the top ones.
- How can this scorecard help achieve sustainability goals?
By continuously monitoring emission reduction, renewable share, and operational efficiency, it ensures alignment with global sustainability standards.
Visit our YouTube channel to learn step-by-step video tutorials
Click to buy Renewable Energy KPI Scorecard in Excel
