Introduction
The AI Research Labs KPI Dashboard is a comprehensive, ready-to-use Excel template designed to help AI research teams monitor and manage their key performance indicators efficiently. This dynamic dashboard offers an intuitive interface that simplifies tracking monthly and yearly performance metrics, providing actionable insights to keep your projects on track.
Key Features of AI Research Labs KPI Dashboard
- Seven dedicated worksheets covering all essential KPI tracking aspects.
- Interactive drop-down selectors for month and KPI selection to customize data views.
- Clear visualization of MTD (Month-To-Date) and YTD (Year-To-Date) Actuals, Targets, and Previous Year data.
- Conditional formatting with up/down arrows for quick performance comparison.
- Comprehensive KPI definitions, formulas, and grouping for clarity and standardization.
- Easy data input sheets helping streamline Actual, Target, and Previous Year numbers entry.
- Fully navigable dashboard with homepage buttons to switch quickly between worksheets.
Dashboard Pages Explanation
1. Home Sheet
This index page serves as the dashboard’s control center with six clickable buttons enabling smooth navigation to other sheets. It acts as the first point for users to explore various KPI data areas effortlessly.
 Home Page
Click to Buy AI Research Labs KPI Dashboard in Excel
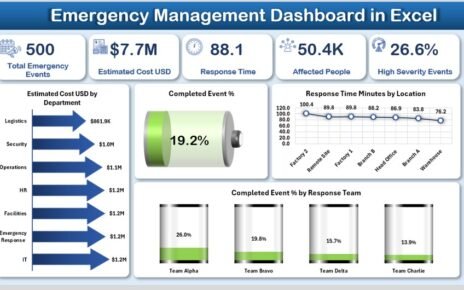
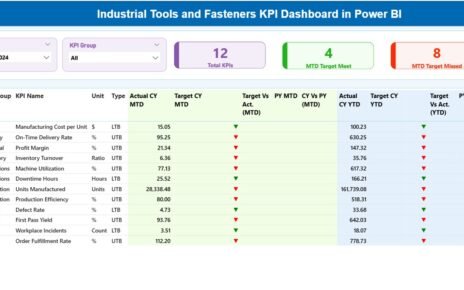
2. Dashboard Sheet
The core sheet of the template provides a detailed overview of all KPIs. You can select a month from the drop-down at cell D3. Once selected, all the dashboard numbers will dynamically update to reflect the chosen timeframe.
- Displays MTD Actual, Target, and Previous Year results.
- Includes comparative analysis with Target vs. Actual and Previous Year vs. Actual using conditional formatting arrows.
- Shows YTD Actuals, Targets, and Prior Year data with similar visual aids.
 AI Research Labs KPI Dashboard
Click to Buy AI Research Labs KPI Dashboard in Excel
3. KPI Trend Sheet
This section focuses on detailed trends for individual KPIs. By selecting a KPI from the drop-down at cell C3, you gain insights into:
- KPI Group categorization
- Unit of measurement
- Type of KPI (Lower The Better or Upper The Better)
- Formula and detailed definition
Additionally, it presents MTD and YTD trend charts comparing Actual, Target, and Previous Year values, offering a visual grasp of performance patterns.
 KPI Trend Sheet
Click to Buy AI Research Labs KPI Dashboard in Excel
4. Actual Numbers Input Sheet
Here, users input the actual performance figures both Month-To-Date and Year-To-Date. The month can be adjusted via the dropdown at cell E1, enabling flexibility in reporting starting months.
 Actual Numbers Input sheet
5. Target Number Input Sheet
This sheet allows entry of monthly targets for each KPI, for both MTD and YTD values, ensuring target management is clear and centralized.
 Target Number Input sheet
Click to Buy AI Research Labs KPI Dashboard in Excel
6. Previous Year Number Input Sheet
Enter prior year performance data in this tab to enable year-over-year comparisons, essential for performance benchmarking.
 Previous Year Number Input sheet
7. KPI Definition Sheet
This sheet documents the KPI metadata, including:
- KPI Name
- KPI Group
- Unit
- Formula
- KPI Definition
- KPI Type as LTB (Lower The Better) or UTB (Upper The Better)
It provides a foundation for standardized KPI understanding throughout the AI research team.
 KPI Definition sheet
Click to Buy AI Research Labs KPI Dashboard in Excel
Advantages of AI Research Labs KPI Dashboard
- Time-Saving: Pre-built templates reduce setup time significantly.
- Clarity: Clean visuals and contextual buttons make navigation and data interpretation intuitive.
- Customization: Users can easily select months and KPIs to focus on relevant data.
- Performance Monitoring: Conditional formatting quickly highlights performance variances.
- Comprehensive Data Handling: Separate sheets for Actual, Target, and Previous Year numbers enhance data organization.
Opportunities for Improvement
Click to Buy AI Research Labs KPI Dashboard in Excel
- Incorporate automated data connections to pull data from external AI experiment logs or databases.
- Add predictive analytics features utilizing AI to forecast KPI trends.
- Include user role-based access controls to protect sensitive data.
- Integrate real-time collaboration tools for remote AI research teams.
Best Practices
- Regularly update actual, target, and previous year numbers for accurate tracking.
- Review the KPI definitions carefully to ensure alignment with organizational goals.
- Use conditional formatting cues to swiftly identify areas needing attention.
- Maintain data consistency by standardizing input formats across sheets.
- Leverage trend charts to analyze patterns and strategize proactively.
FAQs
Click to Buy AI Research Labs KPI Dashboard in Excel
Q: Can I add new KPIs to this dashboard?
A: Yes, you can add new KPIs by updating the KPI Definition sheet and entering the corresponding Actual, Target, and Previous Year data in their respective sheets.
Q: How do I update the month for the dashboard?
A: Navigate to the Dashboard sheet and use the drop-down in cell D3 to select the desired month. The dashboard will automatically refresh the data for the selected period.
Q: Is this dashboard compatible with Excel versions on both Windows and Mac?
A: Yes, this template is designed to be compatible with most modern Excel versions across Windows and Mac platforms.
Q: How are KPI types used in this dashboard?
A: The KPI type (Lower The Better or Upper The Better) helps conditional formatting and interpretation of the data to assess whether a higher or lower value is favorable.
Conclusion
Click to Buy AI Research Labs KPI Dashboard in Excel
The AI Research Labs KPI Dashboard is an essential tool for AI research teams aiming to efficiently monitor performance and improve project outcomes. Its user-friendly interface, detailed visualizations, and comprehensive data input forms make it an excellent choice for streamlining KPI management. By adopting this dashboard, research labs can enhance decision-making and maintain focus on strategic goals.
For more information on Microsoft Excel best practices, visit Microsoft Excel Support.
Visit our YouTube channel to watch the demo: Youtube.com/@NextGenTemplates
Click to Buy AI Research Labs KPI Dashboard in Excel