In today’s fast-paced digital media world, television and radio broadcasting companies handle thousands of data points — from advertising revenue and audience engagement to program quality and technical uptime. Managing this information efficiently is essential to make data-driven decisions, improve audience reach, and maximize profitability.
That’s where the Broadcasting KPI Scorecard in Excel becomes an indispensable tool.
This ready-to-use template helps broadcasters visualize, monitor, and evaluate their key performance indicators (KPIs) across multiple dimensions — programming, marketing, operations, and finance — all within Microsoft Excel.
This article explores everything about the Broadcasting KPI Scorecard in Excel, including its structure, features, advantages, best practices, and frequently asked questions. Let’s get started.
Click to buy Broadcasting KPI Scorecard in Excel
What Is a Broadcasting KPI Scorecard in Excel?
A Broadcasting KPI Scorecard is an interactive Excel-based performance management tool designed for radio, television, and digital broadcasting networks. It consolidates KPIs such as viewership rating, content quality, ad revenue, broadcast uptime, and audience satisfaction into one centralized dashboard.
This scorecard allows teams to:
- Track Month-to-Date (MTD) and Year-to-Date (YTD) performance.
- Compare Actual vs Target and Previous Year (PY) values.
- Identify trends using conditional formatting indicators like up/down arrows and color codes.
- Drill down into KPI trends over time.
- Improve efficiency by analyzing what’s working — and what needs attention.
By bringing all these insights into one Excel file, you can monitor performance quickly without needing expensive software.
Dashboard Structure: Worksheets Overview
The Broadcasting KPI Scorecard in Excel contains seven well-organized worksheets. Each plays a unique role in data entry, analysis, and visualization.
Home Sheet
The Home sheet serves as your central navigation hub.
It includes six clickable buttons, allowing you to jump directly to different sheets. This makes it simple to move between the dashboard, trend analysis, or data input pages.
Why it matters:
It saves time and provides a user-friendly interface, especially for professionals managing multiple KPIs at once.
Click to buy Broadcasting KPI Scorecard in Excel
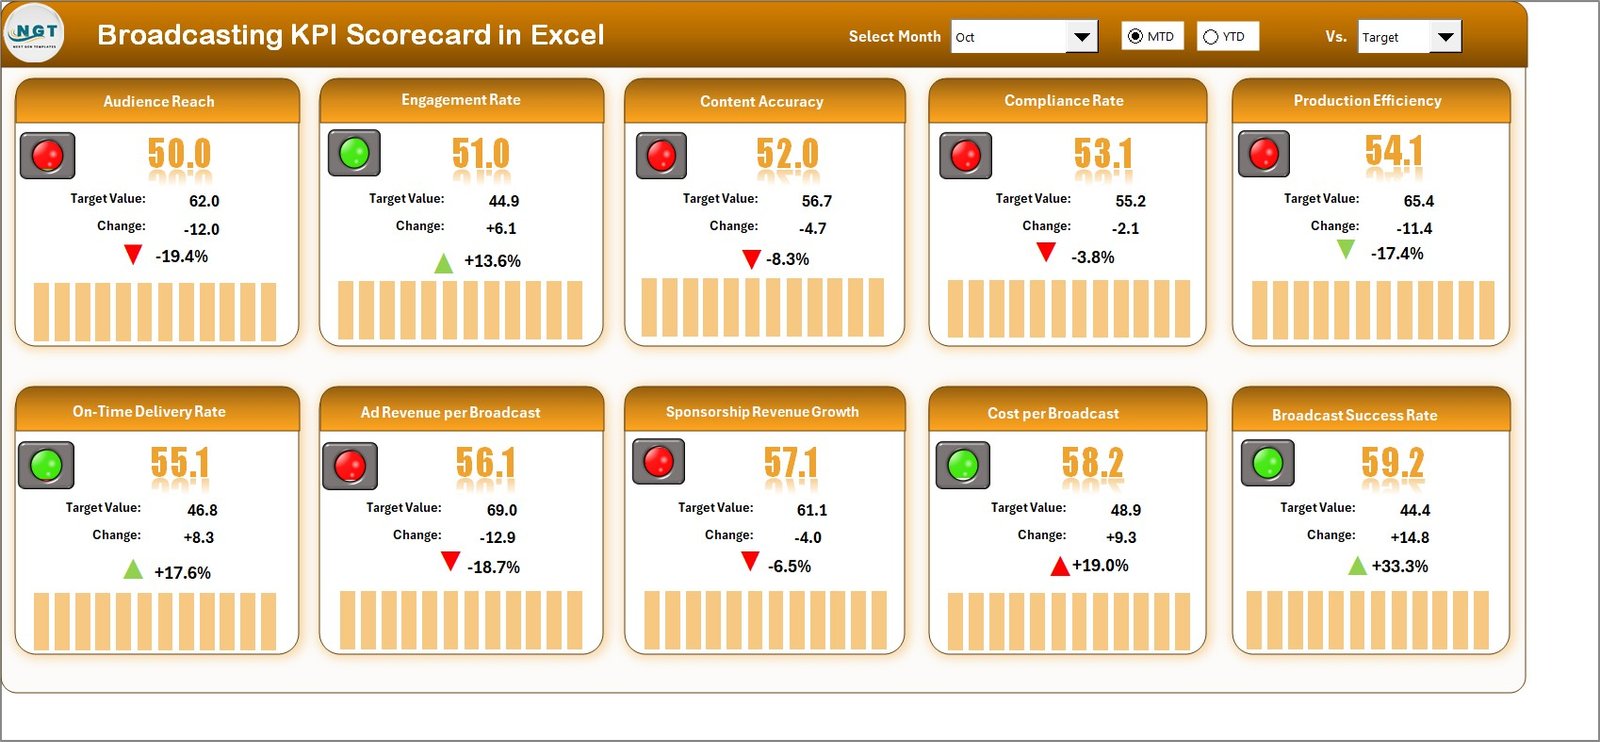
Dashboard Sheet Tab
The Dashboard sheet is the main analytical hub of the scorecard.
Here’s what it includes:
- A Month Selector (Cell D3) to choose any month dynamically.
- Displays MTD and YTD values for each KPI.
- Compares Actual vs Target and Actual vs Previous Year performance.
- Shows conditional formatting with green (up) and red (down) arrows for quick insights.
Key Insight:
The dashboard automatically updates all figures when you select a different month.
This helps management instantly view how each metric performed during a specific time frame — making it perfect for monthly review meetings.
Click to buy Broadcasting KPI Scorecard in Excel
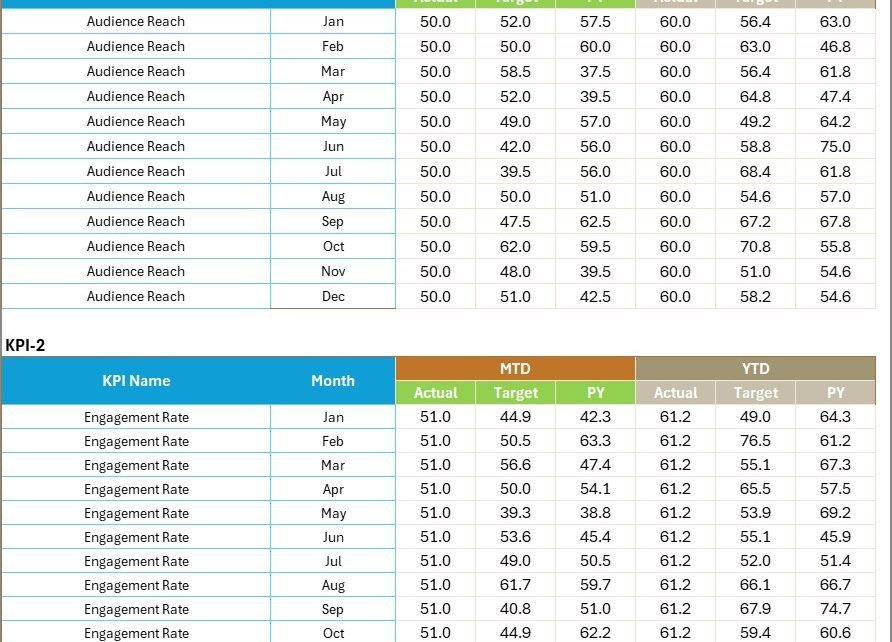
KPI Trend Sheet Tab
The KPI Trend sheet gives a detailed view of performance patterns.
You can:
- Select a KPI name from a drop-down in cell C3.
- View KPI details like Group, Unit, Type (UTB or LTB), Formula, and Definition.
- Analyze MTD and YTD trend charts showing Actual, Target, and PY data.
Why this is valuable:
The KPI Trend sheet makes it easy to spot performance fluctuations over months and identify whether trends are improving or declining.
Click to buy Broadcasting KPI Scorecard in Excel
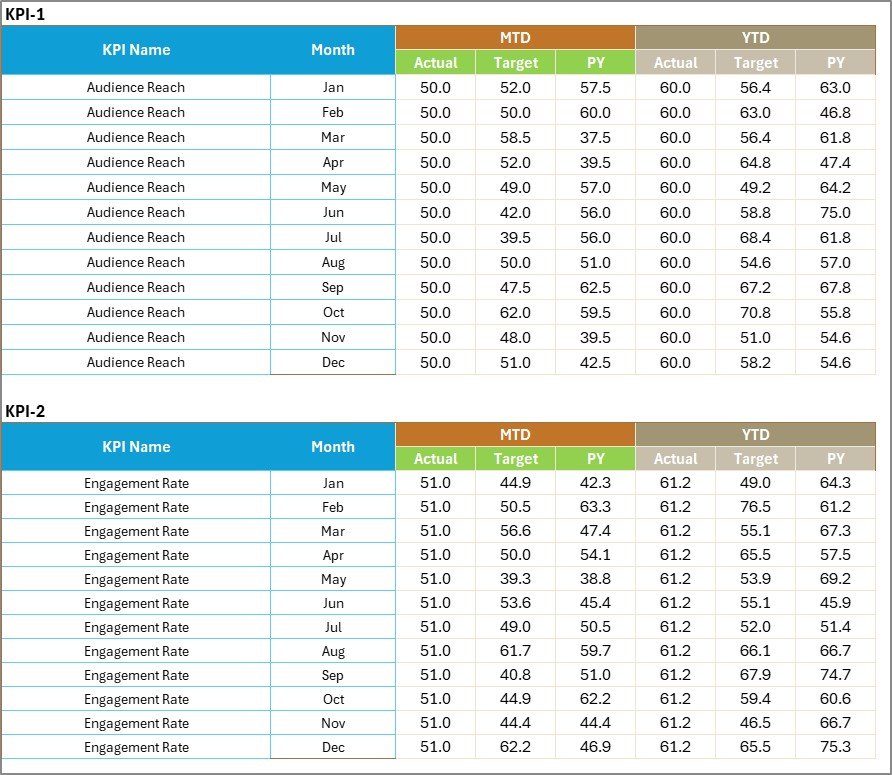
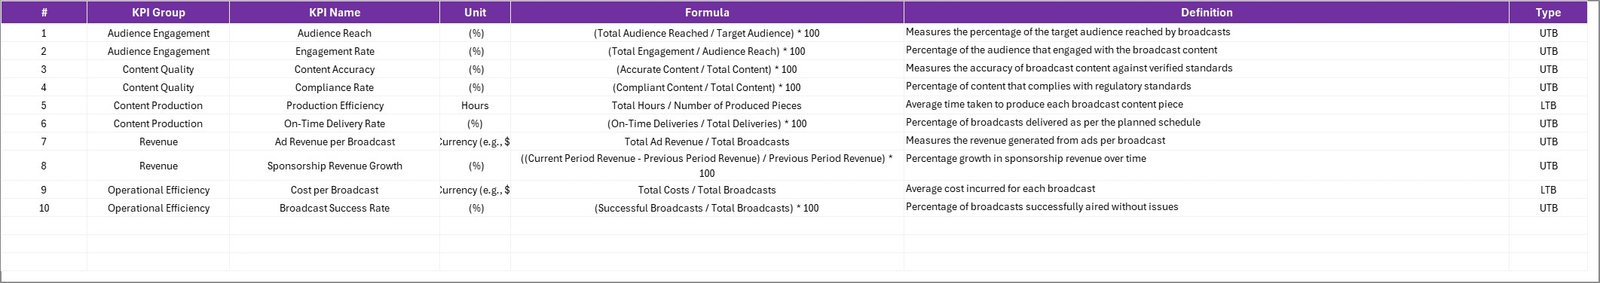
KPI Definition Sheet Tab
The KPI Definition sheet lists all your performance indicators with their technical details.
Columns typically include:
- KPI Name
- KPI Group
- Unit
- Formula
- Definition
- Type (UTB – Upper the Better / LTB – Lower the Better)
Why it’s important:
It standardizes all KPIs across departments, ensuring everyone tracks metrics consistently.
Click to buy Broadcasting KPI Scorecard in Excel
Key Features of the Broadcasting KPI Scorecard in Excel
Fully Interactive Dashboard: Real-time updates when you change the selected month.
Visual Indicators: Conditional formatting arrows highlight performance trends.
Custom KPI Management: Easily define and update KPI formulas or units.
Comparison Metrics: Automatically compares Actual vs Target vs Previous Year data.
Trend Charts: Visualize monthly and yearly performance.
Simple Data Entry: Structured input sheets minimize manual errors.
Navigation Buttons: Move across sheets quickly without scrolling.
These features make it an ideal solution for both small broadcasters and large media houses.
Why Use a Broadcasting KPI Scorecard in Excel?
Broadcasting involves multiple teams — from production to marketing and technical operations. Managing their performance can get complicated. A KPI scorecard simplifies everything by offering one unified view.
Here’s why it’s valuable:
- It consolidates data from various departments.
- It saves time by automating reporting processes.
- It enhances decision-making with visual analytics.
- It identifies underperforming areas early.
- It tracks strategic goals and operational metrics together.
In short, it bridges the gap between data collection and actionable insight.
Advantages of Using Broadcasting KPI Scorecard in Excel
A Broadcasting KPI Scorecard offers numerous benefits to management and operational teams alike.
Centralized Performance Tracking
All KPIs — financial, operational, and audience-related — stay in one place. No more switching between different tools or reports.
Real-Time Insights
Dynamic charts and conditional formatting highlight which KPIs are on track and which need attention — all updated automatically when data changes.
Ease of Use
Since it’s built in Excel, no special software or technical expertise is needed. Anyone familiar with spreadsheets can operate it.
Cost-Effective
Unlike expensive BI tools, this Excel-based solution requires zero licensing fees, making it perfect for small and mid-sized media firms.
Customizable and Scalable
You can easily add, modify, or remove KPIs based on your organization’s evolving needs.
Supports Strategic Decision-Making
It links operational data with long-term business goals, enabling management to make informed strategic choices.
How to Use the Broadcasting KPI Scorecard in Excel
Follow these steps to get started:
Set Up Your KPI Definitions:
List all KPIs in the KPI Definition sheet with their formulas and targets.
Enter Data:
Fill the Actual, Target, and Previous Year sheets with your monthly data.
Select the Month:
Use the Month selector (D3) on the Dashboard sheet to view data for any specific month.
Analyze the Dashboard:
Check MTD and YTD comparisons and visualize performance using trend charts.
Review Trends:
Open the KPI Trend tab to see historical progress and identify improvement opportunities.
Opportunities for Improvement
While Excel provides a flexible and affordable platform, there are still areas where enhancements can be made:
- Automation: Integrate VBA or Power Query to fetch live data from external sources.
- Visualization: Add advanced Excel charts like combo or radar charts for better storytelling.
- Collaboration: Use cloud-based Excel (Microsoft 365) to enable multiple users to update simultaneously.
- Security: Protect sensitive sheets and hide formulas to maintain data integrity.
- Performance Optimization: Use dynamic ranges or Power Pivot to handle larger datasets efficiently.
These upgrades can take your scorecard from great to exceptional.
Best Practices for the Broadcasting KPI Scorecard in Excel
Implementing best practices ensures accurate results and easy maintenance.
Define Clear KPIs
Ensure each KPI has a clear name, definition, formula, and owner.
Standardize Data Entry
Use drop-downs, data validation, and consistent units to avoid discrepancies.
Update Regularly
Keep data current to maintain the dashboard’s accuracy and reliability.
Use Conditional Formatting Wisely
Highlight high or low performance using color codes and icons for instant understanding.
Back Up Data
Store copies monthly to preserve historical trends.
Review Trends Frequently
Analyze MTD and YTD patterns to detect emerging issues early.
Keep It Simple
Avoid clutter. Focus on KPIs that truly reflect business goals.
Train Users
Ensure everyone knows how to interpret dashboard visuals and input data properly.
Conclusion
The Broadcasting KPI Scorecard in Excel transforms the way media organizations track and manage performance.
It simplifies complex data into visual insights, encourages accountability, and aligns daily operations with long-term strategy.
Whether you’re monitoring audience ratings, ad revenue, or content quality, this Excel scorecard delivers clarity and actionable intelligence.
By following the best practices shared above, you can create a fully automated, visually engaging, and easy-to-use scorecard that drives continuous improvement in your broadcasting operations.
Frequently Asked Questions (FAQ)
- What is a Broadcasting KPI Scorecard in Excel?
It’s an Excel-based tool designed to track and visualize key performance indicators across broadcasting departments such as production, finance, and marketing.
- Can I modify the KPIs in this scorecard?
Yes. You can easily add or edit KPIs in the KPI Definition sheet according to your organization’s specific goals.
- How does it handle MTD and YTD data?
You can view both MTD (Month-to-Date) and YTD (Year-to-Date) data dynamically. The dashboard updates automatically when you select a month.
- Is it suitable for both radio and TV broadcasters?
Absolutely. The scorecard structure supports all types of media — television, radio, or digital streaming.
- Can I share this dashboard with others?
Yes. You can share it as a standard Excel file or through Microsoft 365 for collaborative editing.
- Do I need advanced Excel skills to use it?
Not at all. Basic Excel knowledge is enough to navigate, enter data, and interpret the dashboard visuals.
- How often should I update it?
Ideally, update it monthly after collecting actual and target data. Regular updates ensure accuracy and trend visibility.
- Can I link this scorecard to external data sources?
Yes. You can use Excel’s Power Query or VBA automation to fetch real-time data from databases or APIs.
- What if I want to visualize KPIs beyond Excel?
You can export the data to Power BI or Google Data Studio for more advanced visualization.
- How does this scorecard improve decision-making?
It provides an at-a-glance view of performance, highlighting areas that require action, which helps leaders make faster, data-driven decisions.
Visit our YouTube channel to learn step-by-step video tutorials
Watch the step-by-step video tutorial:
Click to buy Broadcasting KPI Scorecard in Excel