Business development teams work in a high-pressure environment where every lead, every opportunity, and every conversion matters. However, many organizations still track their KPIs through scattered spreadsheets, inconsistent reports, or manual data entry. Because of this, they lose clarity, move slowly, and miss several growth opportunities.
A Business Development KPI Dashboard in Power BI solves these problems instantly. It brings all important KPI data into one interactive and easy-to-use dashboard. As you explore this article, you will learn everything about this dashboard—how it works, what it includes, how business teams benefit from it, and how you can use it to strengthen your performance.
Click to buy Business Development KPI Dashboard in Power BI
What Is a Business Development KPI Dashboard in Power BI?
A Business Development KPI Dashboard in Power BI is an advanced reporting tool that brings all business development metrics into one visual platform. It helps teams monitor leads, deals, conversion rates, revenue pipeline, and performance trends. Power BI turns raw data from Excel into meaningful insights so that business development managers can make faster and smarter decisions.
This dashboard tracks KPIs such as:
- Lead generation
- Target vs actual performance
- Deal conversion
- New opportunities
- Client acquisition
- Revenue achieved
- Meetings, calls, and follow-ups
- Year-to-date (YTD) and month-to-date (MTD) values
- Previous year comparisons
Since Power BI updates instantly when you refresh Excel data, teams stay informed, aligned, and ready to act quickly.
Why Do You Need a Business Development KPI Dashboard?
Business development teams often deal with fast-moving data—new clients, new meetings, updated targets, and continuous follow-ups. Managing all this without a dashboard becomes tough. A Power BI dashboard gives a complete view of performance in real time, which helps teams stay ahead.
Here are a few key reasons you need it:
- You compare KPIs easily and see where you stand.
- You track performance month after month.
- You view past trends and predict future growth.
- You understand which KPIs are improving and which ones need attention.
- You avoid manual reporting and save hours every month.
- You make informed and confident decisions.
As a result, the team works better, grows faster, and uses data as a strategic advantage.
Key Features of the Business Development KPI Dashboard in Power BI
This ready-to-use dashboard contains three powerful pages, each designed to help you monitor performance clearly.
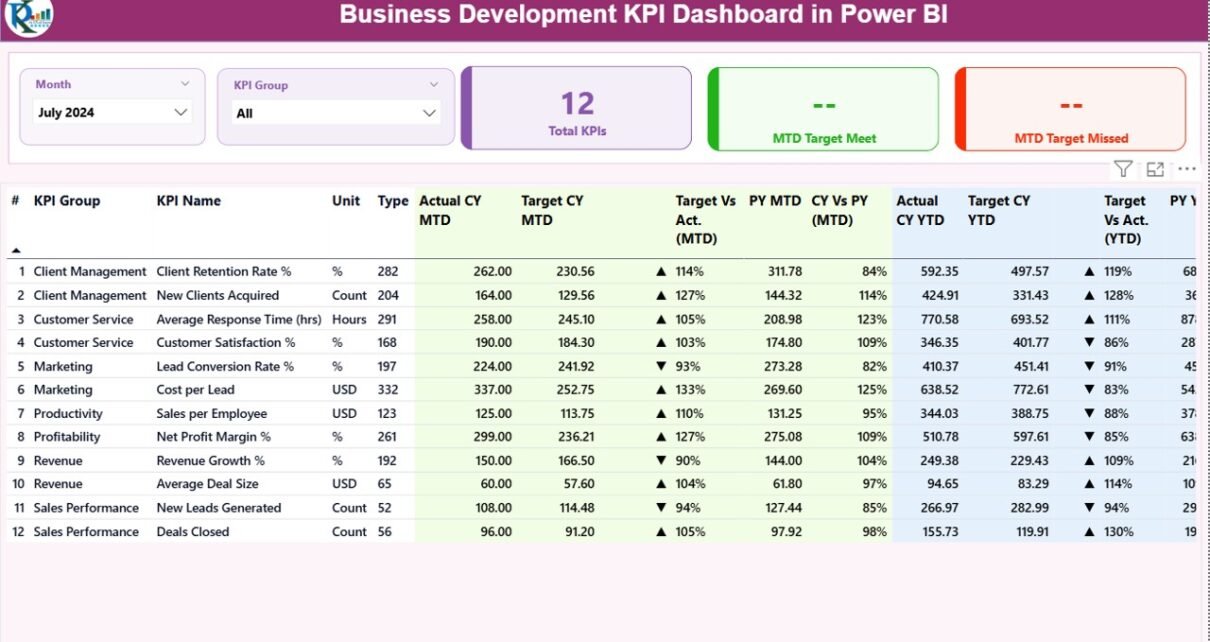
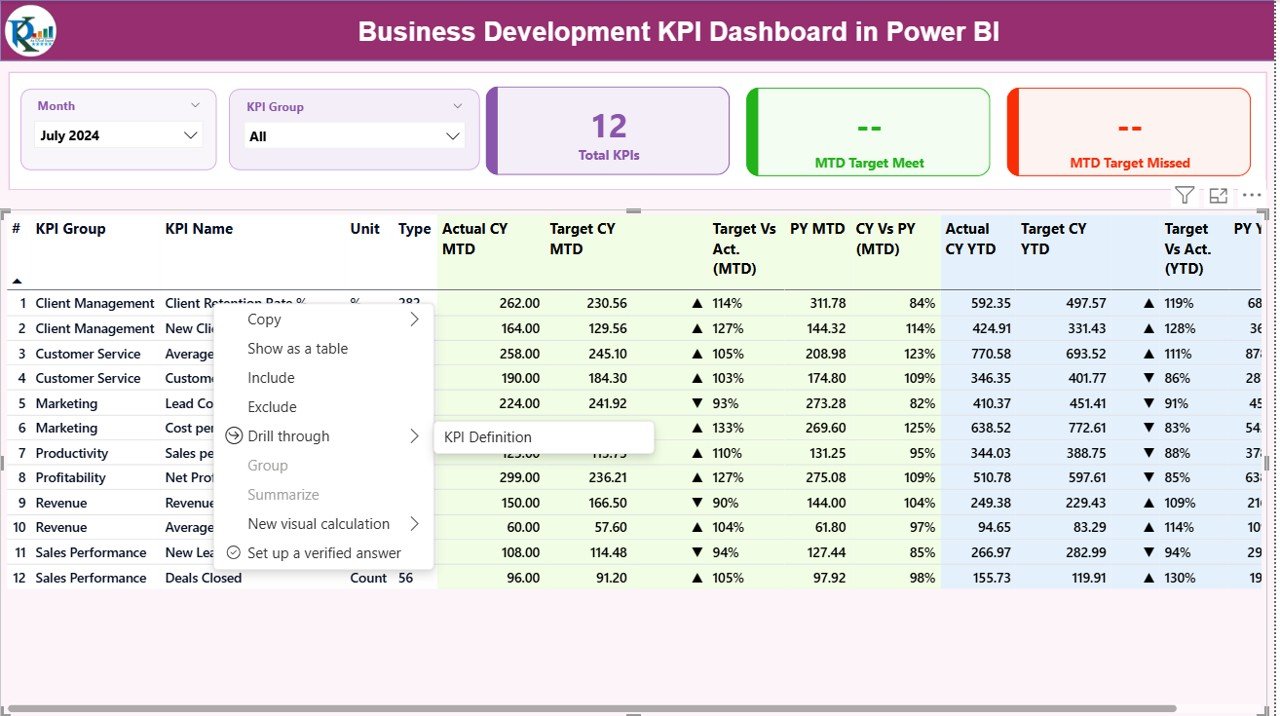
Summary Page – The Main Overview
The Summary Page works as the central view of your Business Development performance. It gives you quick insights using cards, tables, and slicers.
Top Section: Slicers and KPI Cards
You get two slicers:
- Month Slicer – Select any month to update the whole dashboard instantly.
- KPI Group Slicer – Filter KPIs by category to view only relevant data.
Below the slicers, you get three cards:
- Total KPIs Count
- MTD Target Met Count
- MTD Target Missed Count
These cards show your performance status in just one look.
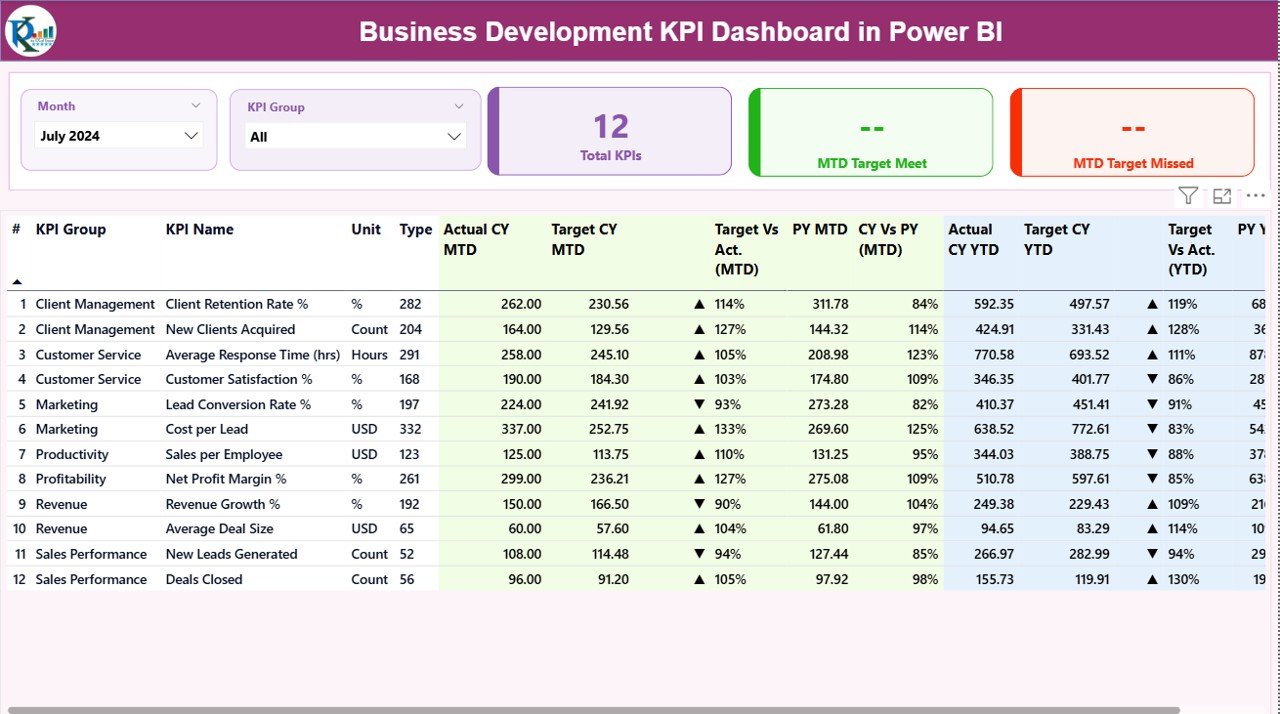
Detailed KPI Table
Below the cards, you find a detailed table that displays all KPI-level insights. This is the core of the summary page.
The table includes:
KPI Number
A unique sequence number for every KPI.
KPI Group
The category of the KPI such as Sales, Leads, Calls, Conversion, Revenue, or Pipeline.
KPI Name
The measurable indicator (e.g., New Leads, Deals Closed, Conversion %, MRR Growth).
Unit
The measurement unit such as %, Count, USD, etc.
Type: LTB or UTB
- LTB (Lower the Better)
- UTB (Upper the Better)
This clarity helps you interpret performance quickly.
Actual CY MTD
Actual value for the current year month-to-date.
Target CY MTD
Target value for the current year month-to-date.
MTD Icon
You see ▲ (green) for target achieved and ▼ (red) for target missed.
This makes it simple to understand KPI status at a glance.
Target vs Actual (MTD)
Percentage of achievement →
Actual MTD / Target MTD
Previous Year MTD (PY MTD)
Month-to-date value for the same period in the previous year.
CY vs PY (MTD)
Current year MTD vs previous year MTD comparison.
Actual CY YTD
Year-to-date actual value for the current year.
Target CY YTD
Year-to-date target value.
YTD Icon
Again the ▲ or ▼ icon to show YTD target achievement status.
Target vs Actual (YTD)
YTD performance calculation →
Actual YTD / Target YTD
Previous Year YTD (PY YTD)
Year-to-date data for the previous year.
CY vs PY (YTD)
Current YTD data vs previous YTD data comparison.
This complete table helps teams understand how they perform in the month as well as the full year.
Click to buy Business Development KPI Dashboard in Power BI
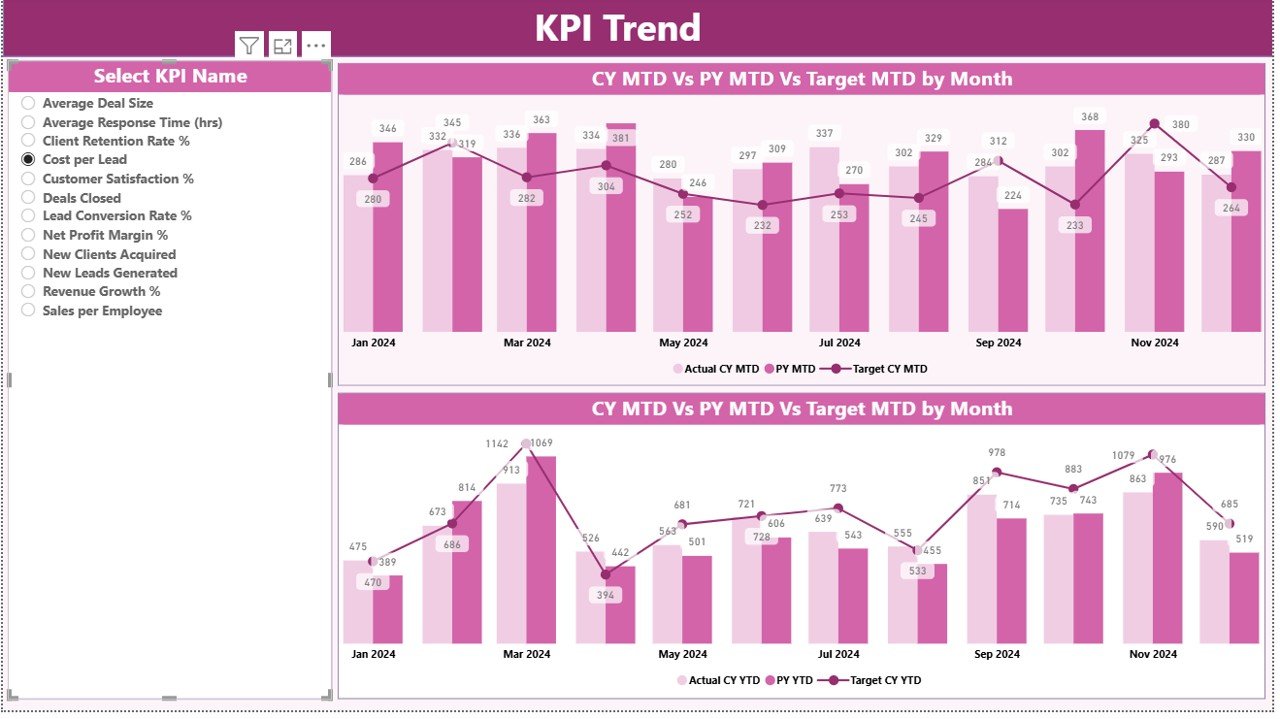
KPI Trend Page – Year-on-Year and Month-on-Month Trends
The KPI Trend Page helps you visualize performance patterns over time. You can select any KPI from the slicer on the left. Once selected, the page updates and shows two powerful combo charts:
- MTD Trend Chart
It compares Current Year Actual, Previous Year Actual, and Target MTD values. - YTD Trend Chart
It compares Current Year YTD, Previous Year YTD, and Target YTD values.
You see how your KPI moves month after month. This helps you:
- Identify growth patterns
- Spot declining KPIs early
- Compare performance with last year
- See how far you are from targets
Since Power BI provides interactive charts, you understand trends faster and take quick action.
Click to buy Business Development KPI Dashboard in Power BI
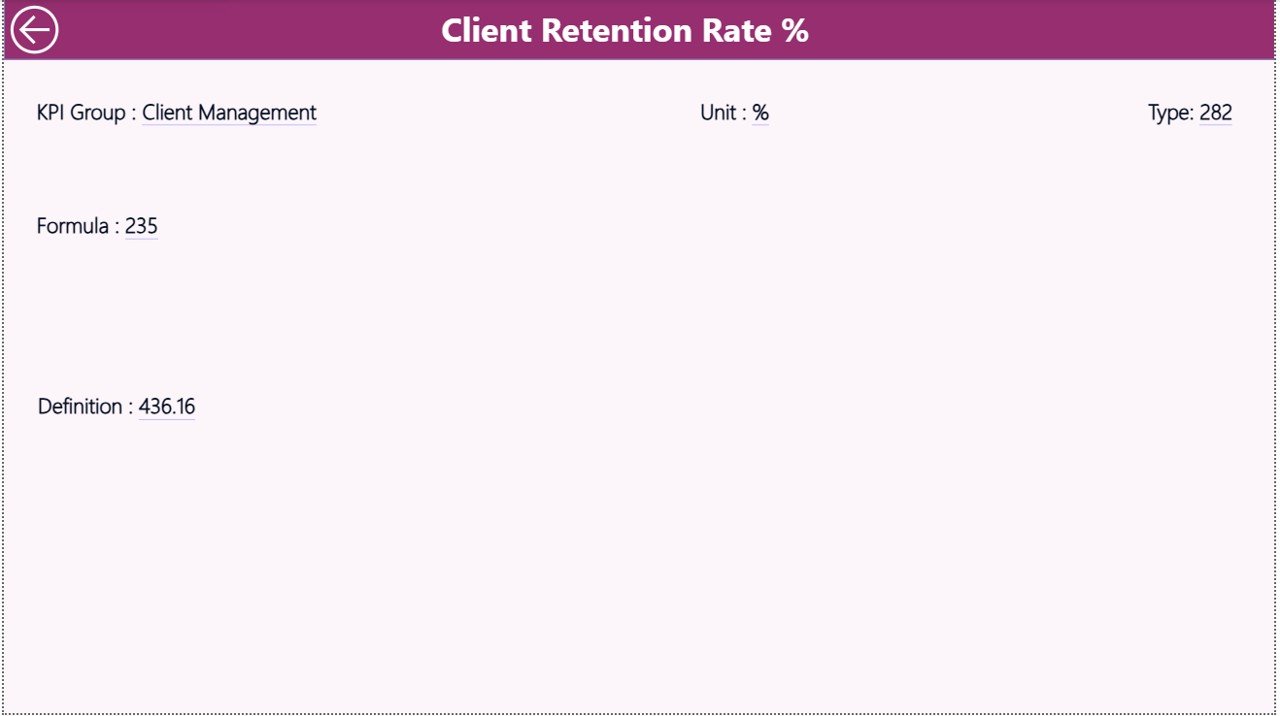
KPI Definition Page – Drill Through for Full Details
This page stays hidden because it works as a drill-through page. When you click any KPI from the summary table and choose drill-through, you view:
- KPI Number
- KPI Group
- KPI Name
- Unit
- Formula
- Definition
- Type (UTB / LTB)
This feature helps new team members understand KPIs clearly. It also ensures accurate data reporting because each KPI includes a standard definition and formula.
On the top-left corner of this page, you see a Back Button. Click it to return to the Summary Page immediately.
Click to buy Business Development KPI Dashboard in Power BI
Excel File Used as Data Source
This dashboard connects with an Excel file that contains three worksheets:
Input_Actual Sheet
You enter the actual numbers for each KPI here.
Columns include:
- KPI Name
- Month (use the first date of the month)
- Actual MTD
- Actual YTD
Input_Target Sheet
You enter the target numbers for:
- Target MTD
- Target YTD
- Month
- KPI Name
KPI Definition Sheet
You enter:
- KPI Number
- KPI Group
- KPI Name
- Unit
- Formula
- Definition
- KPI Type (UTB or LTB)
This structured approach makes it extremely easy to update data and refresh Power BI anytime.
Advantages of a Business Development KPI Dashboard in Power BI
A Business Development KPI Dashboard brings many benefits to organizations of all sizes. Below are the major advantages:
- You Monitor KPIs in Real Time
Power BI updates instantly. When you refresh the data, the entire dashboard changes. This helps teams react quickly and take better decisions.
- You Improve Lead and Deal Visibility
You see the entire pipeline—from new leads to final deals. This clarity helps you identify bottlenecks and opportunities faster.
- You Compare Target vs Actual Effortlessly
The dashboard shows MTD and YTD results side-by-side with targets and previous year data. This makes analysis smooth and quick.
- You Identify Growth Trends Faster
The trend page helps you understand:
- Seasonal patterns
- Performance gaps
- Improvement areas
- High-performing KPIs
This visibility boosts strategic planning.
- You Reduce Manual Reporting Work
You no longer create Excel reports manually. Power BI handles everything with one click. This saves time and reduces errors.
- You Strengthen Team Communication
All team members view the same KPIs. This improves coordination and keeps everyone aligned with business goals.
Best Practices for Using a Business Development KPI Dashboard in Power BI
To get maximum value from your dashboard, follow these best practices:
- Update Data Regularly
Refresh the Excel files daily or weekly so that your dashboard stays accurate.
- Keep KPI Definitions Standardized
Use clear formulas and definitions. This avoids confusion and ensures consistent reporting.
- Assign Ownership to Each KPI
Each KPI should have a responsible owner. This helps teams improve performance faster.
- Review Trends Every Month
Use the trend charts to study performance patterns. This helps you spot improvement opportunities early.
- Set Clear Targets for Each KPI
Targets help teams stay focused. Ensure your targets are realistic, measurable, and time-bound.
- Use Slicers to Deep Dive into Data
Slicers help you analyze KPIs by:
- Month
- KPI Group
- KPI Name
Use them to evaluate performance from different angles.
- Train Team Members on Dashboard Usage
Give a quick training session so everyone understands how to use drill-throughs, slicers, and refresh features.
Conclusion
A Business Development KPI Dashboard in Power BI gives you complete control over your performance metrics. It helps you move from manual reporting to an advanced and smart reporting system. When you use it properly, you understand your growth patterns clearly, improve your targets, take faster decisions, and stay ahead of your competitors.
Whether your team tracks leads, opportunities, conversions, meetings, or revenue, this dashboard brings everything together in one easy-to-read view. With interactive visuals, drill-through options, and real-time data updates, your team becomes more productive, more confident, and more strategic.
Frequently Asked Questions (FAQs)
- What is a Business Development KPI Dashboard in Power BI?
It is a visual reporting tool that helps you track key business development metrics such as leads, conversion, revenue, and performance trends.
- How does this dashboard help business development teams?
It gives real-time insights, compares performance with targets, tracks trends, and helps teams take data-driven decisions.
- Which KPIs does this dashboard track?
It tracks KPIs like lead generation, conversion %, revenue, meetings, targets, and previous year comparisons.
- Do I need advanced Power BI skills to use this dashboard?
No. Once the dashboard is set up, anyone can use slicers, charts, and drill-through features easily.
- How often should I update the Excel data?
You should update it weekly or monthly depending on your reporting needs.
- Can I add more KPIs to this dashboard?
Yes, you can add more KPIs by updating the Excel sheets and refreshing Power BI.
- Can teams use this dashboard for strategy planning?
Yes. The trend charts and YoY comparisons help you set better targets and plan stronger strategies.
Visit our YouTube channel to learn step-by-step video tutorials
Watch the step-by-step video tutorial:
Click to buy Business Development KPI Dashboard in Power BI