Railway Tech Startups Dashboard in Excel
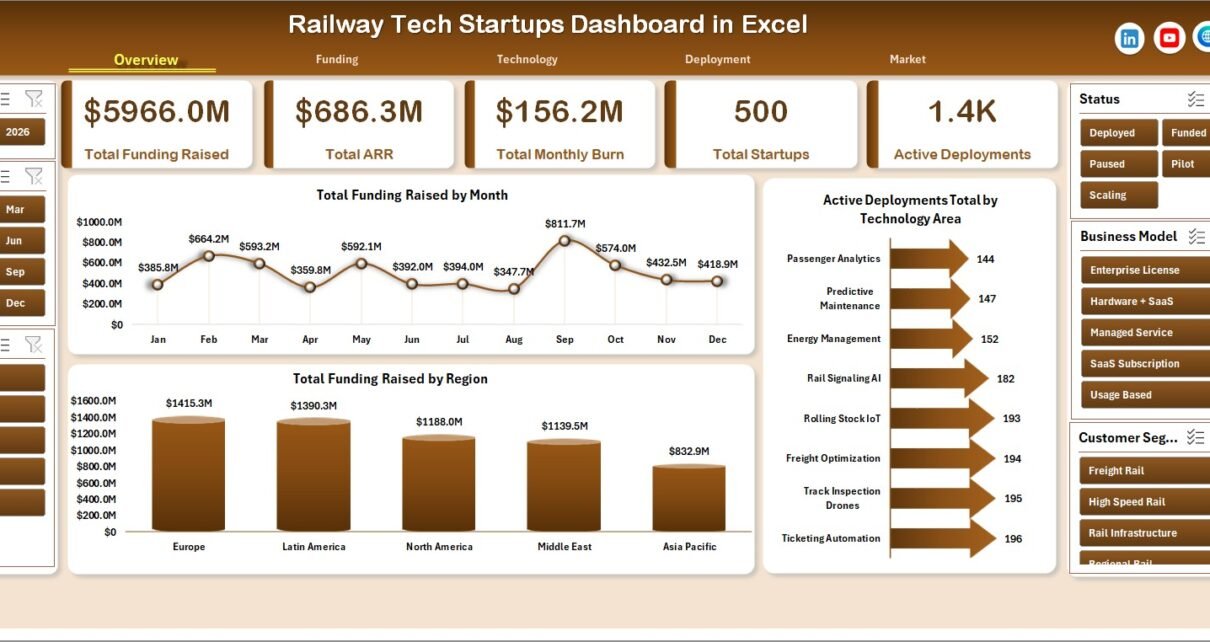
Railway Tech Startups Dashboard in Excel helps railway innovation teams, rail tech founders, accelerators, incubators, and venture analysts turn startup portfolio records into clear management reporting. Railway technology programs often