New: NextGenTemplates Academy - video courses on Excel formulas with AI and Pivot Tables & dashboards. Early-bird: 20% off with code EARLYBIRD20 - first 20 orders only. See the courses →
  • Learn Excel (Free Course)
    • 1. Shortcut Keys
    • 2. Fill & Flash Fill
    • 3. Find & Replace
    • 4. Sort & Filter
    • 5. Formulas & Functions
    • 6. Data Validation
    • 7. Conditional Formatting
    • 8. Basic Charts
    • 9. Advanced Charts
    • 10. Pivot Tables
    • 11. Excel Dashboards
    • 12. VBA Course
    • 13. Excel Formulas with AI
  • Templates
  • Tutorials
    • Charts and Visualization
    • VBA
    • Excel Tips and Tricks
    • Excel Dashboards
    • Power Pivot & DAX
  • Power BI
  • Template Store
    • Ready to Use Templates
  • Courses
  • Academy
    • Excel + AI Mastery: 100 Formulas
    • Excel Pivot Tables & Dashboards
  • About Us
  • Contact Us

PK: An Excel Expert

Transforming Data into Decisions

Dashboard

This category provides detailed tutorials on creating effective and informative dashboards in Excel. Whether you need to track your business’s key performance indicators (KPIs) or present complex data in a simplified manner, our tutorials will guide you through the process. Each tutorial comes with a free practice file for download and tutorial videos to help you follow along easily. Start your Excel dashboard tutorial now and enhance your data analysis and presentation skills with this powerful tool. Impress your colleagues and boss with insightful and attractive dashboards by exploring this category today.
Dashboard Power BI Templates

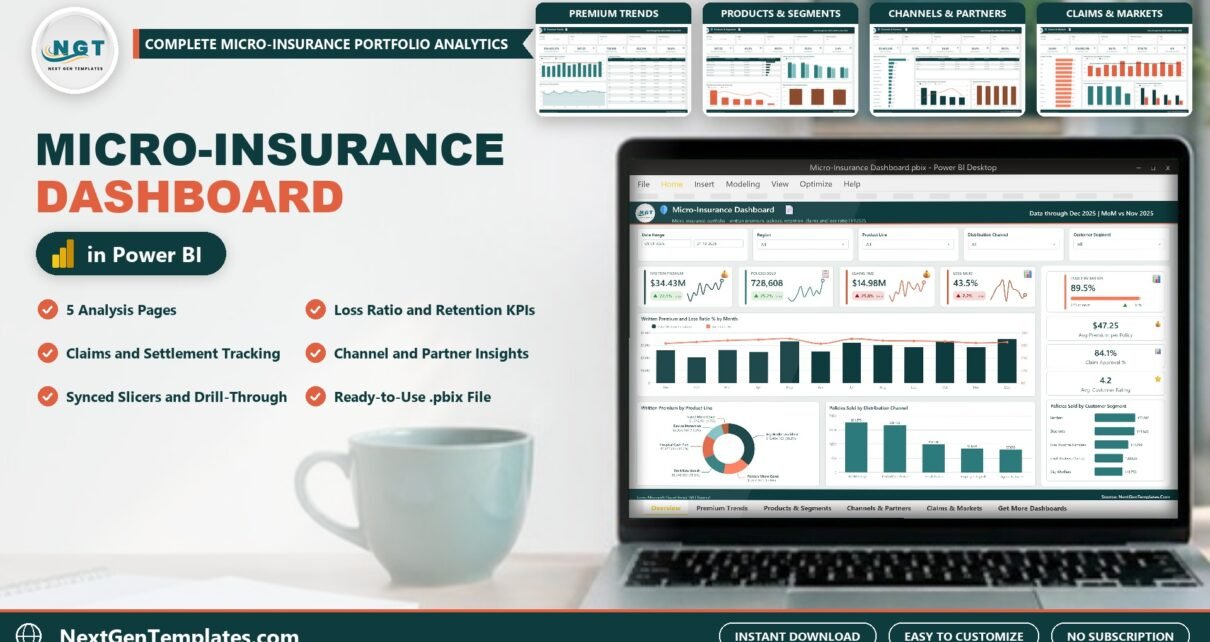
Micro-Insurance Dashboard in Power BI

October 20, 2026 PKComments Off on Micro-Insurance Dashboard in Power BI
The Micro-Insurance Dashboard in Power BI answers the question every low-cost insurance program asks: which products, channels and partners earn their premium, and where do claims eat it? It reports
Read More
Dashboard Templates

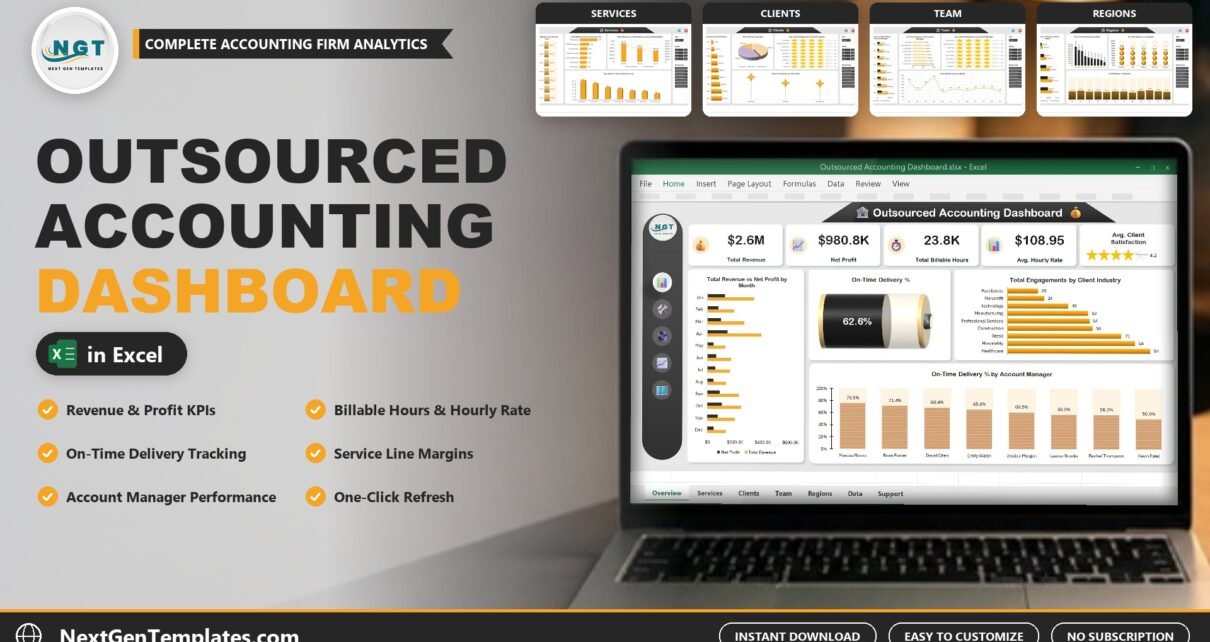
Outsourced Accounting Dashboard in Excel

October 19, 2026 PKComments Off on Outsourced Accounting Dashboard in Excel
Outsourced Accounting Dashboard in Excel is a five-page workbook for firms that run outsourced accounting, bookkeeping, payroll and advisory work. It shows where the firm makes its revenue and profit
Read More
Dashboard Power BI Templates

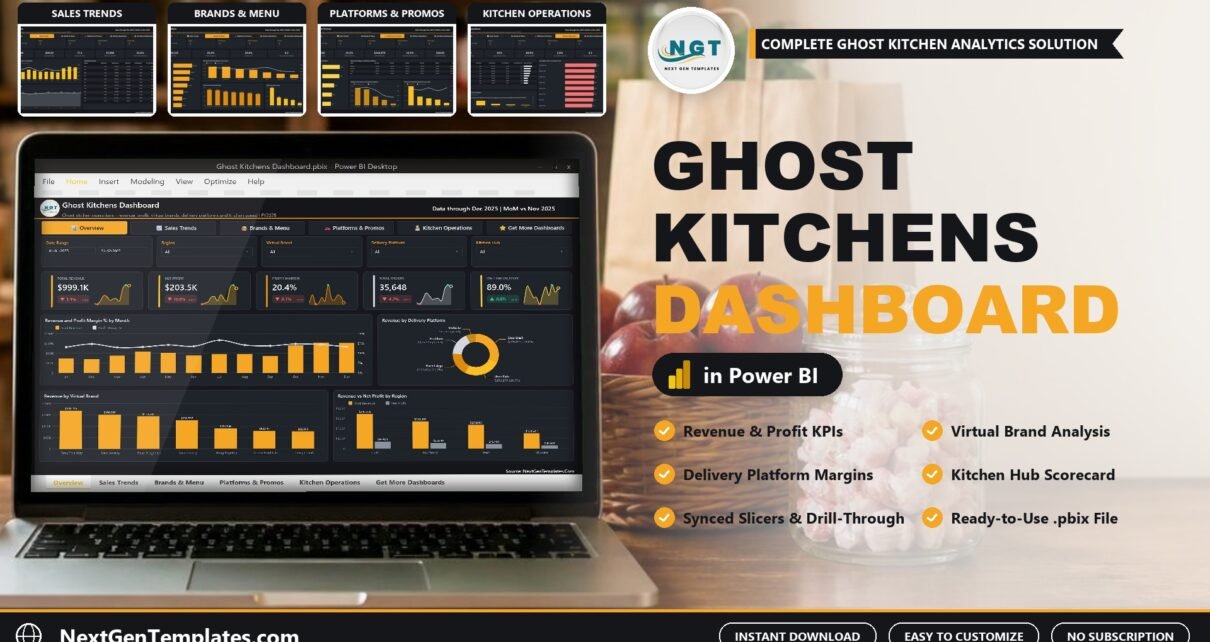
Ghost Kitchens Dashboard in Power BI

October 16, 2026 PKComments Off on Ghost Kitchens Dashboard in Power BI
The Ghost Kitchens Dashboard in Power BI answers the question every delivery-only operator eventually asks: after the apps take their cut, which brands, platforms and kitchens actually make money? It
Read More
Dashboard Templates

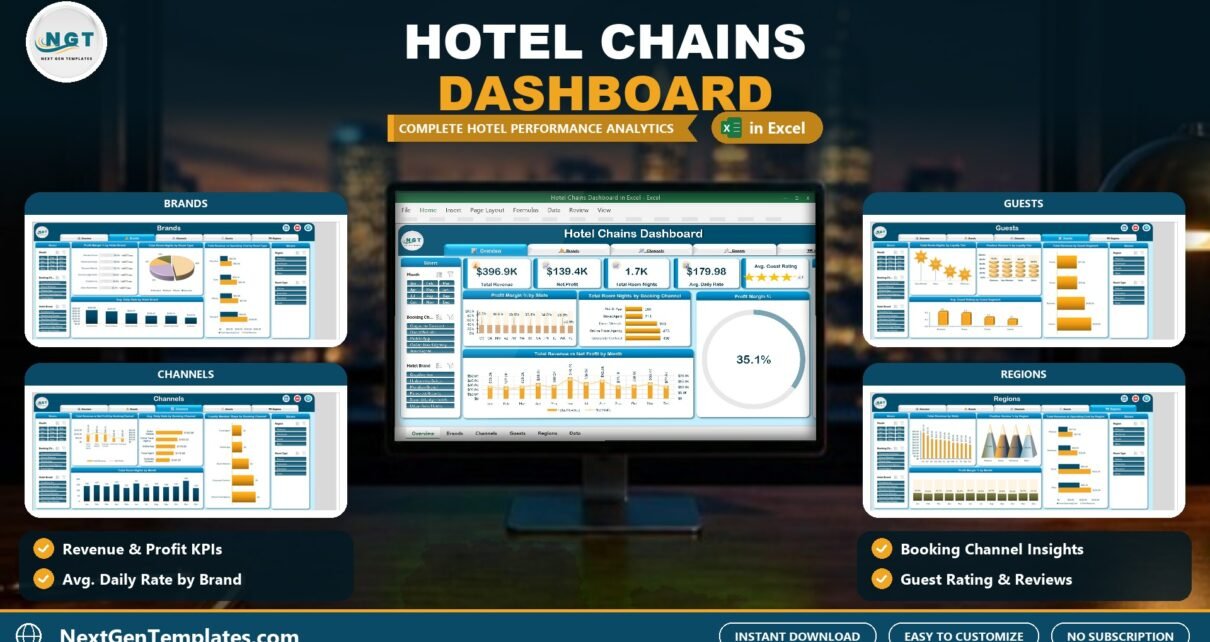
Hotel Chains Dashboard in Excel

October 16, 2026October 16, 2026 PKComments Off on Hotel Chains Dashboard in Excel
Hotel Chains Dashboard in Excel is a five-page workbook that shows where a group of hotel brands makes its revenue and profit across brands, booking channels, guest segments and regions.
Read More
Dashboard Templates

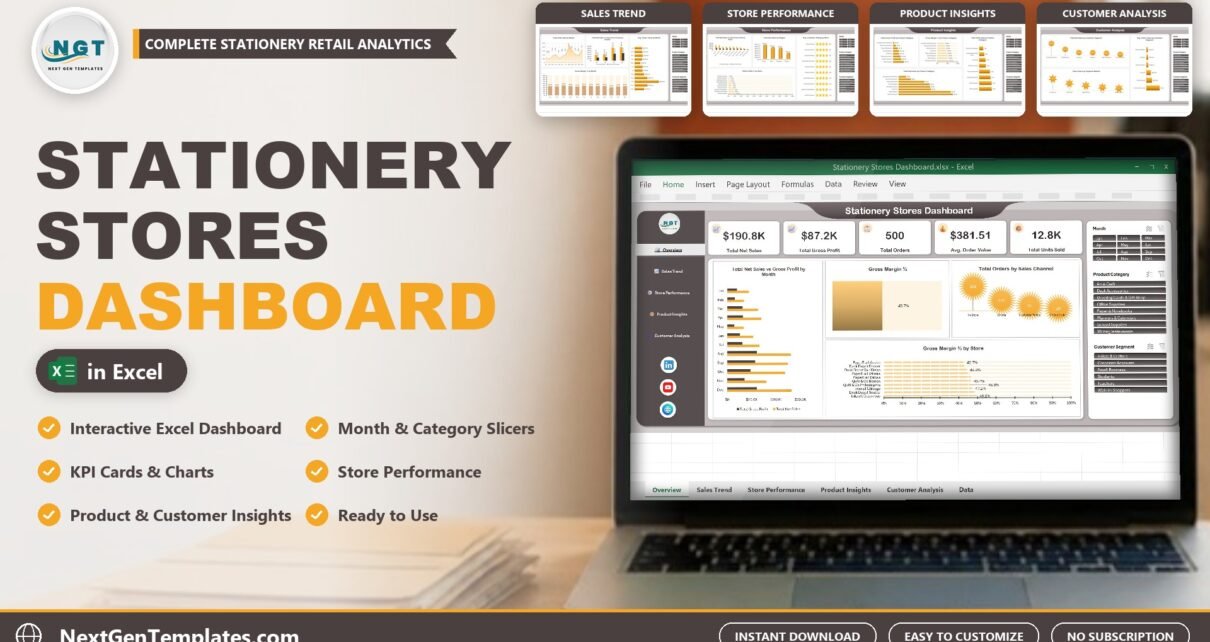
Stationery Stores Dashboard in Excel

October 8, 2026 PKComments Off on Stationery Stores Dashboard in Excel
Stationery Stores Dashboard in Excel is a five-page workbook that shows where a stationery business makes its sales and profit across stores, product categories and customer segments. The overview of
Read More
Dashboard Templates

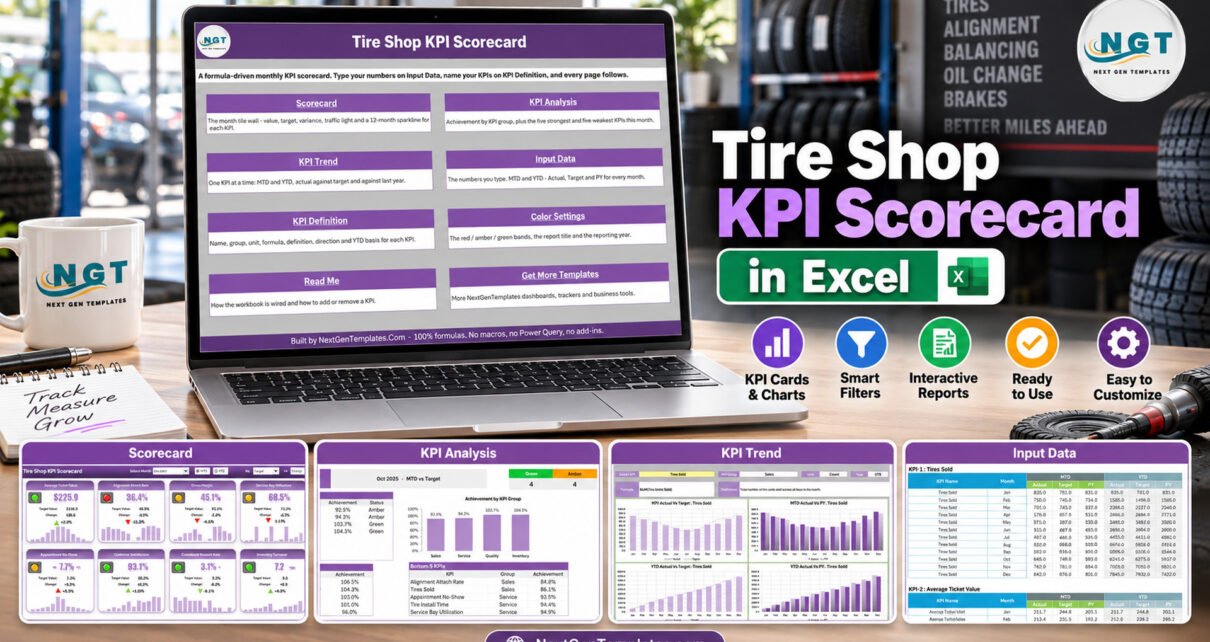
Tire Shop KPI Scorecard in Excel

September 29, 2026September 29, 2026 PKComments Off on Tire Shop KPI Scorecard in Excel
The Tire Shop KPI Scorecard in Excel puts 10 tire shop KPIs from 4 KPI groups on a single monthly page, with a month picker, an MTD / YTD switch,
Read More
Dashboard Templates

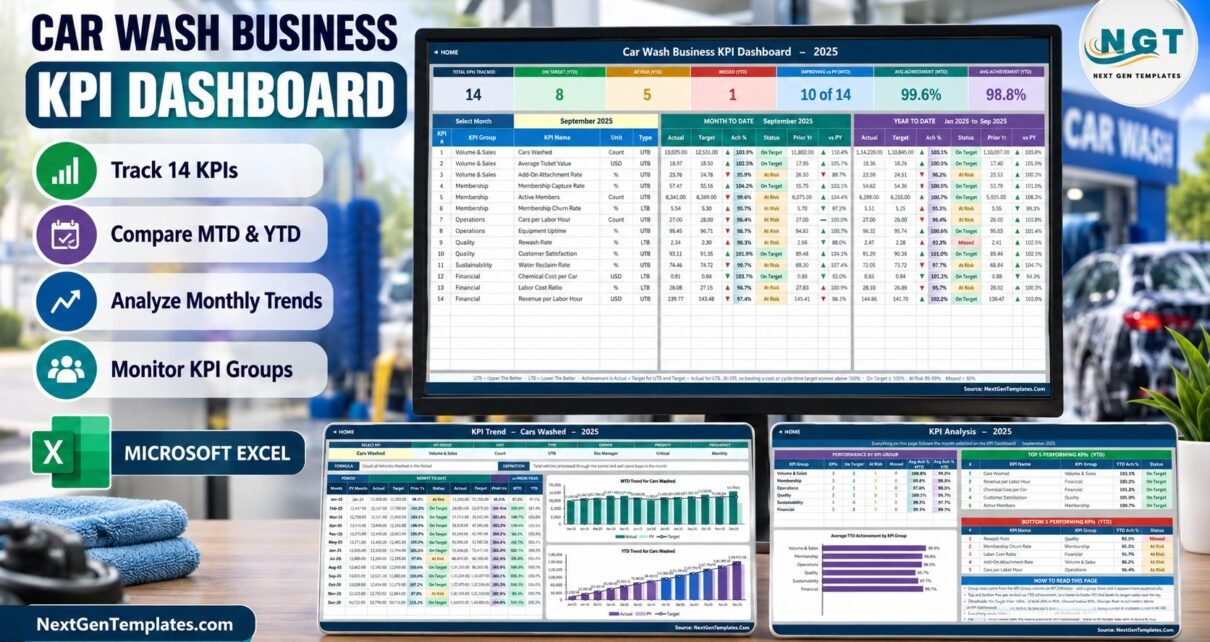
Car Wash Business KPI Dashboard in Excel

September 29, 2026September 29, 2026 PKComments Off on Car Wash Business KPI Dashboard in Excel
The Car Wash Business KPI Dashboard in Excel scores 14 car wash KPIs in 6 groups - month-to-date and year-to-date - against target and prior year, on a 10-sheet workbook
Read More
Dashboard Templates

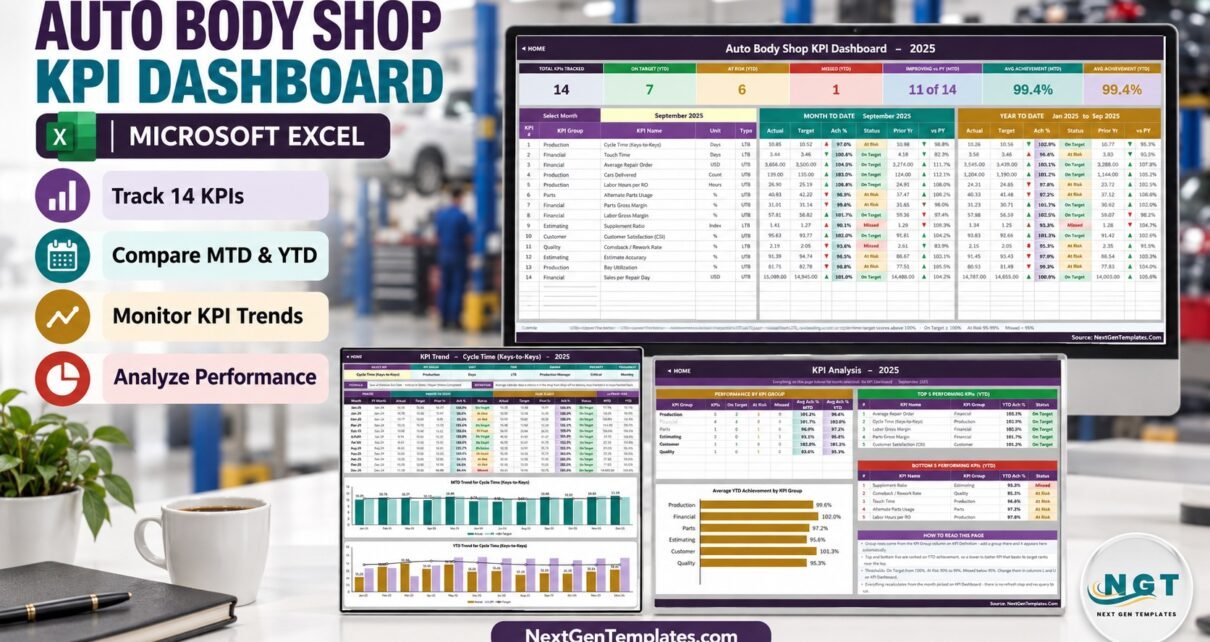
Auto Body Shop KPI Dashboard in Excel

September 28, 2026September 28, 2026 PKComments Off on Auto Body Shop KPI Dashboard in Excel
The Auto Body Shop KPI Dashboard in Excel turns a collision shop's monthly numbers into one scored view: 14 KPIs in 6 groups, each measured month to date and year
Read More
Dashboard Templates

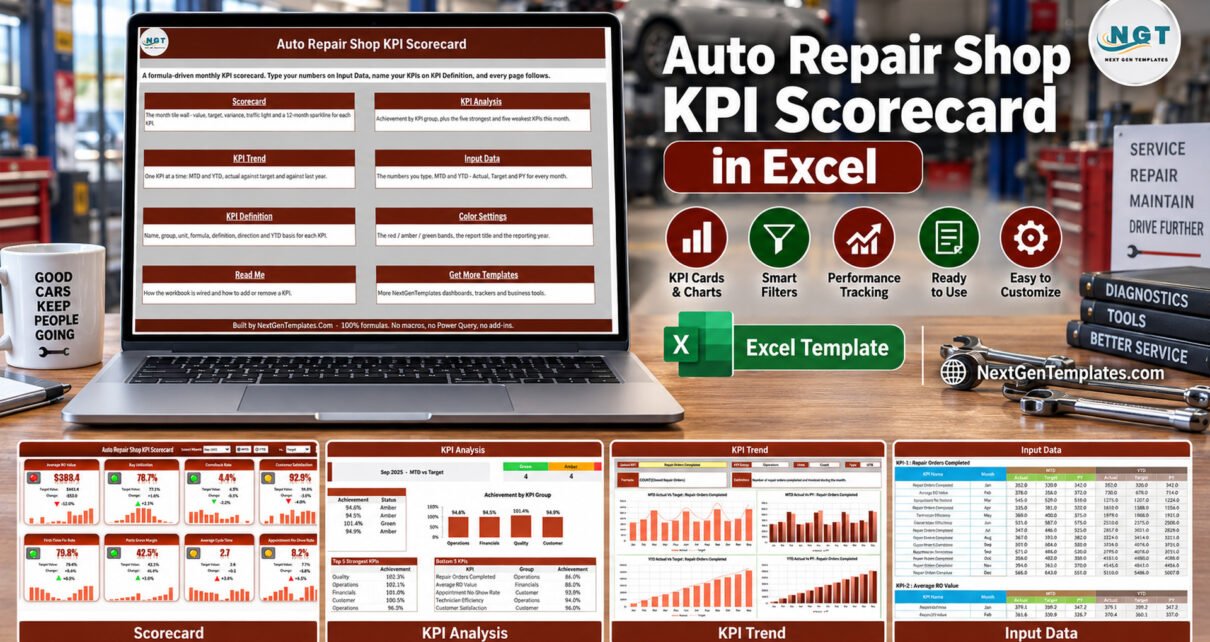
Auto Repair Shop KPI Scorecard in Excel

September 28, 2026September 28, 2026 PKComments Off on Auto Repair Shop KPI Scorecard in Excel
Ask the owner of an auto repair shop how last month went and you usually get a story. The bays were full, one technician was off for a week, two
Read More
Dashboard Templates

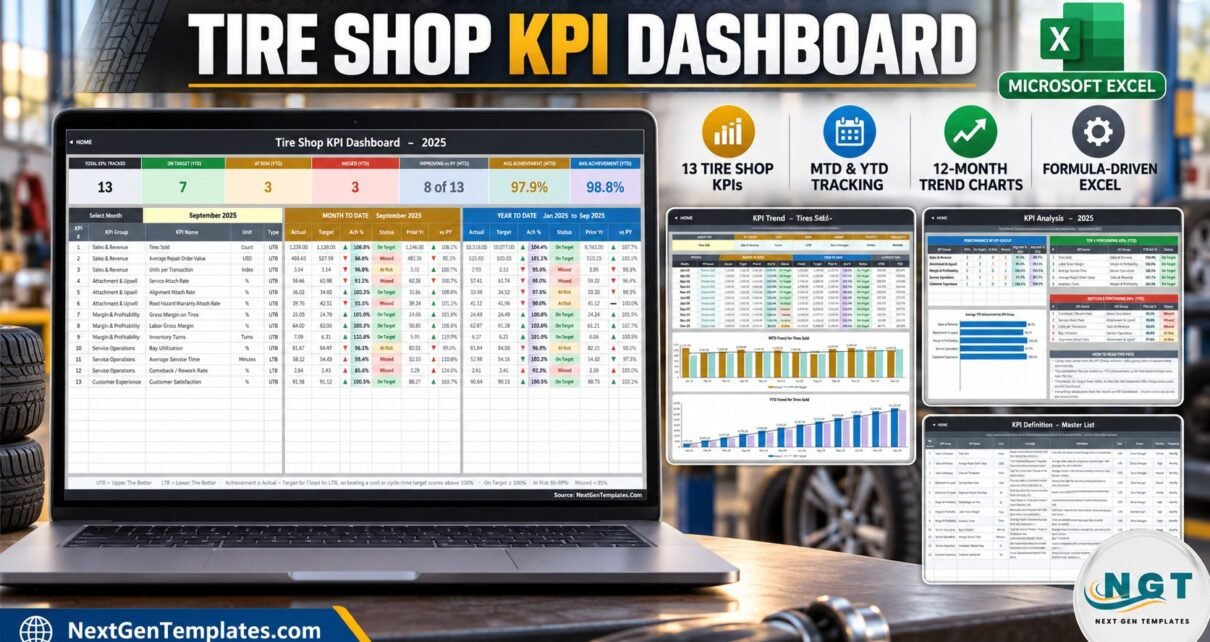
Tire Shop KPI Dashboard in Excel

September 28, 2026September 28, 2026 PKComments Off on Tire Shop KPI Dashboard in Excel
The Tire Shop KPI Dashboard in Excel puts 13 tire-shop KPIs, 5 KPI groups and 11 worksheets behind a single month dropdown. Pick a month in one cell and seven
Read More

Posts pagination

1 2 … 315 Next
  • Learn Excel (Free Course)
    • 1. Shortcut Keys
    • 2. Fill & Flash Fill
    • 3. Find & Replace
    • 4. Sort & Filter
    • 5. Formulas & Functions
    • 6. Data Validation
    • 7. Conditional Formatting
    • 8. Basic Charts
    • 9. Advanced Charts
    • 10. Pivot Tables
    • 11. Excel Dashboards
    • 12. VBA Course
    • 13. Excel Formulas with AI
  • Templates
  • Tutorials
    • Charts and Visualization
    • VBA
    • Excel Tips and Tricks
    • Excel Dashboards
    • Power Pivot & DAX
  • Power BI
  • Template Store
    • Ready to Use Templates
  • Courses
  • Academy
    • Excel + AI Mastery: 100 Formulas
    • Excel Pivot Tables & Dashboards
  • About Us
  • Contact Us
Copyright © 2023 PK-AnExcelExpert.com - Privacy Policy