The chemical manufacturing industry runs on precision, speed, and safety. Every batch, process, machine, and material must work without interruptions because even a small delay can impact production, quality, compliance, and profitability. Because of this fast-moving environment, teams need a powerful way to monitor their performance in real time. A Chemical Manufacturing KPI Dashboard in Excel solves this challenge.
This dashboard helps users track essential KPIs, compare actual performance with targets, forecast trends, and improve decision-making. Since it works fully in Excel, anyone can use it without learning complex tools.
In this detailed article, you will learn:
What a Chemical Manufacturing KPI Dashboard in Excel is
Why chemical companies need KPI dashboards
How each worksheet in the dashboard works
Key advantages
Best practices
Common questions
And how this dashboard supports accurate reporting and continuous improvement
Let’s explore everything step by step.
Click to buy Chemical Manufacturing KPI Dashboard in Excel
What Is a Chemical Manufacturing KPI Dashboard in Excel?
A Chemical Manufacturing KPI Dashboard in Excel is a ready-to-use reporting system that tracks the most important Key Performance Indicators (KPIs) across production, equipment, safety, quality, and supply chain operations. The dashboard converts raw data into clean visuals so managers can understand performance at a glance.
This dashboard includes:
- Monthly and yearly performance metrics
- Actual vs target vs previous year comparison
- Trend charts
- KPI definitions
- Structured data input sheets
- Automated visuals with conditional formatting
- Interactive drop-downs for quick navigation
Teams can view their MTD (Month-to-Date) and YTD (Year-to-Date) performance, study trends, and compare progress with historical data. Because Excel manages all logic, users only input new numbers and the dashboard updates automatically.
Why Do Chemical Manufacturers Need a KPI Dashboard in Excel?
Chemical manufacturing involves continuous processes, high-value materials, strict compliance laws, and critical safety requirements. Managers must track metrics like production volume, equipment downtime, yield percentage, defect rates, energy usage, and turnaround time.
Without a central dashboard:
- Teams spend hours collecting data.
- Managers work with outdated reports.
- Decision-making slows down.
- Teams miss early warning signals.
- Companies struggle with consistency.
A KPI dashboard prevents these issues. It creates a single source of truth and keeps everyone aligned with the company’s goals.
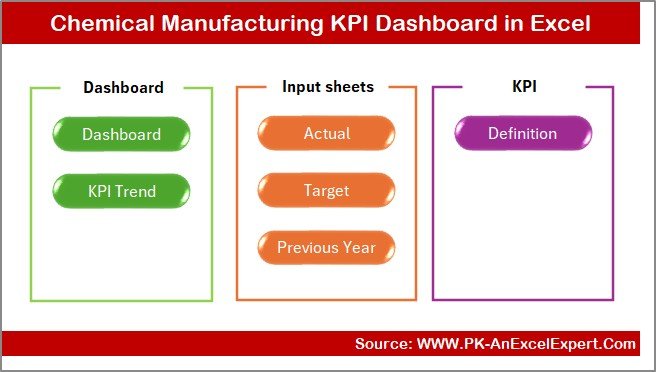
How Many Worksheets Does the Dashboard Contain?
The Chemical Manufacturing KPI Dashboard in Excel includes 7 functional worksheets:
Summary Page
Dashboard Sheet
Trend Sheet
Actual Numbers Input Sheet
Target Sheet
Previous Year Sheet
KPI Definition Sheet
Each worksheet supports a different part of the reporting workflow.
Let’s explore each one.
Summary Page – What Does It Include?
The Summary Page works as the index page.
It includes navigation buttons that make it easy to jump to any sheet in one click.
This page includes six main buttons:
- Dashboard
- Trend
- Actual Numbers
- Target
- Previous Year
- KPI Definitions
This setup removes confusion and saves time because the user does not scroll through multiple tabs.
Click to buy Chemical Manufacturing KPI Dashboard in Excel
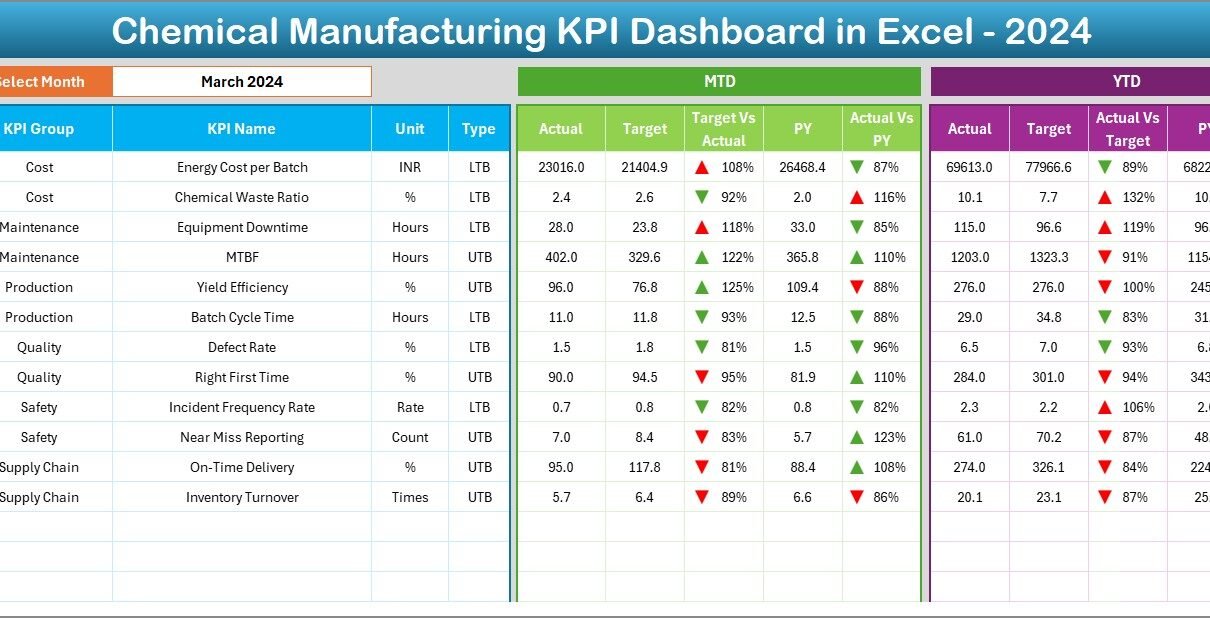
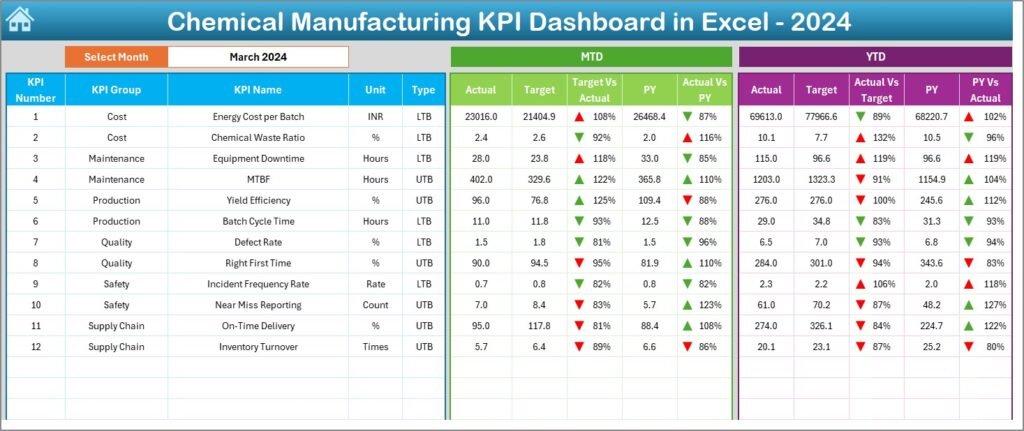
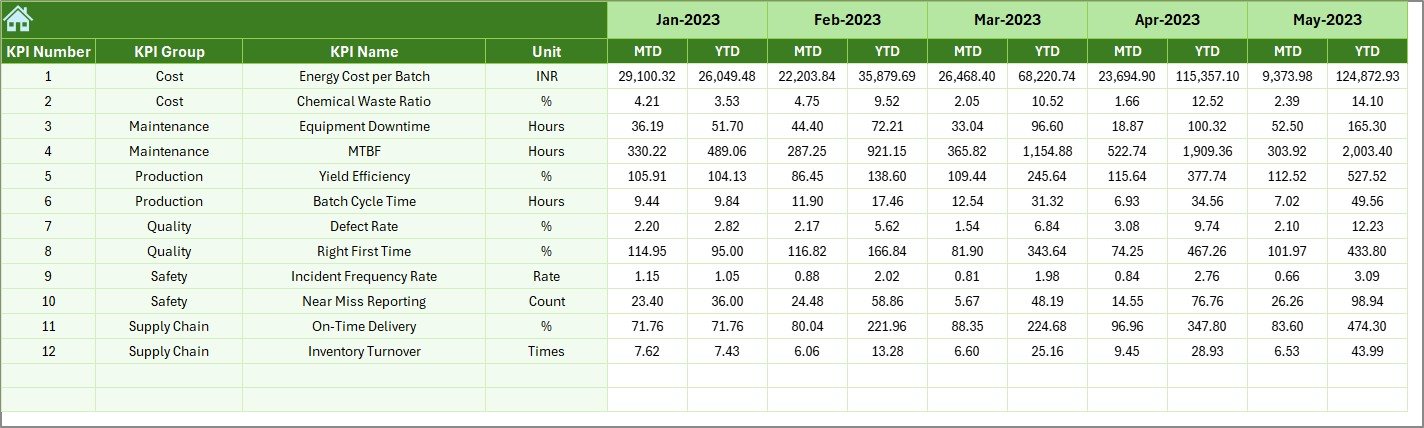
Dashboard Sheet – How Does It Show the KPI Performance?
The Dashboard Sheet is the heart of the template. It displays all KPI metrics on one page and updates automatically when the user selects a month.
Month Selector
Users select the reporting month from the drop-down menu in cell D3.
The dashboard then updates:
- Actual values
- Target values
- Previous year values
- MTD performance
- YTD performance
KPI Comparison
The dashboard shows:
- MTD Actual vs Target
- MTD Actual vs Previous Year
- YTD Actual vs Target
- YTD Actual vs Previous Year
Each comparison includes up & down arrows through conditional formatting:
Arrow Up → Performance improved
Arrow Down → Performance declined
This visual approach helps users identify issues instantly.
Click to buy Chemical Manufacturing KPI Dashboard in Excel
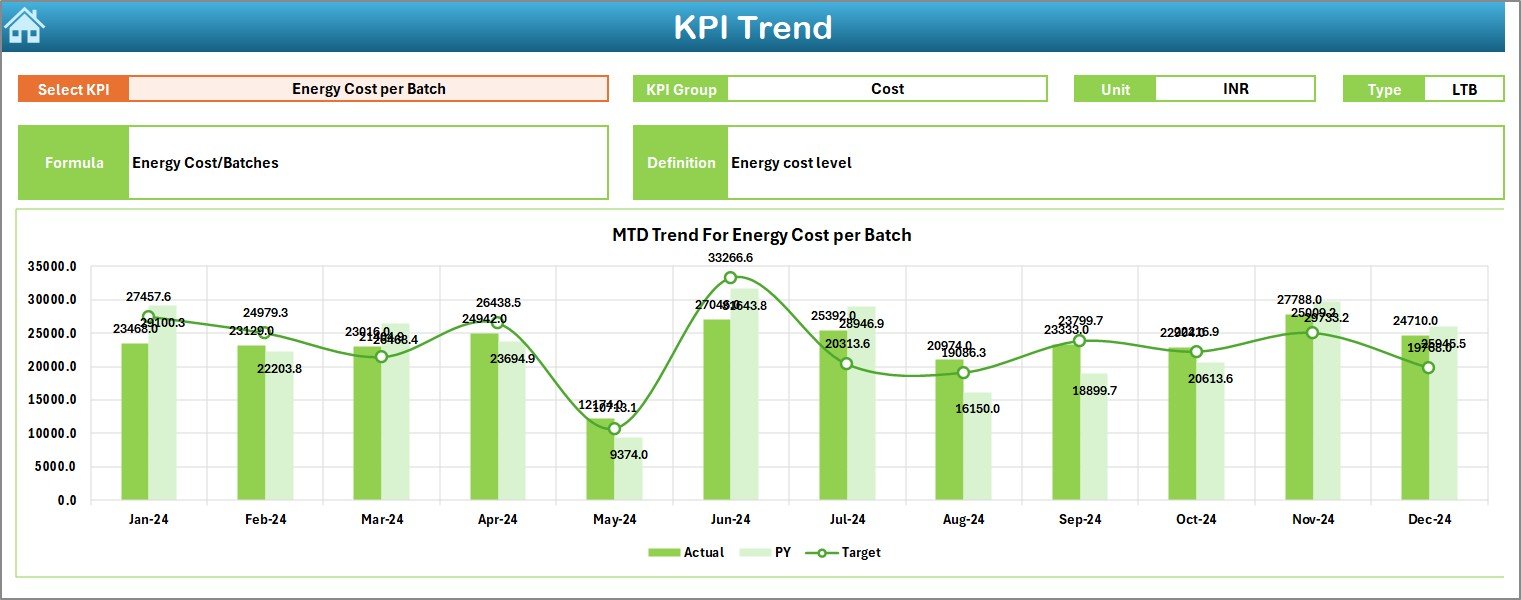
Trend Sheet – How Does It Track Performance Over Time?
On the Trend Sheet, users select a specific KPI from a drop-down list located in cell C3. After selecting the KPI, the sheet displays:
KPI Information
- KPI Group
- Unit of Measurement
- KPI Type (Lower the Better or Upper the Better)
- Formula Used
- KPI Definition
Trend Charts
The sheet shows two charts:
- MTD Trend Chart: Monthly Actual, Target, and Previous Year values
- YTD Trend Chart: Cumulative values for the year
These charts help users study patterns, predict future performance, and identify potential risks.
Click to buy Chemical Manufacturing KPI Dashboard in Excel
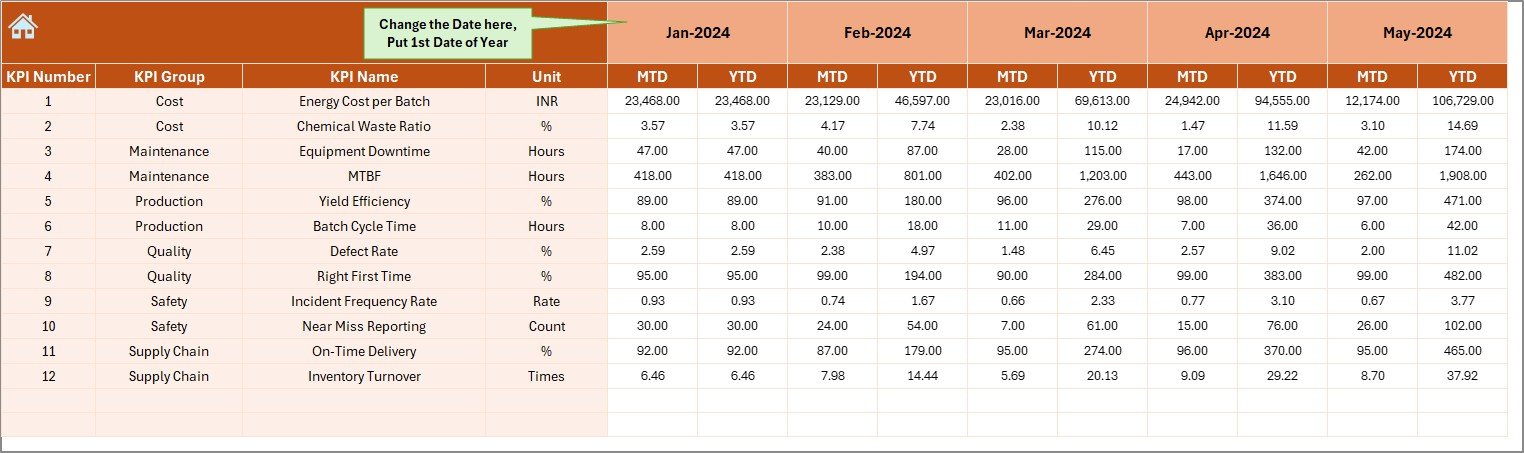
Actual Numbers Input Sheet – How Do Users Enter Data?
This sheet lets users enter actual values for both MTD and YTD.
Month Selection
Users select the start month of the year in cell E1.
Data Input
For every KPI:
- Enter MTD Actual
- Enter YTD Actual
Once users enter these numbers, the dashboard updates instantly.
Target Sheet – Where Do You Enter Target KPIs?
The Target Sheet contains all target numbers for each month.
Users enter:
- MTD Target
- YTD Target
This helps teams measure how well they perform against their monthly and yearly goals.
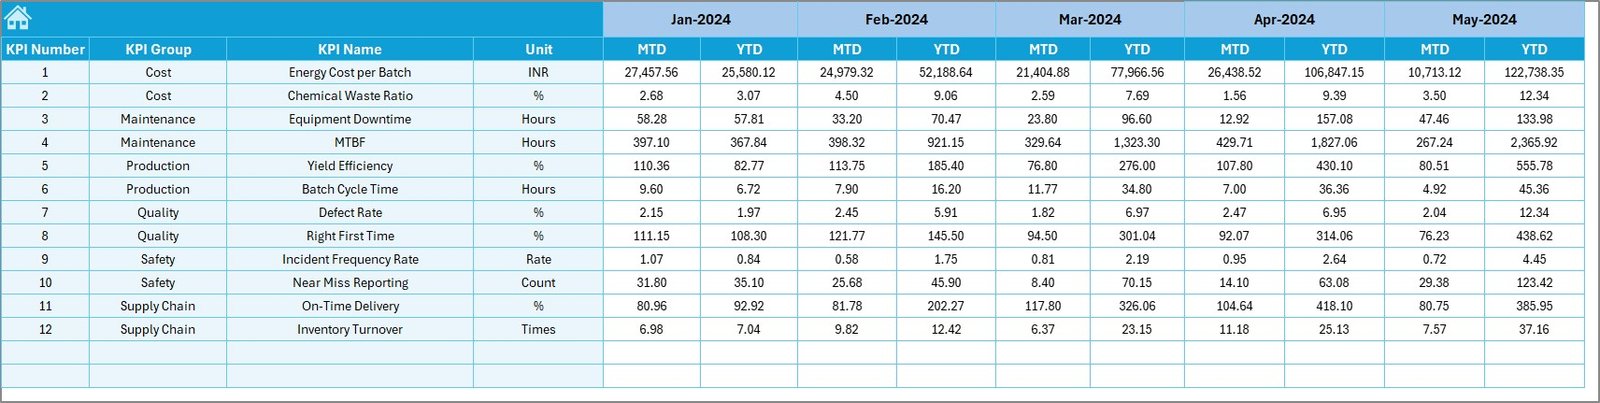
Previous Year Numbers Sheet – Why Is It Important?
This sheet stores last year’s performance data.
Users enter:
- MTD Previous Year
- YTD Previous Year
Comparing current values with previous year data helps companies:
- Track progress
- Understand performance patterns
- Plan improvements
- Benchmark achievements
This comparison also provides historical context.
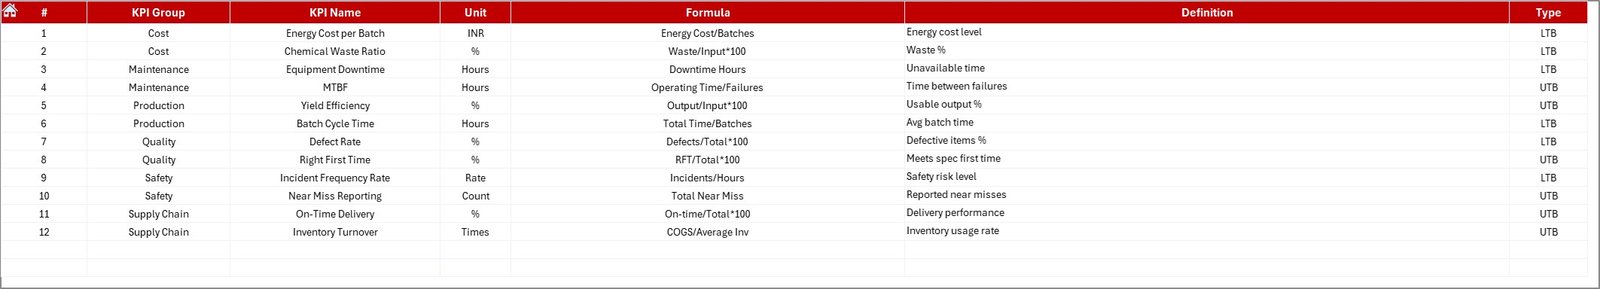
KPI Definition Sheet – What Does It Contain?
This sheet contains the full list of KPI definitions.
For each KPI, the sheet includes:
- KPI Name
- KPI Group
- Unit
- Formula
- Definition
- Type (UTB or LTB)
This keeps the entire dashboard consistent and avoids confusion between teams.
What KPIs Can This Dashboard Track?
Chemical manufacturing companies track a wide range of KPIs. Some of the most common include:
Production KPIs
- Batch Cycle Time
- Production Volume
- Yield Percentage
- Throughput Rate
Quality KPIs
- Defect Rate
- First Pass Yield
- Rework Percentage
Safety KPIs
- Incident Rate
- Lost Time Injury Rate
- Safety Compliance Score
Equipment KPIs
- Downtime
- Maintenance Cost
- OEE (Overall Equipment Effectiveness)
Supply Chain KPIs
- Inventory Turnover
- Order Fulfillment Time
- Raw Material Cost
The dashboard can track all these KPIs and more.
Advantages of Chemical Manufacturing KPI Dashboard in Excel
A Chemical Manufacturing KPI Dashboard in Excel offers many benefits. Below are the most important advantages:
- Easy to Use
Users do not need advanced technical skills. Excel makes the dashboard simple and accessible.
- Full Visibility
Teams get a clear view of production, quality, safety, equipment, and supply chain metrics in one place.
- Real-Time Insights
Once users enter the data, the dashboard updates automatically. Managers never work with old reports.
- Quick Decision-Making
The dashboard highlights low performance areas, trends, and improvement opportunities. Managers act faster.
- Better Goal Tracking
The dashboard compares actual values with target and historical values. This improves accountability.
- Customizable Template
Users can add more KPIs, sheets, formulas, or visuals according to their needs.
- Cost-Effective
Excel eliminates the need for expensive BI tools. Teams use the software they already have.
- Encourages Continuous Improvement
Trend charts allow users to find patterns and improve performance every month.
Best Practices for the Chemical Manufacturing KPI Dashboard in Excel
To get the best results from this dashboard, follow these best practices:
- Update Data Regularly
Enter actual values as soon as they are available. Delayed data reduces accuracy.
- Use Clean and Standardized Data
Avoid inconsistent values, units, or formats. Standardized input prevents calculation errors.
- Review Targets Every Quarter
Update target values based on demand, production capacity, and global conditions.
- Track High-Impact KPIs First
Focus on KPIs that directly affect production cost, quality, and safety.
- Analyze Trends Instead of Single Values
Trends provide better insight than isolated data points.
- Use KPI Definitions
Ensure all departments use the same KPI meaning. This avoids confusion in reports.
- Automate Where Possible
Use formulas, conditional formatting, and structured tables to reduce manual work.
- Protect Critical Sheets
Lock formulas or sheets to prevent accidental edits.
- Train Team Members
Help users understand how to input data, select months, and read dashboards.
- Keep Visuals Simple
Avoid clutter. Use clean charts and easy-to-read metrics.
Conclusion
The Chemical Manufacturing KPI Dashboard in Excel gives companies a powerful way to monitor their production, quality, safety, and supply chain performance. It brings clarity to complex processes and ensures that everyone uses accurate, updated information. With interactive charts, target comparisons, conditional formatting, and trend analysis, this dashboard makes reporting faster, simpler, and more effective.
Chemical manufacturers use this tool to track daily performance, make data-driven decisions, and improve operational efficiency. Because it works fully in Excel, any team can adopt it without extra training or investment.
This dashboard becomes an essential part of continuous improvement and helps organizations stay competitive in today’s dynamic chemical industry.
Frequently Asked Questions (FAQs)
- What KPIs should a chemical manufacturing company track?
Chemical companies should track production KPIs, quality KPIs, safety KPIs, equipment KPIs, and supply chain KPIs. Examples include yield percentage, defect rate, OEE, downtime, and inventory turnover.
- Do I need advanced Excel skills to use this dashboard?
No. The dashboard uses drop-downs, formulas, and charts that update automatically. Anyone with basic Excel knowledge can use it.
- How often should I update the KPI data?
You should update the data weekly or monthly. More frequent updates will give better visibility.
- Can I add more KPIs to the dashboard?
Yes. You can add new KPIs in the KPI Definition Sheet and update the related formulas.
- Why does the dashboard compare Actual vs Target vs Previous Year?
This comparison helps companies measure progress, evaluate goals, and understand long-term performance patterns.
- Does the dashboard support MTD and YTD analysis?
Yes. The dashboard displays both Month-to-Date and Year-to-Date metrics clearly.
- Can I customize the charts and visuals?
Yes. Excel allows users to change chart types, colors, layouts, and formatting.
Visit our YouTube channel to learn step-by-step video tutorials
Click to buy Chemical Manufacturing KPI Dashboard in Excel