In the construction industry, tracking project performance, managing budgets, and ensuring safety are key to success. The Construction Dashboard in Power BI is a ready-to-use tool that offers a comprehensive overview of multiple projects, budgets, costs, safety incidents, and more. By leveraging Power BI’s powerful visualization capabilities, this dashboard allows you to monitor construction projects in real-time and make data-driven decisions.
In this article, we will explain the features of the Construction Dashboard in Power BI and how it can be used to enhance project management, cost tracking, and safety monitoring across multiple construction projects.
What is the Construction Dashboard in Power BI?
The Construction Dashboard in Power BI is a tool designed to help project managers and construction teams track and manage their projects more effectively. This dashboard offers insights into key metrics such as project costs, safety incidents, budget vs cost comparisons, contractor performance, and departmental performance.
The dashboard consists of multiple pages that provide different insights into the construction projects:
Key Features of the Construction Dashboard in Power BI
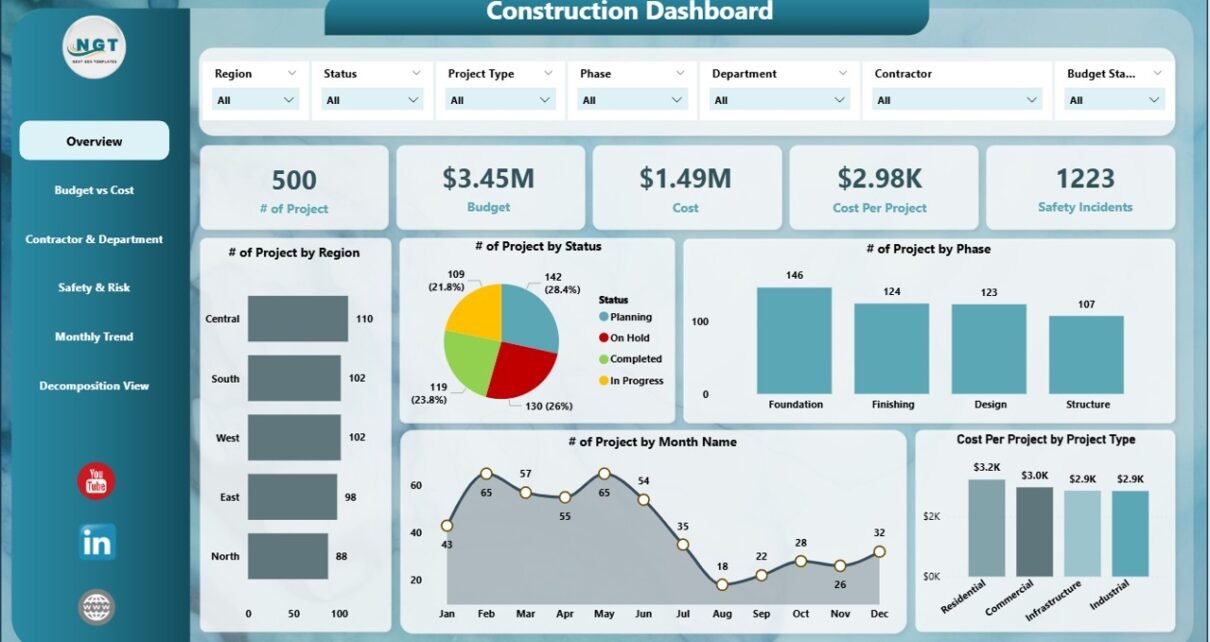
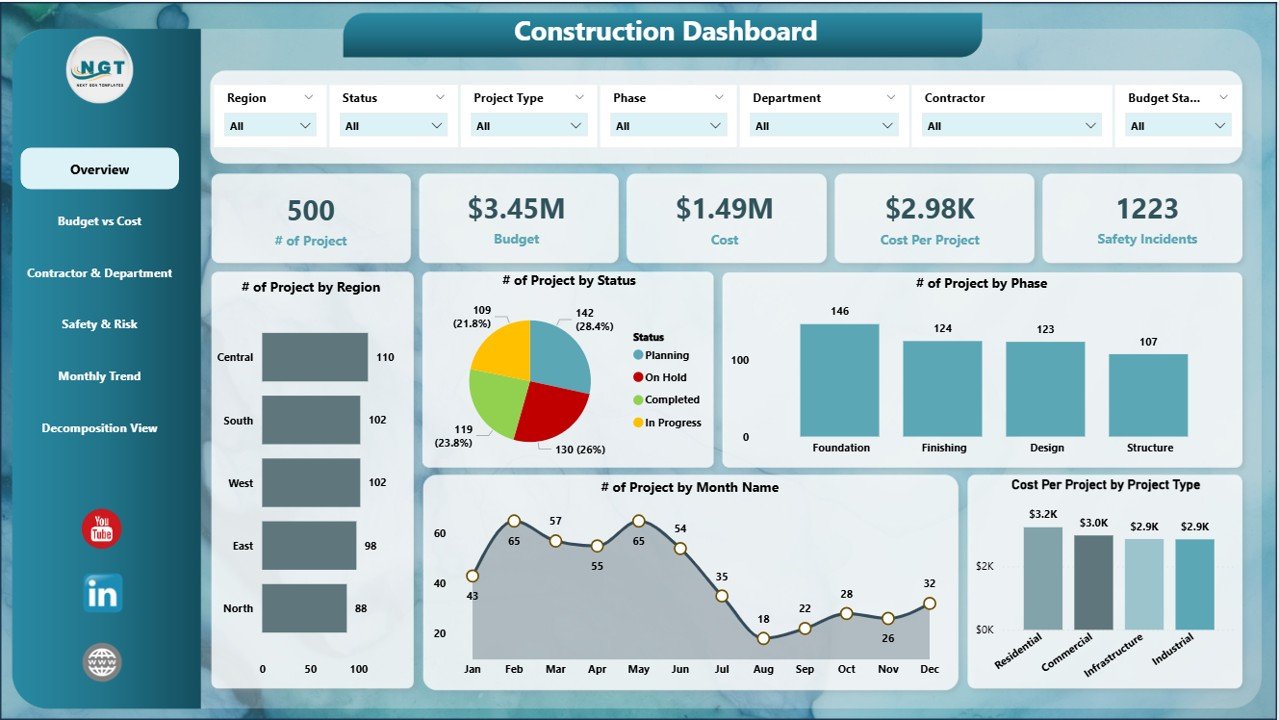
1) Overview Page: High-Level Project Metrics
The Overview Page provides a snapshot of the key metrics for all tracked projects. This page includes:
Cards:
- # of Projects: Displays the total number of projects being tracked.
- Budget: The total allocated budget for all projects.
- Cost: The total cost incurred for all projects.
- Cost per Project: The average cost for each project.
- Safety Incidents: The total number of safety incidents across all projects.
Charts:
- # of Projects by Region: Shows the number of projects by geographic region (e.g., North, South, East, West).
- # of Projects by Status: Breaks down projects by their current status (e.g., completed, in progress, pending).
- # of Projects by Phase: Categorizes projects by their current phase (e.g., design, construction, finishing).
- # of Projects by Month Name: Tracks the number of projects started or ongoing each month.
- Cost Per Project by Project Type: Displays the cost per project for different project types (e.g., industrial, residential, commercial).
This page provides a comprehensive overview of your construction portfolio, allowing you to monitor project progress, budget allocation, and safety performance.
Click to buy Construction Dashboard in Power BI
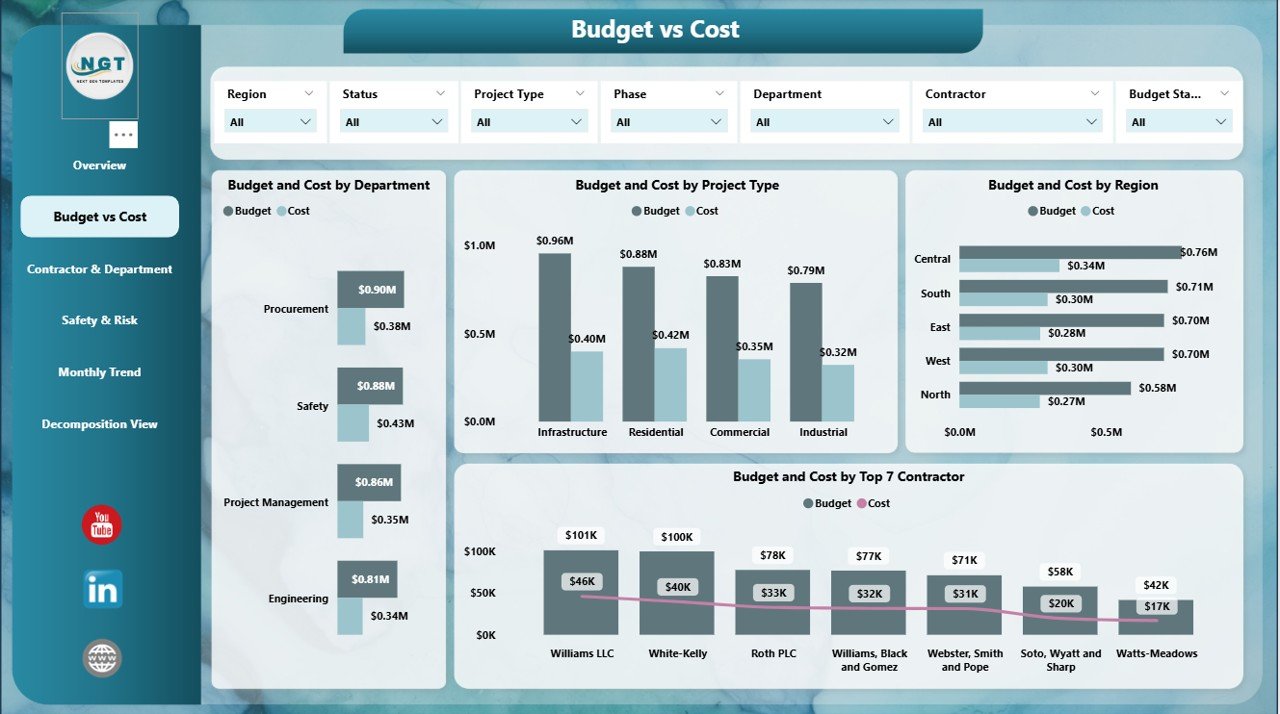
2) Budget vs Cost Page: Comparing Project Budgets with Actual Costs
The Budget vs Cost Page allows you to compare the budgeted amount against the actual cost for each project. It includes the following charts:
Charts:
- Budget and Cost by Department: Displays the budget and actual costs broken down by department (e.g., safety, engineering, procurement).
- Budget and Cost by Project Type: Tracks budget and cost by project type, helping to monitor expenses across different project categories.
- Budget and Cost by Region: Compares budget and cost for each region to identify any regional discrepancies.
- Budget and Cost by Top 7 Contractors: Shows the budget and cost associated with the top contractors, providing insights into contractor performance.
This page is essential for tracking how well projects are adhering to their budgets and identifying areas where costs may be exceeding expectations.’
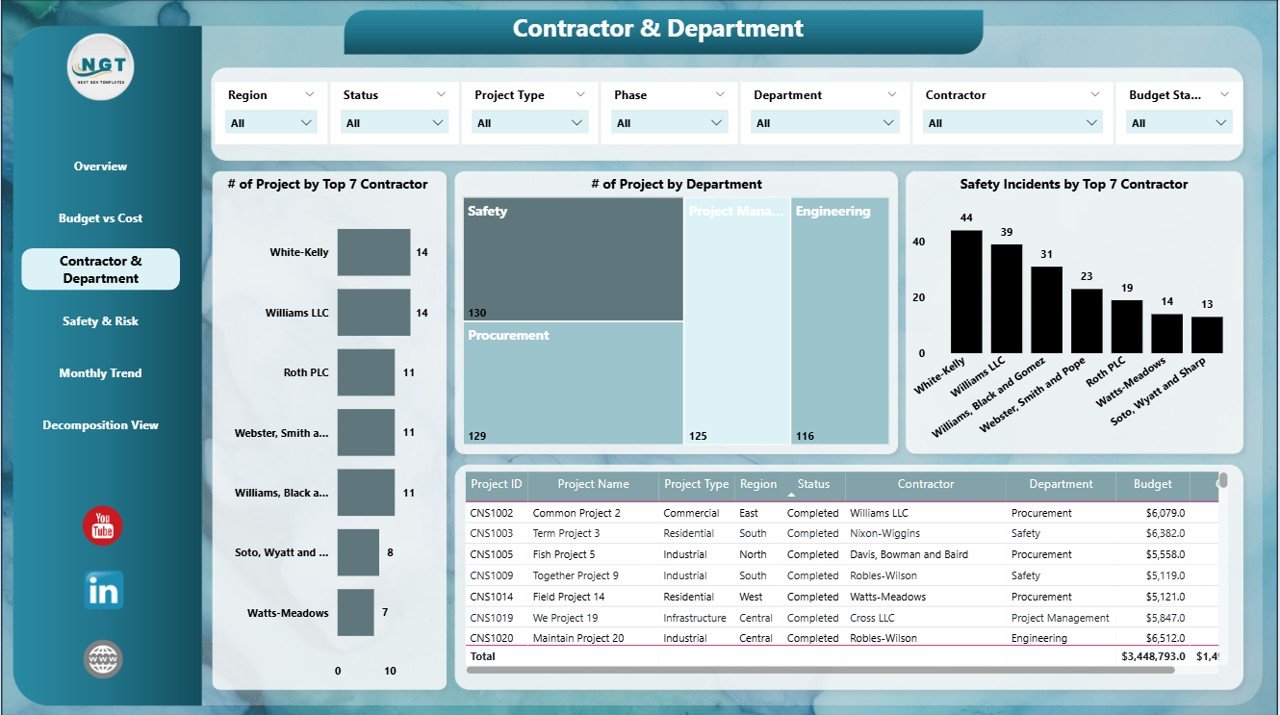
3) Contractor & Department Page: Tracking Contractor and Department Performance
The Contractor & Department Page focuses on tracking contractor and departmental performance in relation to project execution. Features include:
Charts:
- # of Projects by Top 7 Contractors: Shows the number of projects managed by the top 7 contractors.
- # of Projects by Department: Breaks down projects by department, allowing you to assess the distribution of work.
- Safety Incidents by Top 7 Contractors: Tracks the number of safety incidents for each of the top 7 contractors.
This page helps identify which contractors and departments are handling the most projects, as well as their safety performance.
Click to buy Construction Dashboard in Power BI
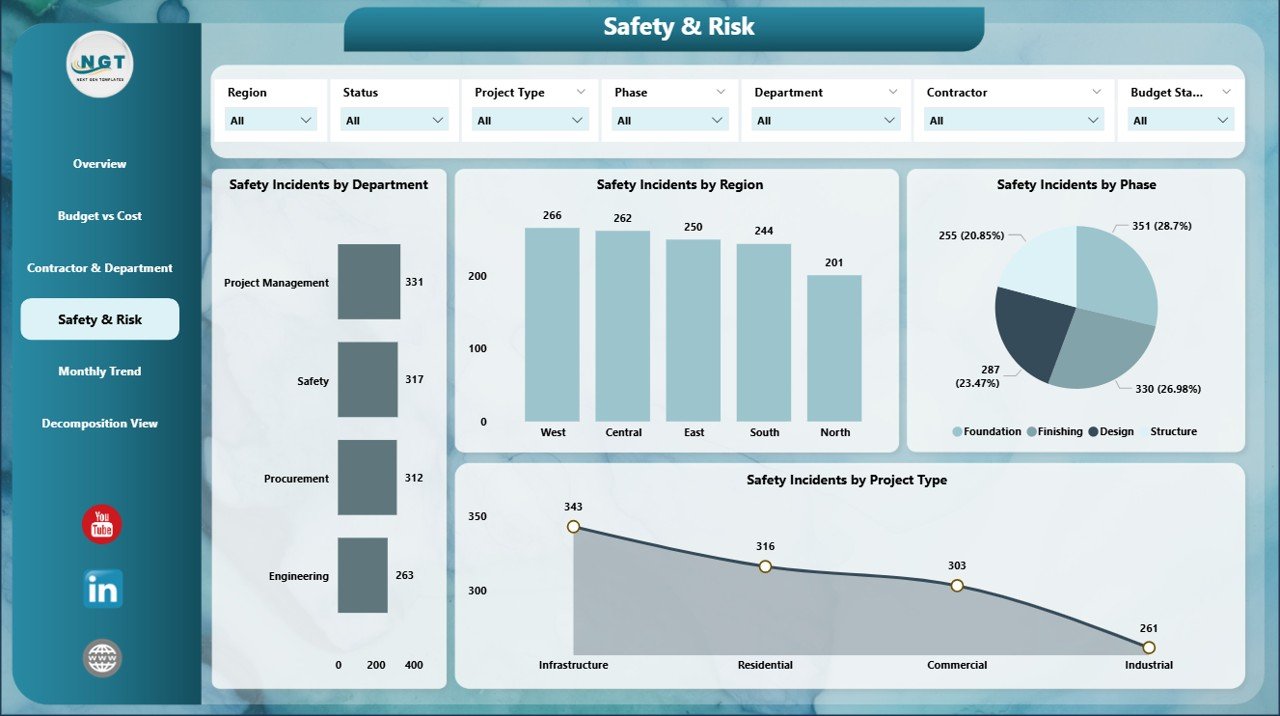
4) Safety & Risk Page: Monitoring Safety Incidents
The Safety & Risk Page provides insights into safety performance across all projects. It includes the following charts:
Charts:
- Safety Incidents by Department: Displays the number of safety incidents for each department.
- Safety Incidents by Region: Breaks down safety incidents by region, helping you identify high-risk areas.
- Safety Incidents by Phase: Tracks safety incidents by project phase (e.g., design, construction, finishing).
- Safety Incidents by Project Type: Displays safety incidents based on project type.
This page is crucial for tracking and reducing safety risks, ensuring a safer work environment across your projects.
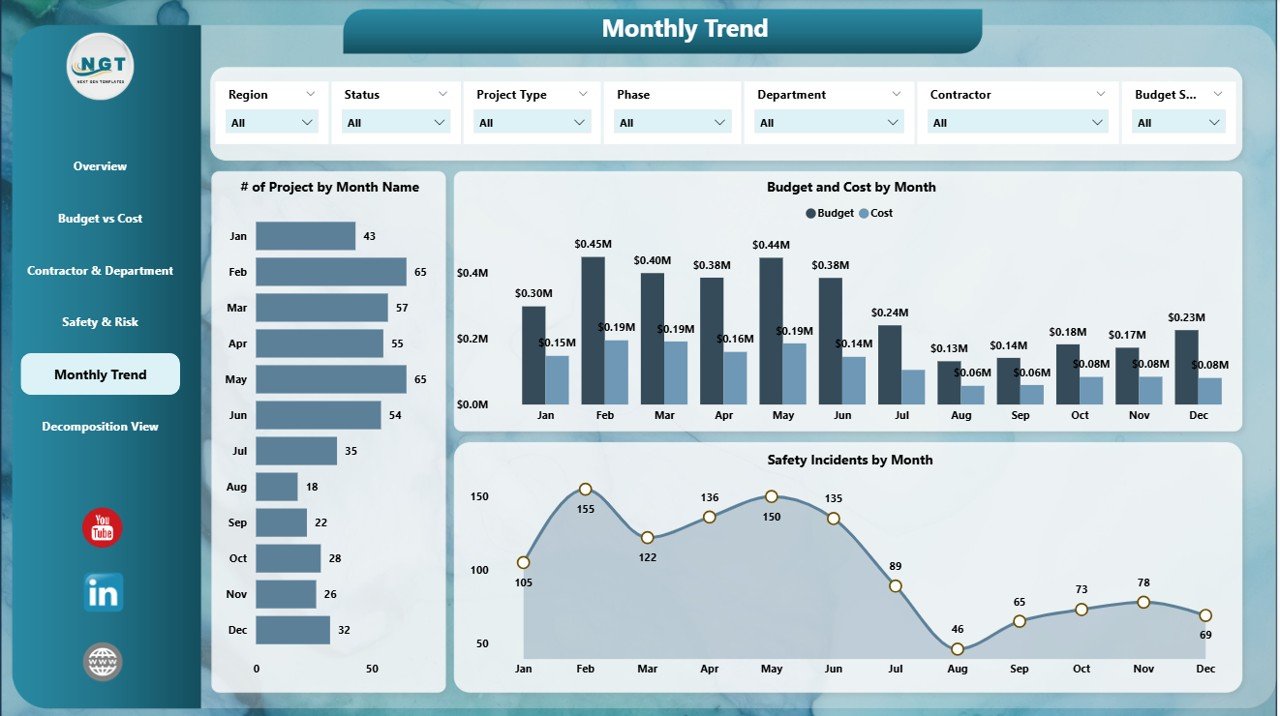
5) Monthly Trend Page: Tracking Performance Over Time
The Monthly Trend Page provides a time-based view of key performance metrics. Features include:
Charts:
- # of Projects by Month Name: Displays the number of projects completed or initiated each month.
- Budget and Cost by Month: Tracks the budget and actual costs by month to monitor financial trends.
- Safety Incidents by Month: Shows the number of safety incidents by month to help identify trends in safety performance.
- Average Resolution Time by Month: Tracks the average resolution time for issues or incidents by month.
This page helps you monitor how project performance evolves over time and identify trends that could require intervention.
Click to buy Construction Dashboard in Power BI
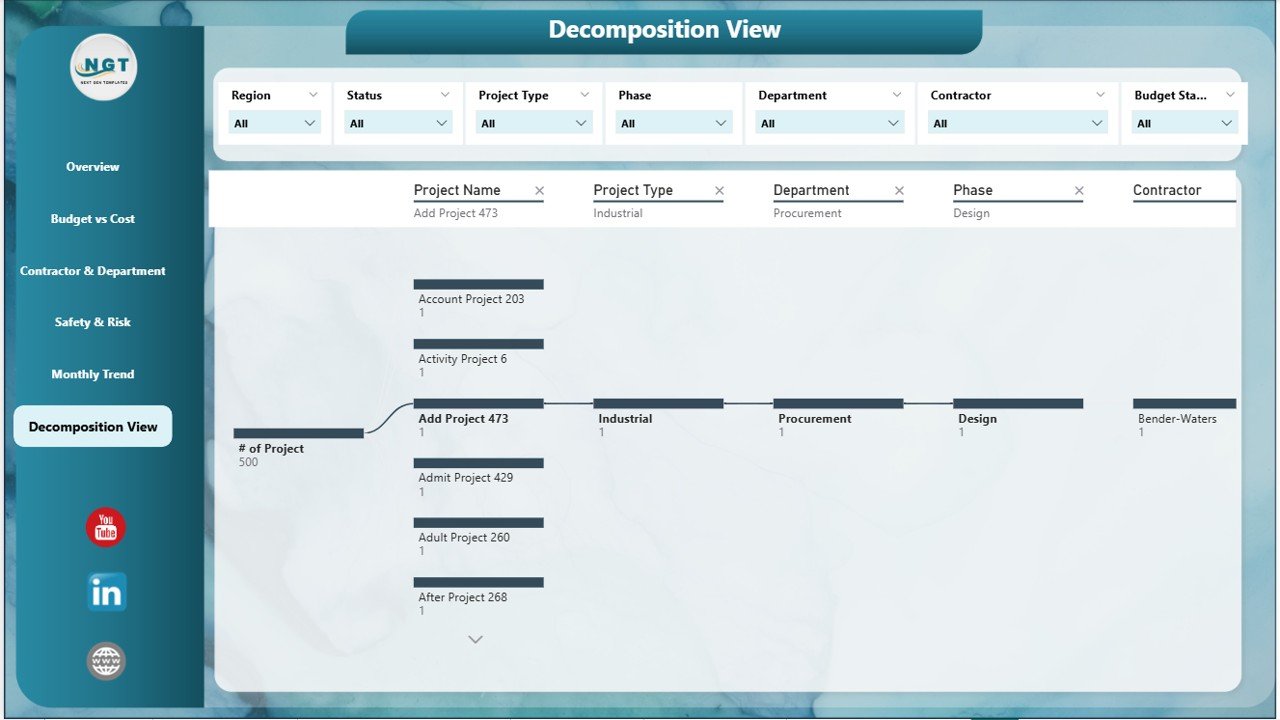
6) Decomposition View Page: Drill-Down Analysis
The Decomposition View Page allows for a detailed breakdown of your project data. This page provides a drill-down view, allowing you to explore various factors influencing project performance, such as project type, phase, region, and contractor.
Benefits of Using the Construction Dashboard in Power BI
The Construction Dashboard in Power BI provides numerous benefits for project managers, contractors, and stakeholders:
-
Centralized Data Management: All project data is stored in one location, making it easy to track and manage multiple projects simultaneously.
-
Data-Driven Decision Making: The dashboard provides real-time insights into key project metrics, enabling you to make informed decisions.
-
Improved Project Monitoring: With detailed charts and KPIs, you can closely monitor project status, safety incidents, and budget adherence.
-
Enhanced Collaboration: The dashboard can be shared across teams, allowing for greater collaboration and alignment on project goals.
-
Risk Identification: The safety and risk analysis tools help identify potential risks early, reducing the likelihood of incidents or project delays.
Best Practices for Using the Construction Dashboard
Click to buy Construction Dashboard in Power BI
To make the most of the Construction Dashboard in Power BI, follow these best practices:
-
Update Regularly: Ensure that all project data is updated regularly to maintain accuracy and reflect the latest performance metrics.
-
Monitor Safety Performance: Use the Safety & Risk Page to stay on top of safety incidents and take action to mitigate risks.
-
Analyze Budget vs. Cost: Regularly review the Budget vs Cost Page to ensure that projects are staying within budget and identify areas where costs may be rising.
-
Track Project Progress: Use the Overview Page and Monthly Trend Page to monitor project completion and performance trends over time.
-
Engage Stakeholders: Share the dashboard with relevant stakeholders to keep everyone informed and aligned on project performance.
Conclusion
The Construction Dashboard in Power BI is an essential tool for managing and tracking construction projects. With its detailed data visualizations, real-time insights, and customizable features, this dashboard helps project managers monitor key metrics such as project status, safety incidents, budget adherence, and contractor performance. By using this tool, you can ensure that your projects are completed on time, within budget, and with a high level of safety.
Frequently Asked Questions (FAQs)
Click to buy Construction Dashboard in Power BI
1. How do I update the Construction Dashboard?
You can update the dashboard by adding new project data to the Data Sheet. The charts and metrics will automatically update based on the new information.
2. Can I track multiple construction projects with this dashboard?
Yes, the dashboard is designed to manage and track multiple projects simultaneously, providing a comprehensive view of all your ongoing projects.
3. How do I monitor project safety?
Use the Safety & Risk Page to track safety incidents across various departments, regions, and project phases. This helps identify potential safety issues early.
4. Can I share the dashboard with my team?
Yes, since the dashboard is created in Power BI, you can easily share it with your team for real-time updates and collaboration.
5. Is the dashboard customizable for my organization’s needs?
Yes, the dashboard is fully customizable. You can modify the layout, add new charts, or adjust the metrics to suit your organization’s specific project management needs.
Visit our YouTube channel to learn step-by-step video tutorials
Click to buy Construction Dashboard in Power BI