Ensuring compliance with internal policies, legal regulations, and industry standards is critical for any business. The Corporate Compliance Dashboard in Excel is designed to help organizations track compliance cases, assess risk levels, monitor deadlines, and evaluate the performance of departments and responsible persons.
In this article, we will explain the features and benefits of the Corporate Compliance Dashboard in Excel, and how it can streamline compliance management within your organization.
What is the Corporate Compliance Dashboard in Excel?
The Corporate Compliance Dashboard in Excel is a powerful tool that enables businesses to track and manage their compliance cases. The dashboard provides a comprehensive view of compliance status, overdue items, high-risk cases, and departmental performance. It uses a combination of cards, charts, and data input sheets to help businesses ensure that they meet compliance requirements effectively
Key Features of the Corporate Compliance Dashboard
Click to buy Corporate Compliance Dashboard in Excel
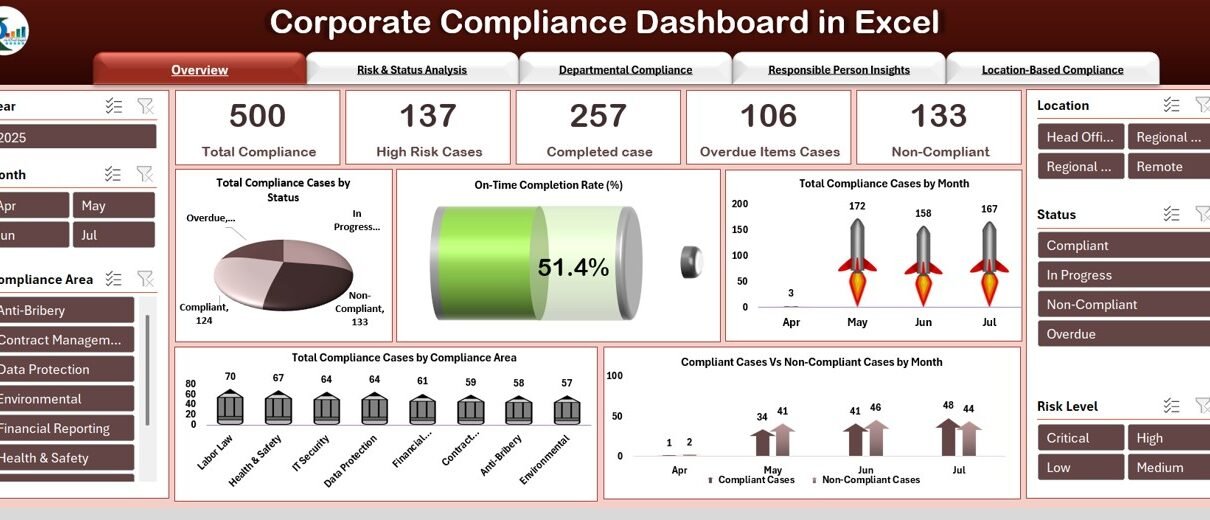
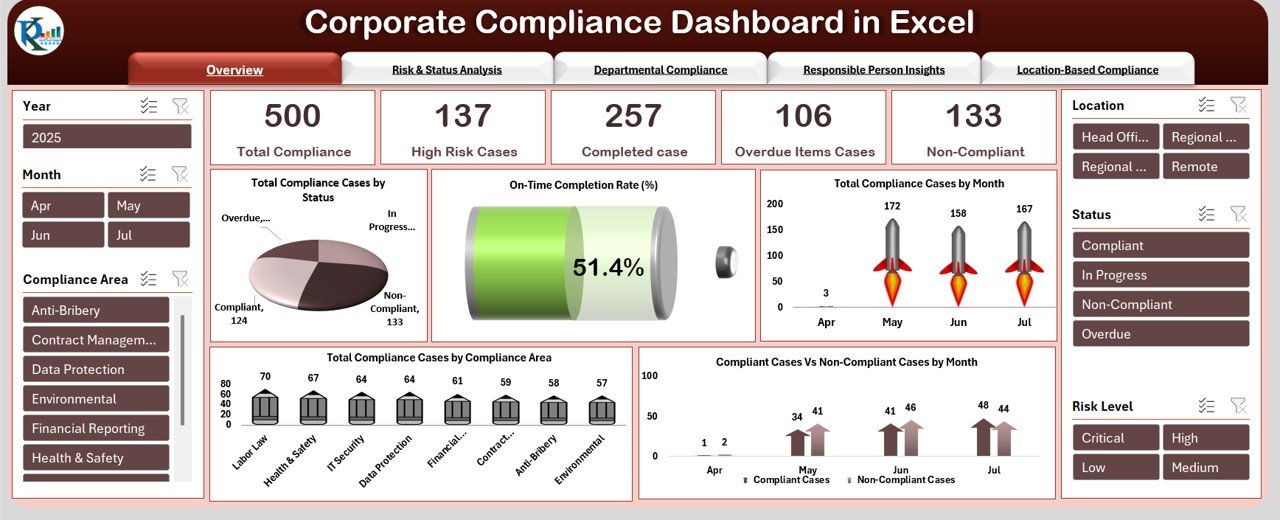
1) Overview Sheet Tab: High-Level Compliance Metrics
The Overview Sheet Tab provides an overview of the key compliance metrics for your organization. It includes:
Cards:
- Total Compliance Cases: Displays the total number of compliance cases across the organization.
- High-Risk Cases: Shows the number of high-risk compliance cases.
- Completed Cases: Tracks the number of completed compliance cases.
- Overdue Items Cases: Displays the number of compliance cases that are overdue.
- Non-Compliant Cases: Shows the number of cases that are non-compliant.
Charts:
- Total Compliance Cases by Status: Visualizes the number of compliance cases by their status (e.g., completed, in-progress, overdue).
- On-Time Completion Rate (%): Displays the percentage of compliance cases completed on time.
- Total Compliance Cases by Month: Tracks the number of compliance cases over the months.
- Total Compliance Cases by Compliance Area: Breaks down compliance cases by different areas (e.g., financial, operational, regulatory).
- Compliant Cases vs Non-Compliant Cases by Month: Shows a comparison of compliant versus non-compliant cases over time.
This page provides a comprehensive snapshot of your organization’s compliance status, making it easy to monitor and identify any areas that need attention.
Click to buy Corporate Compliance Dashboard in Excel
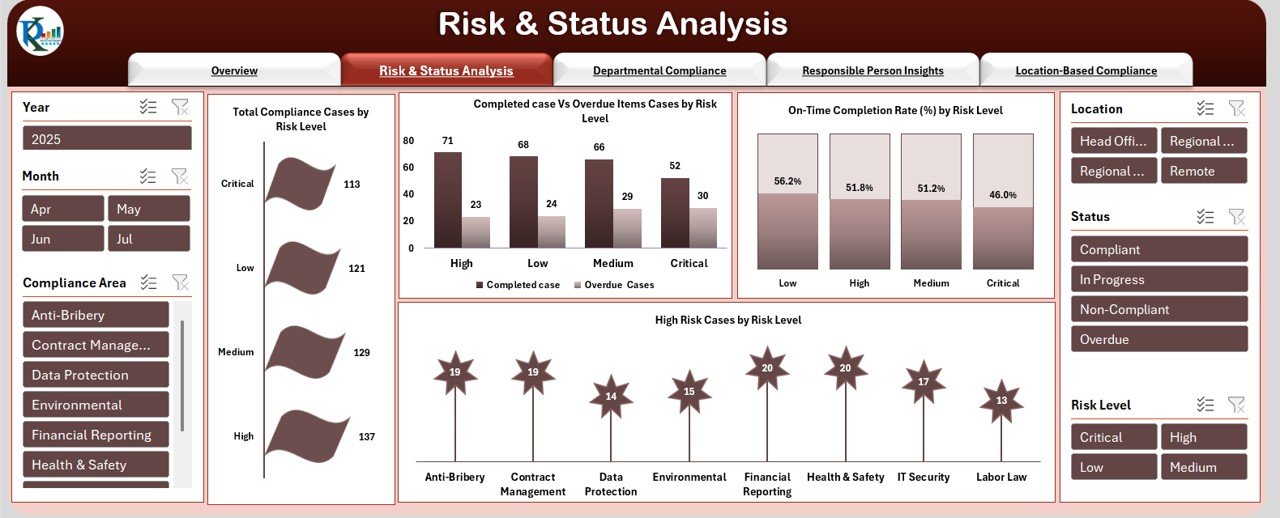
2) Risk & Status Analysis Sheet Tab: Detailed Case Breakdown
The Risk & Status Analysis Sheet Tab helps you assess compliance cases based on risk levels and status. Key features include:
Charts:
- Total Compliance Cases by Risk Level: Categorizes compliance cases by their risk level (e.g., low, medium, high).
- Completed Cases vs Overdue Items by Risk Level: Compares completed compliance cases to overdue ones, broken down by risk level.
- On-Time Completion Rate (%) by Risk Level: Displays the on-time completion rate of compliance cases based on their risk level.
- High-Risk Cases by Risk Level: Shows the number of high-risk compliance cases across different levels.
This sheet allows you to drill down into compliance data, focusing on risk and completion status to identify critical areas that require attention.
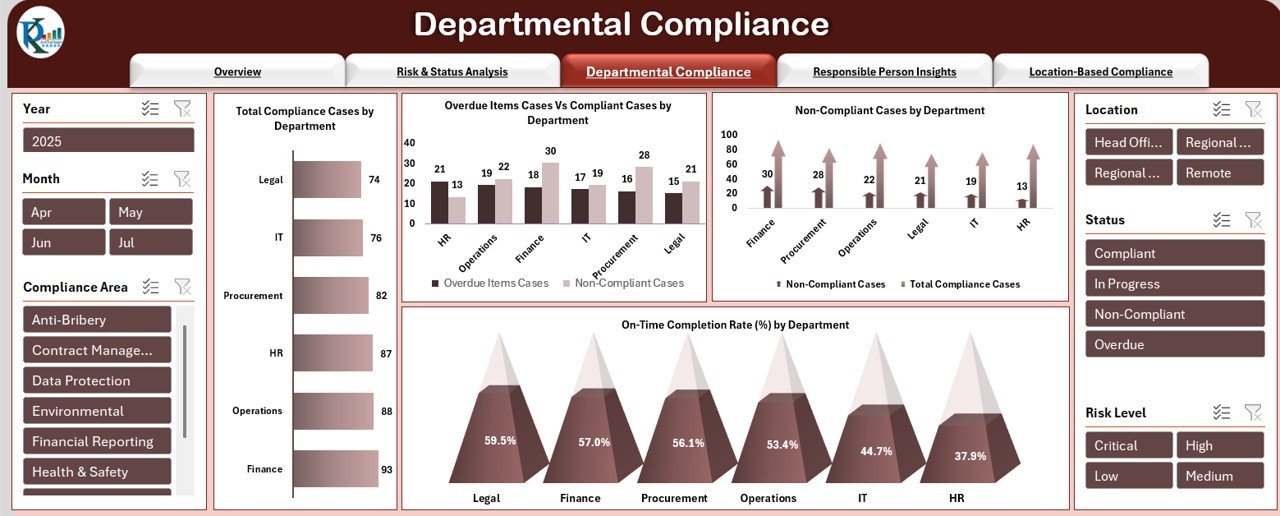
3) Departmental Compliance Sheet Tab: Performance by Department
The Departmental Compliance Sheet Tab provides insights into how different departments are performing in terms of compliance. Key charts include:
-
Total Compliance Cases by Department: Displays the number of compliance cases for each department.
-
Overdue Items Cases vs Compliant Cases by Department: Compares overdue cases and compliant cases for each department.
-
Non-Compliant Cases by Department: Shows the number of non-compliant cases by department.
-
On-Time Completion Rate (%) by Department: Displays the percentage of compliance cases completed on time for each department.
This sheet allows you to track departmental performance and focus on areas where compliance may be lagging.
Click to buy Corporate Compliance Dashboard in Excel
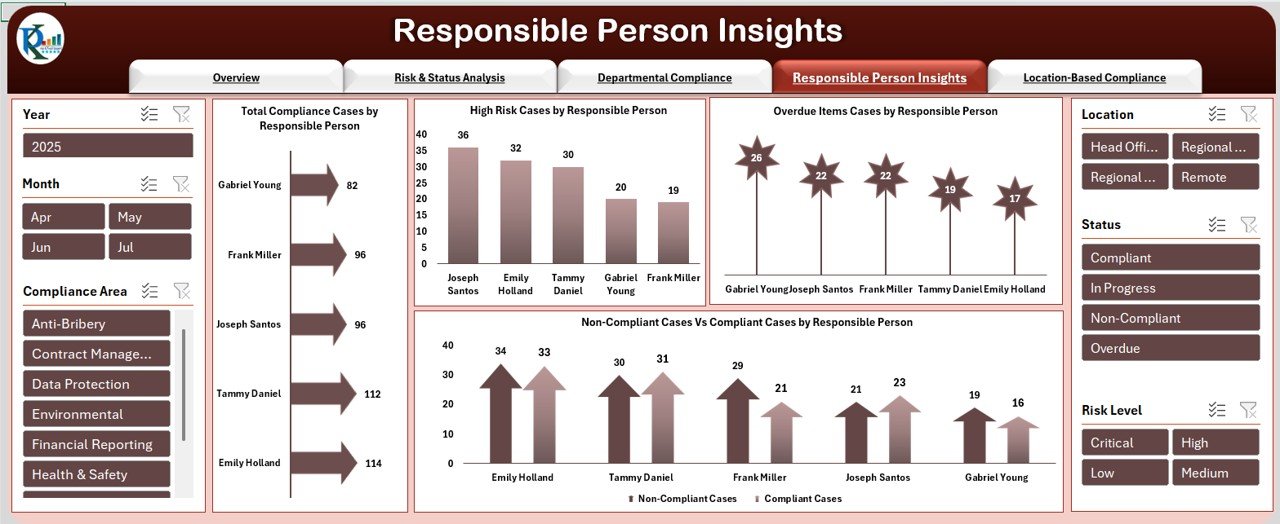
4) Responsible Person Insights Sheet Tab: Individual Accountability
The Responsible Person Insights Sheet Tab tracks compliance cases assigned to specific individuals within the organization. Key charts include:
-
Total Compliance Cases by Responsible Person: Displays the total number of compliance cases assigned to each responsible person.
-
High-Risk Cases by Responsible Person: Shows the number of high-risk compliance cases assigned to each individual.
-
Overdue Items Cases by Responsible Person: Tracks overdue compliance cases by responsible person.
-
Non-Compliant Cases vs Compliant Cases by Responsible Person: Compares non-compliant versus compliant cases for each responsible individual.
This sheet helps you monitor individual performance and ensures accountability for each compliance case.
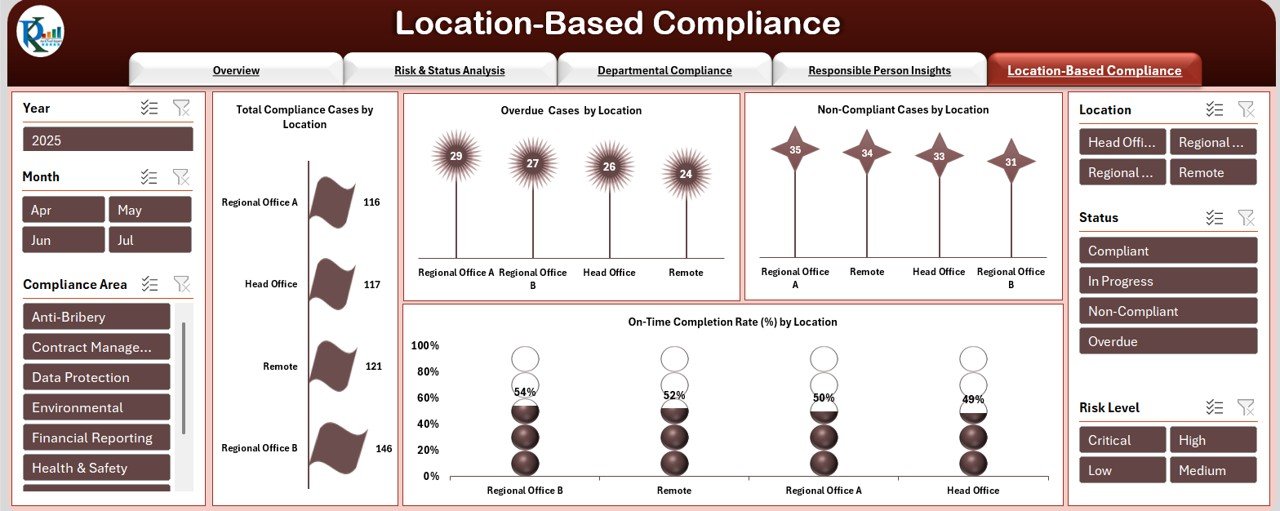
5) Location-Based Compliance Sheet Tab: Compliance by Location
The Location-Based Compliance Sheet Tab tracks compliance cases based on location, providing insights into regional performance. Key charts include:
-
Total Compliance Cases by Location: Displays the total number of compliance cases by location (e.g., North, South, East, West).
-
Overdue Cases by Location: Tracks overdue compliance cases by location.
-
Non-Compliant Cases by Location: Shows the number of non-compliant cases by location.
-
On-Time Completion Rate (%) by Location: Displays the on-time completion rate by location.
This sheet is useful for organizations with multiple locations, helping them track compliance performance across regions.
Click to buy Corporate Compliance Dashboard in Excel
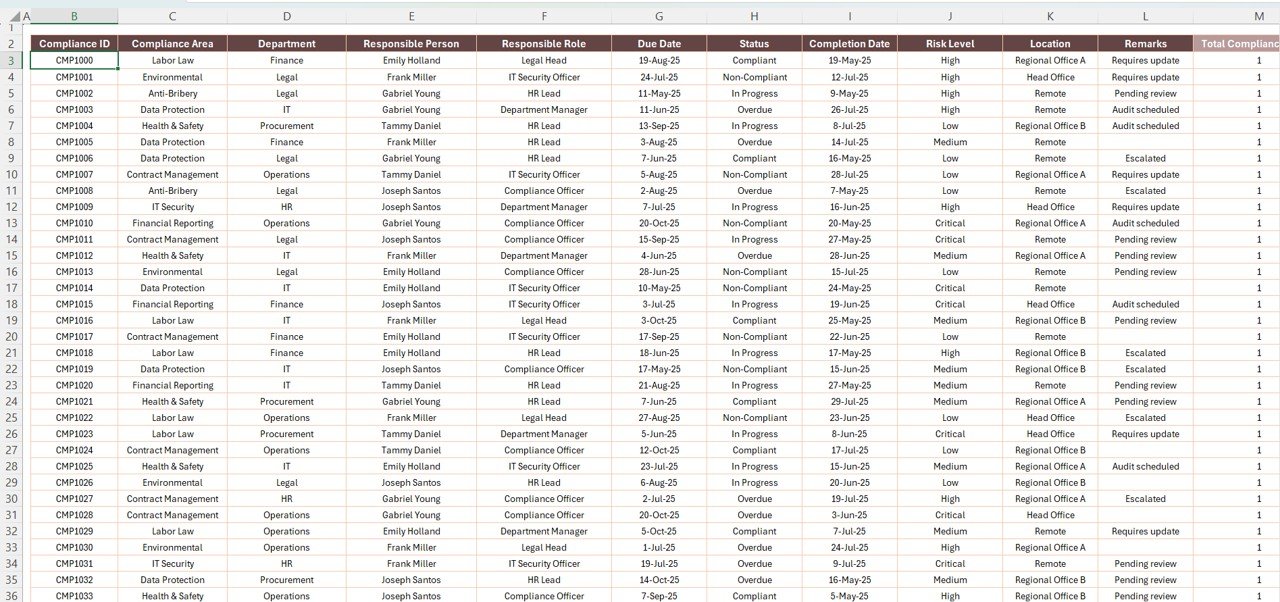
6) : Centralized Data Entry
The Data Sheet Tab serves as the central repository for all compliance-related data. Key columns in this sheet include:
Benefits of Using the Corporate Compliance Dashboard
The Corporate Compliance Dashboard in Excel offers several key benefits for organizations:
-
Centralized Data Management: Store all compliance-related data in one place for easy access and management.
-
Real-Time Insights: The dashboard is updated in real time, providing current data to make informed decisions.
-
Data-Driven Decision Making: Use the charts and metrics to monitor performance and identify areas for improvement.
-
Enhanced Compliance Monitoring: Track compliance cases by status, risk level, department, and individual to ensure that all cases are managed effectively.
-
Improved Accountability: Monitor individual and departmental performance to ensure accountability in managing compliance cases.
Best Practices for Using the Corporate Compliance Dashboard
Click to buy Corporate Compliance Dashboard in Excel
To get the most out of the Corporate Compliance Dashboard, consider the following best practices:
-
Regularly Update Data: Ensure that all compliance data is entered and updated frequently to keep the dashboard accurate.
-
Monitor Key Metrics: Focus on metrics like Total Compliance Cases, High-Risk Cases, and On-Time Completion Rate to stay on top of compliance performance.
-
Use Slicers and Filters: Leverage the Report Sheet Tab and Slicers to filter and analyze data based on different parameters such as department, region, and severity level.
-
Generate Reports: Use the Reports module to create detailed reports on compliance performance for internal reviews and audits.
-
Share with Stakeholders: Share the dashboard with key stakeholders (e.g., compliance officers, department heads) to keep everyone informed and aligned on compliance goals.
Conclusion
The Corporate Compliance Dashboard in Excel is an essential tool for organizations looking to streamline their compliance management process. With its user-friendly interface, customizable features, and robust data management capabilities, this dashboard helps you monitor compliance status, track risks, and ensure that all cases are resolved in a timely manner. By using this tool, businesses can improve their compliance processes, minimize risks, and maintain a strong compliance culture.
Frequently Asked Questions (FAQs)
Click to buy Corporate Compliance Dashboard in Excel
1. How do I update the Corporate Compliance Dashboard?
You can update the dashboard by entering new compliance data into the Data Sheet Tab. The charts and metrics will automatically update based on the new information.
2. Can I track compliance cases by department or region?
Yes, the Departmental Compliance Sheet Tab and Location-Based Compliance Sheet Tab allow you to track cases by department and region.
3. How do I monitor high-risk compliance cases?
Use the Risk & Status Analysis Sheet Tab to track high-risk compliance cases by severity level and resolution status.
4. Can I filter compliance data by month or year?
Yes, you can filter compliance data by month or year using the slicers in the Report Sheet Tab.
5. Can I share the Corporate Compliance Dashboard with my team?
Yes, since the dashboard is in Excel, you can easily share it with your team for real-time updates and collaboration.
Visit our YouTube channel to learn step-by-step video tutorials
Watch the step-by-step video Demo:
Click to buy Corporate Compliance Dashboard in Excel