Introduction
The Edutainment Parks KPI Dashboard is a powerful and ready-to-use Excel template designed to help park managers and business analysts monitor and evaluate critical performance indicators effectively. By consolidating various key metrics into one interactive dashboard, this tool facilitates data-driven decision-making to enhance operations and boost visitor satisfaction.
Key Features of Edutainment Parks KPI Dashboard
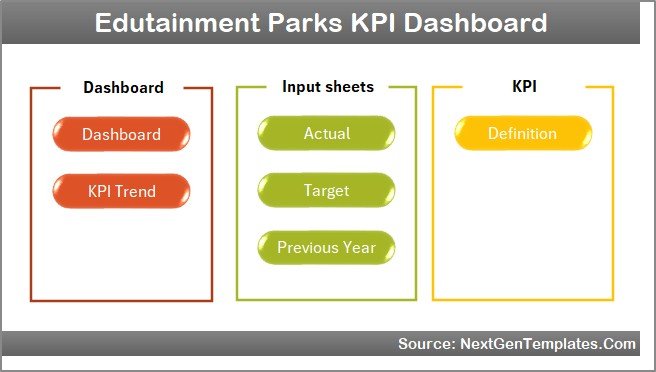
- Seven well-organized worksheets for comprehensive KPI management.
- Interactive home page with navigation buttons to easily access any worksheet.
- Dynamic KPI dashboard supporting monthly data selection for performance tracking.
- Trend analysis charts displaying Month-To-Date (MTD) and Year-To-Date (YTD) KPI progress.
- Input sheets for actual, target, and previous year data providing a seamless update process.
- KPI definitions section offering clarity on measurement units, formulas, and target types.
- Conditional formatting with up and down arrows to quickly pinpoint performance variances.
Dashboard Pages Explanation
1. Home Sheet
This index sheet serves as the control panel for the dashboard. It includes six buttons that navigate to the corresponding worksheets, allowing smooth and fast access.
 Home Page
2. Dashboard Sheet
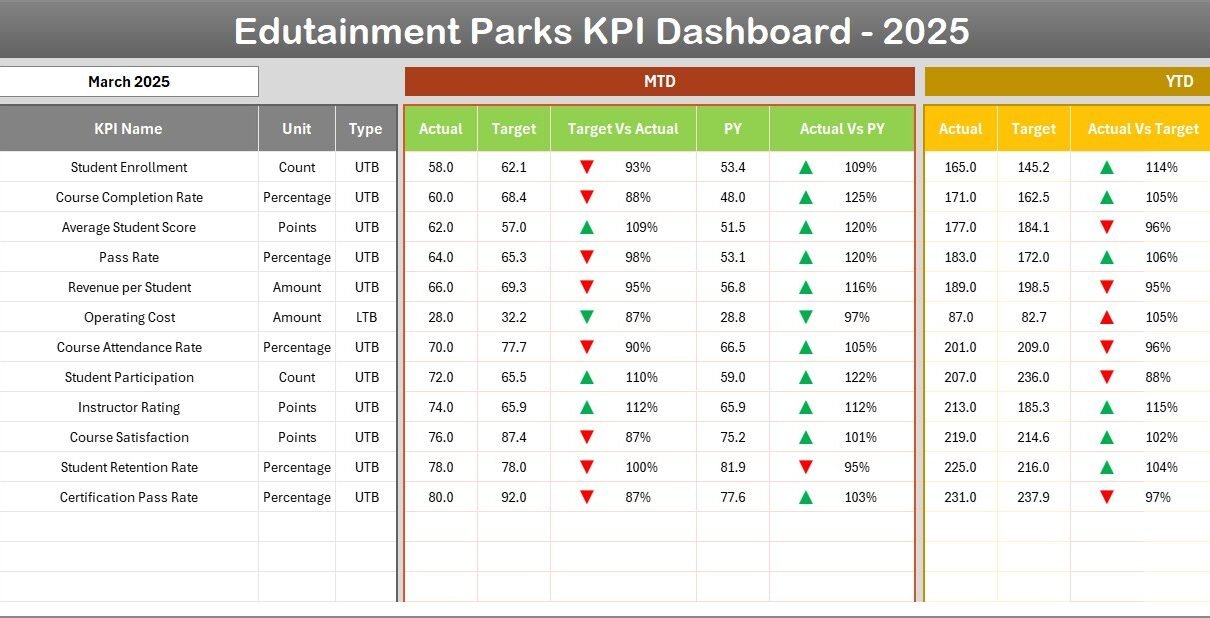
The primary analysis sheet that displays all KPIs with selections available for the desired month (via dropdown in cell D3). The dashboard covers:
- MTD Actual, Target, and Previous Year data.
- Target vs Actual and PY vs Actual comparisons using intuitive conditional formatting arrows.
- YTD Actual, Target, and Previous Year data along with applicable comparisons.
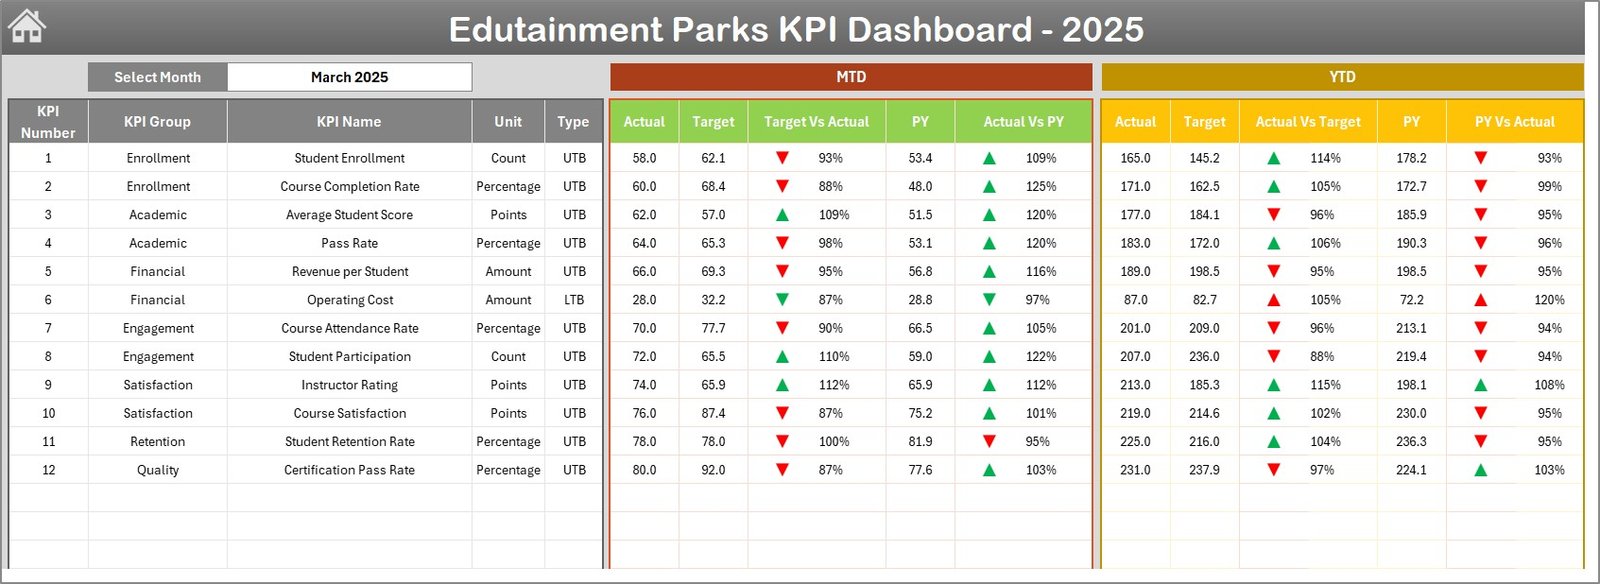 Edutainment Parks KPI Dashboard
3. KPI Trend Sheet
This sheet enables selection of any KPI from a dropdown located in cell C3. It showcases:
- KPI Group, Unit of Measure, KPI Type (Lower The Better or Upper The Better).
- Formula and detailed KPI definition for better understanding.
- MTD and YTD trend charts for Actual, Target, and Previous Year values.
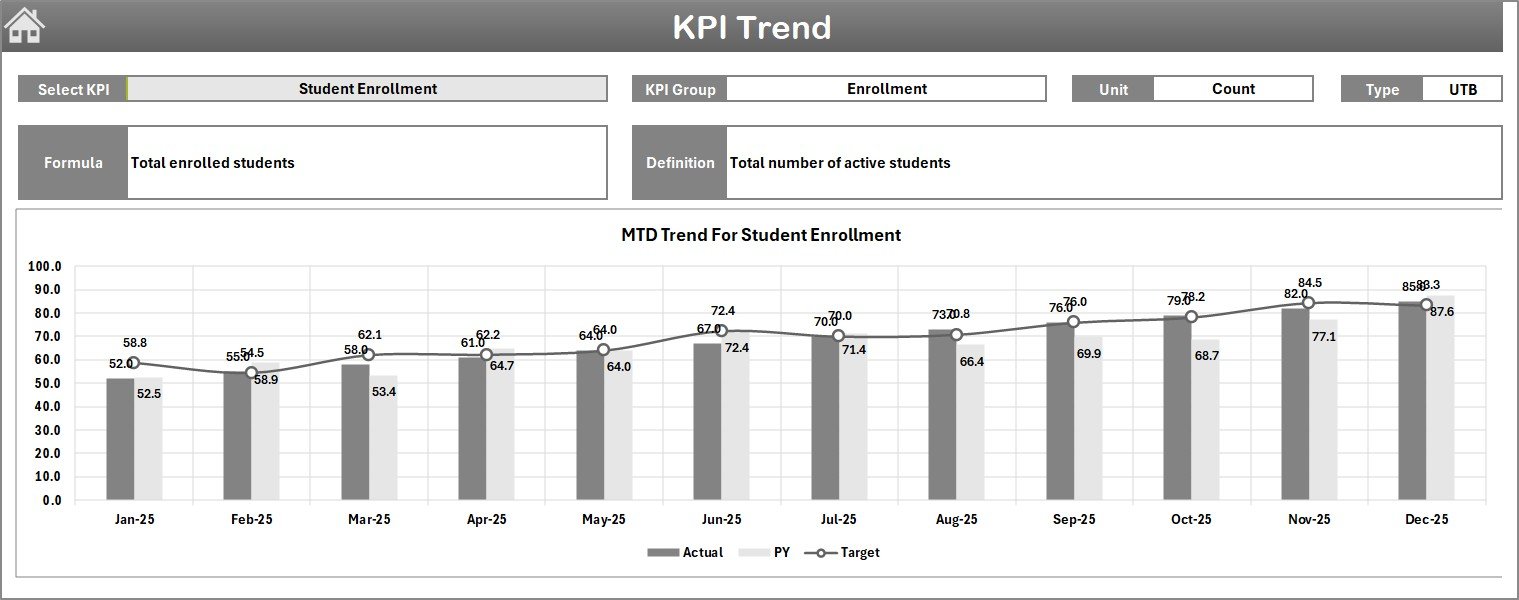 KPI Trend Sheet
4. Actual Numbers Input Sheet
Use this sheet to enter actual performance data for YTD and MTD corresponding to selected months. The start month of the year is configurable from cell E1.
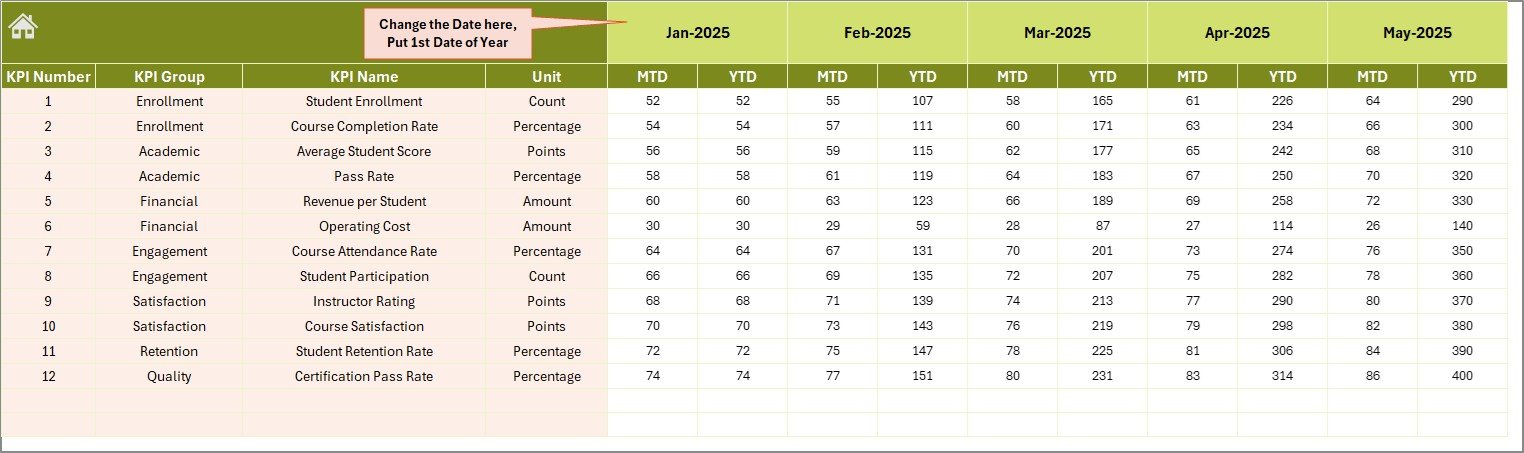 Actual Numbers Input sheet
5. Target Number Input Sheet
This tab allows input of target values for each KPI on both MTD and YTD basis, essential for setting performance benchmarks.
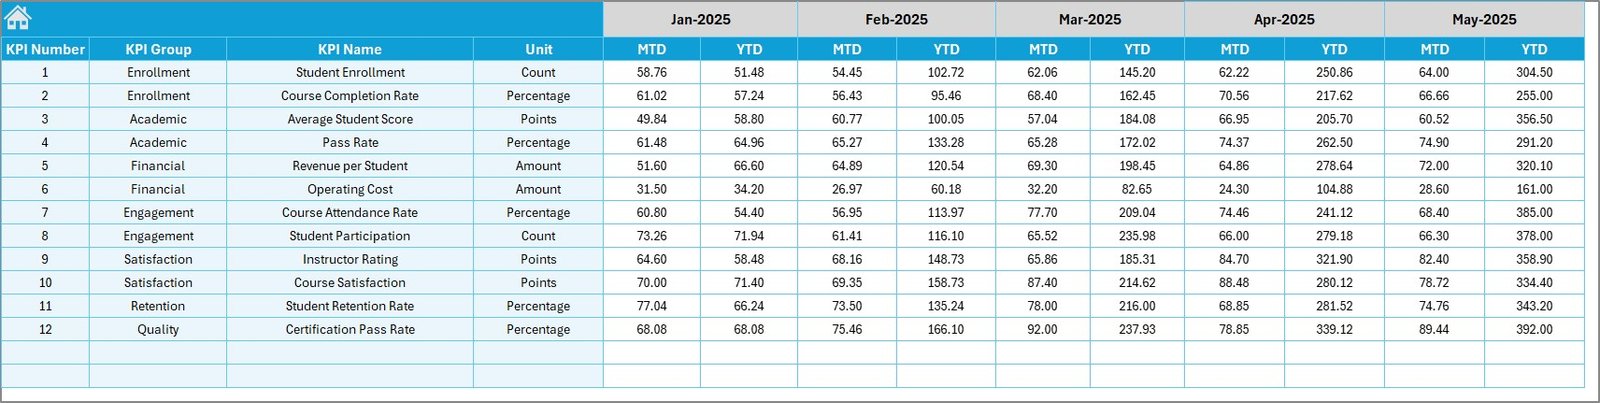 Target Number Input sheet
6. Previous Year Number Sheet
Enter historical data for the previous year analogous to current year entries for accurate comparative analysis.
 Previous Year Number Input sheet
7. KPI Definition Sheet
Defines all KPIs with comprehensive details including:
- KPI Name and Group
- Unit of Measurement
- Formula used for calculation
- Type of KPI – LTB (Lower The Better) or UTB (Upper The Better)
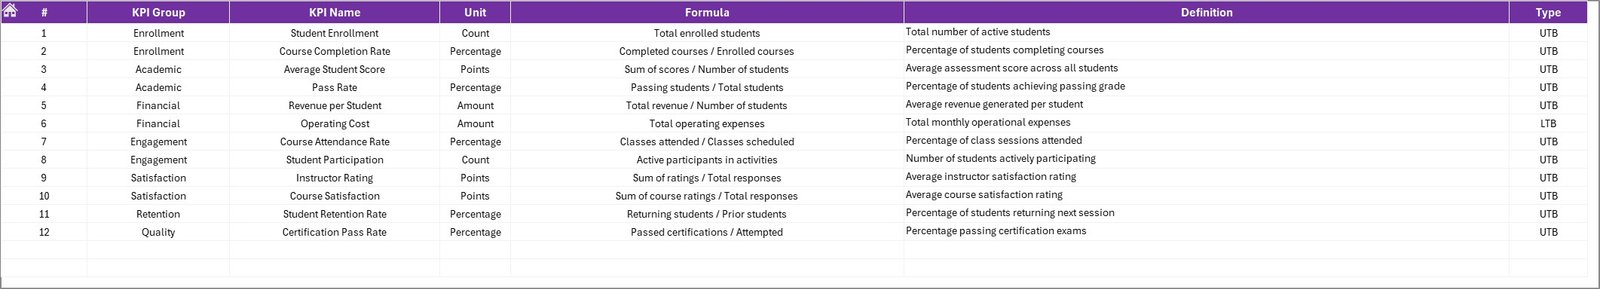 KPI Definition sheet
Advantages of Edutainment Parks KPI Dashboard
- Centralized Data Management: Consolidates data from various sources for streamlined analysis.
- Interactive and User-Friendly Interface: Easy navigation and dynamic selections through dropdowns.
- Informed Decision Making: Real-time visualization of KPIs supports strategic planning.
- Performance Tracking: MTD and YTD tracking enables spotting trends before issues escalate.
- Customizable Inputs: Flexible data entry accommodates multiple operational scenarios and reporting periods.
Opportunities for Improvement
Click to Buy Edutainment Parks KPI Dashboard in Excel
- Integrate real-time data connectivity through APIs for live monitoring.
- Enhance mobile responsiveness for users accessing dashboards on-the-go.
- Add advanced predictive analytics to forecast trends and suggest actionable insights.
- Include automated alerts to notify users of significant KPI deviations.
Best Practices
- Update actual, target, and previous year data regularly for accuracy.
- Use the KPI definition sheet to onboard new users with consistent understanding.
- Leverage conditional formatting cues to prioritize areas requiring immediate attention.
- Encourage cross-functional collaboration by sharing dashboard insights.
- Train staff on how to interpret KPI trends and respond proactively.
FAQs
Click to Buy Edutainment Parks KPI Dashboard in Excel
Can I customize the KPIs in this dashboard?
Yes, you can add or modify KPIs in the KPI Definition sheet, and the dashboard will reflect the changes accordingly.
Is this dashboard suitable for multiple parks or locations?
While designed primarily for a single park, the template can be extended to track multiple locations by replicating data input sections with identifiers.
Do I need advanced Excel skills to use this dashboard?
Basic Excel knowledge is sufficient since the dashboard uses user-friendly dropdowns and input sheets. No complex formulas need user editing.
Can I export data or charts from this dashboard?
Yes, you can export charts as images or copy data tables for reporting or presentations.
Conclusion
Click to Buy Edutainment Parks KPI Dashboard in Excel
The Edutainment Parks KPI Dashboard offers a comprehensive solution for monitoring essential performance metrics in a streamlined, interactive manner. Its organized structure, combined with dynamic data inputs and insightful visualizations, empowers park managers to make informed decisions, improve operational efficiency, and ultimately enhance visitor experiences.
For further guidance and practical demonstrations, explore official resources such as Microsoft Excel Support and Power BI dashboards.
Visit our YouTube channel to watch the demo.
Click to Buy Edutainment Parks KPI Dashboard in Excel