Emergency Medical Services (EMS) teams operate in high-pressure environments where every second matters. However, many EMS organizations still rely on manual reports, scattered spreadsheets, and delayed data analysis. As a result, leaders struggle to track performance, identify bottlenecks, and improve patient outcomes in real time.
That is exactly why an Emergency Medical Services KPI Dashboard in Excel becomes a powerful and practical solution.
In this in-depth article, you will learn what an EMS KPI Dashboard in Excel is, why it is essential, how it works, its worksheet-wise structure, key KPIs, advantages, best practices, and frequently asked questions. Moreover, the content stays simple, action-oriented, and business-friendly so that both technical and non-technical users can benefit.
Click to buy Emergency Medical Services KPI Dashboard in Excel
What Is an Emergency Medical Services KPI Dashboard in Excel?
An Emergency Medical Services KPI Dashboard in Excel is a centralized, ready-to-use analytical template designed to track, monitor, and visualize the most important EMS performance indicators.
Instead of reviewing raw data across multiple files, this dashboard transforms complex EMS data into clear KPIs, trends, and comparisons. Consequently, EMS managers, hospital administrators, and operations leaders can make faster and better decisions.
Because the dashboard runs entirely in Excel, it remains flexible, cost-effective, and easy to customize without requiring advanced BI tools or technical expertise.
Why Do Emergency Medical Services Need a KPI Dashboard?
EMS organizations deal with response times, patient volumes, vehicle availability, crew performance, and compliance metrics every single day. However, without structured dashboards, teams face several challenges.
Common Problems Without an EMS KPI Dashboard
- Delayed visibility into response times
- No clear comparison between targets and actual performance
- Difficulty tracking month-to-date (MTD) and year-to-date (YTD) trends
- Manual and time-consuming reporting processes
- Limited insights for strategic improvement
Because of these issues, decision-making becomes reactive rather than proactive.
How an EMS KPI Dashboard in Excel Solves These Problems
- Centralizes all EMS KPIs in one place
- Provides instant MTD, YTD, and previous-year comparisons
- Highlights performance gaps using conditional formatting
- Supports trend analysis for continuous improvement
- Saves time and reduces manual reporting effort
As a result, EMS leaders gain clarity, control, and confidence.
How Does an Emergency Medical Services KPI Dashboard in Excel Work?
The EMS KPI Dashboard in Excel works by combining structured data input, predefined KPI formulas, and dynamic visuals.
First, users enter actual, target, and previous-year values in dedicated sheets. Then, the dashboard automatically calculates variances, trends, and performance indicators. Finally, visuals and tables update instantly based on selected months and KPIs.
Because everything runs inside Excel, users maintain full control over data and customization.
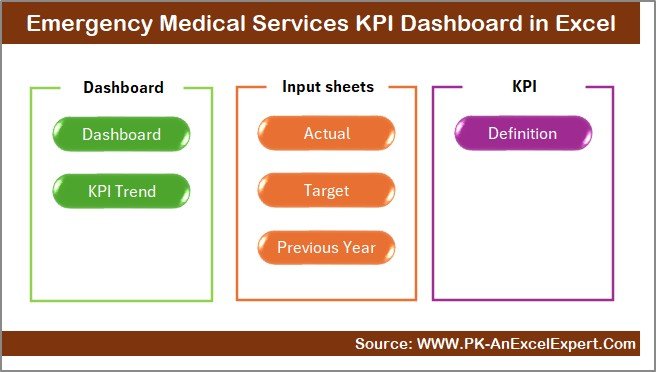
Overview of Worksheets in the Emergency Medical Services KPI Dashboard in Excel
This EMS KPI Dashboard includes 7 well-structured worksheets, each designed for a specific purpose. Let us explore each one in detail.
Summary Page – Why Is the Summary Page Important?
The Summary Page acts as the index and navigation hub of the dashboard.
Key Features of the Summary Page
- Provides 6 navigation buttons
- Allows instant movement to key analytical sheets
- Improves usability for non-technical users
- Creates a professional dashboard experience
Because EMS dashboards often involve multiple users, this page ensures smooth and intuitive navigation.
Click to buy Emergency Medical Services KPI Dashboard in Excel
Dashboard Sheet – How Does the Main EMS Dashboard Work?
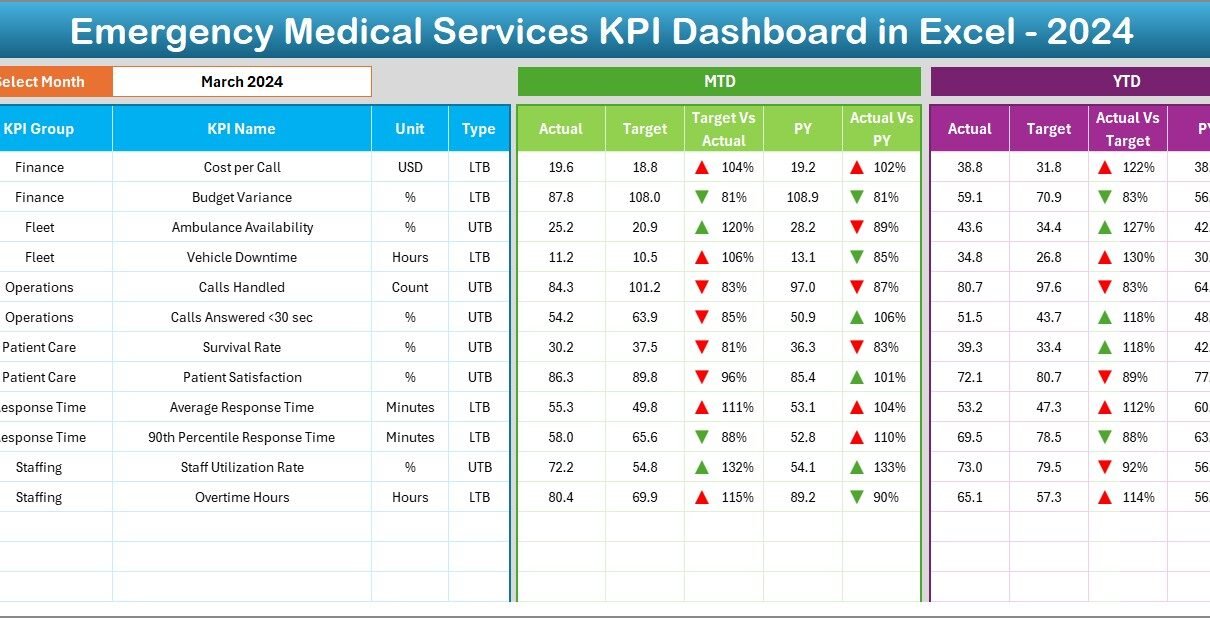
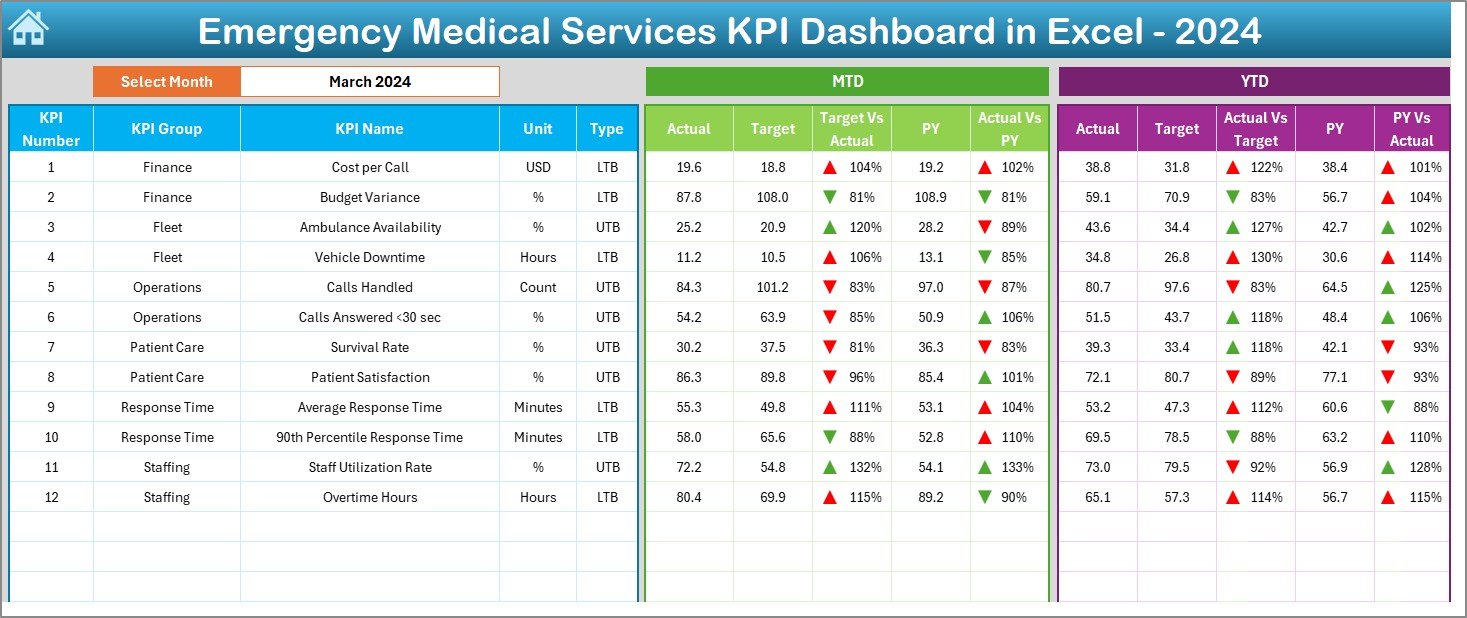
The Dashboard Sheet is the heart of the EMS KPI Dashboard in Excel.
What Does the Dashboard Sheet Show?
- Complete overview of all EMS KPIs
- Month selector available at cell D3
- Dynamic updates when the month changes
KPIs Displayed on the Dashboard
- MTD Actual vs Target vs Previous Year
- YTD Actual vs Target vs Previous Year
- Target vs Actual variance
- Previous Year vs Actual variance
Visual Enhancements
- Conditional formatting with up/down arrows
- Clear performance indicators
- Easy identification of underperforming KPIs
As a result, decision-makers can instantly see where EMS operations perform well and where improvements are required.
Click to buy Emergency Medical Services KPI Dashboard in Excel
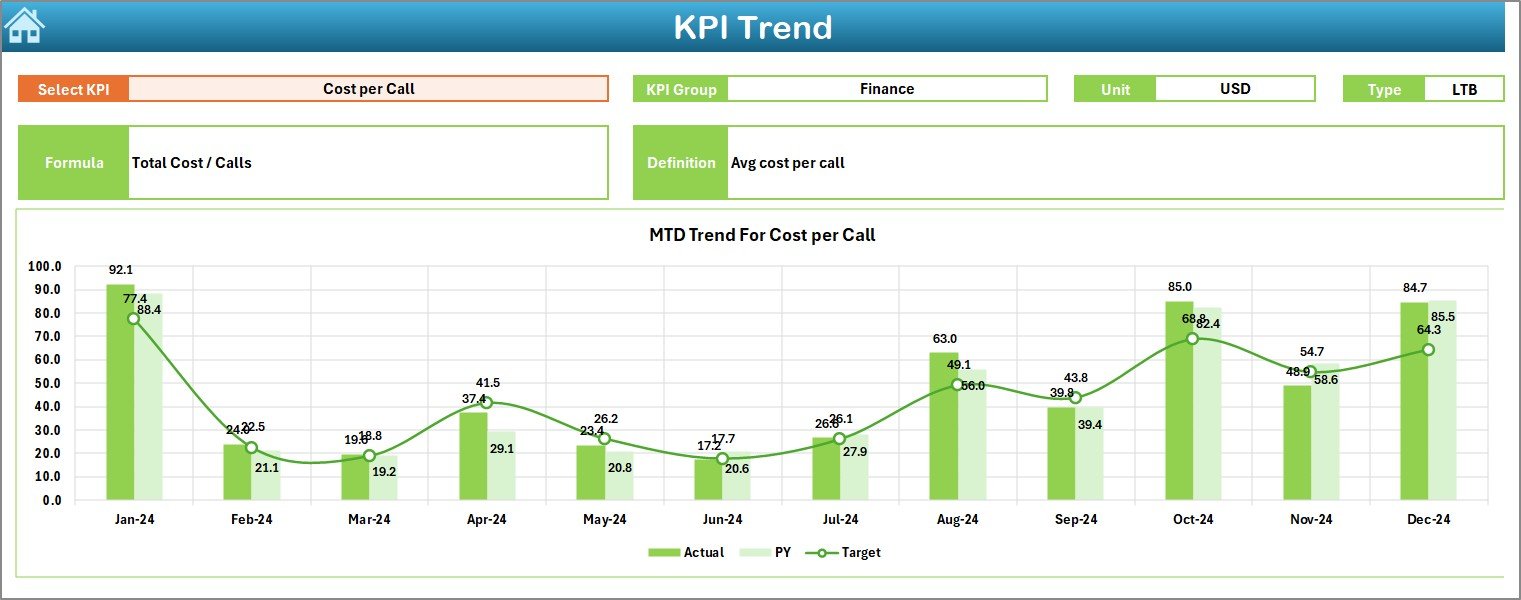
Trend Sheet – How Can EMS Teams Analyze KPI Trends?
The Trend Sheet focuses on KPI-level trend analysis.
Interactive Controls
- KPI selection dropdown at cell C3
- Dynamic update of all related details
Information Displayed on the Trend Sheet
- KPI Group
- KPI Unit
- KPI Type (Lower the Better / Upper the Better)
- KPI Formula
- KPI Definition
Trend Analysis Charts
- MTD trend for Actual, Target, and Previous Year
- YTD trend for Actual, Target, and Previous Year
Because trends reveal performance patterns, this sheet helps EMS leaders anticipate issues before they escalate.
Click to buy Emergency Medical Services KPI Dashboard in Excel
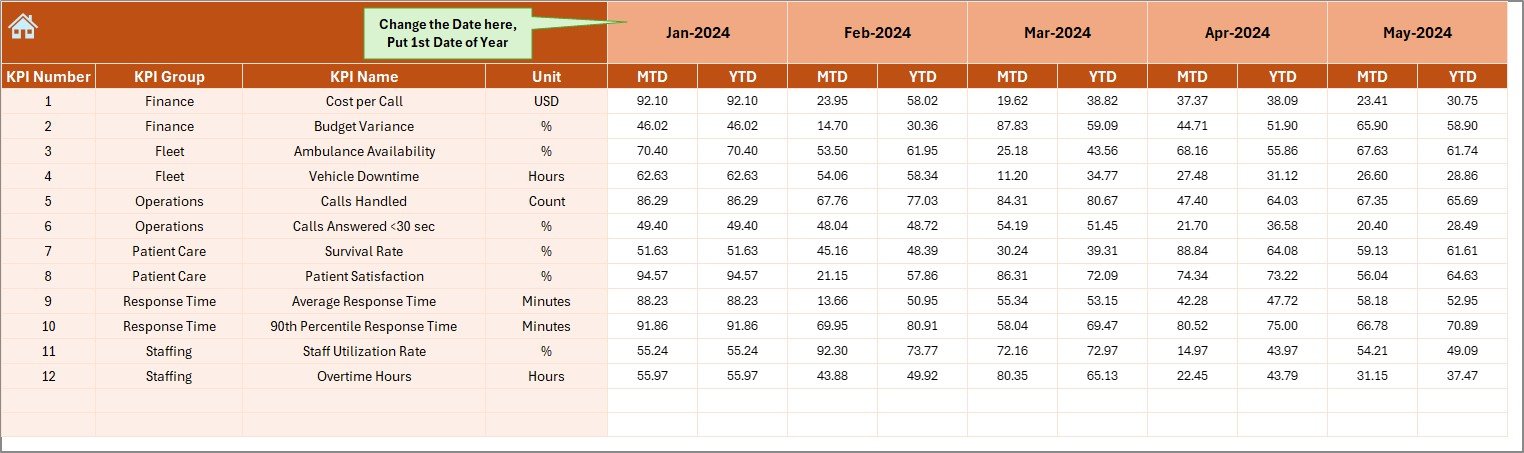
Actual Numbers Input Sheet – How to Enter Actual EMS Data?
The Actual Numbers Input Sheet allows users to enter real EMS performance data.
Key Functionalities
- Enter MTD and YTD actual values
- Change the financial year start month at cell E1
- Automatic month sequencing based on selection
This structured input ensures data accuracy and consistency across the dashboard.
Click to buy Emergency Medical Services KPI Dashboard in Excel
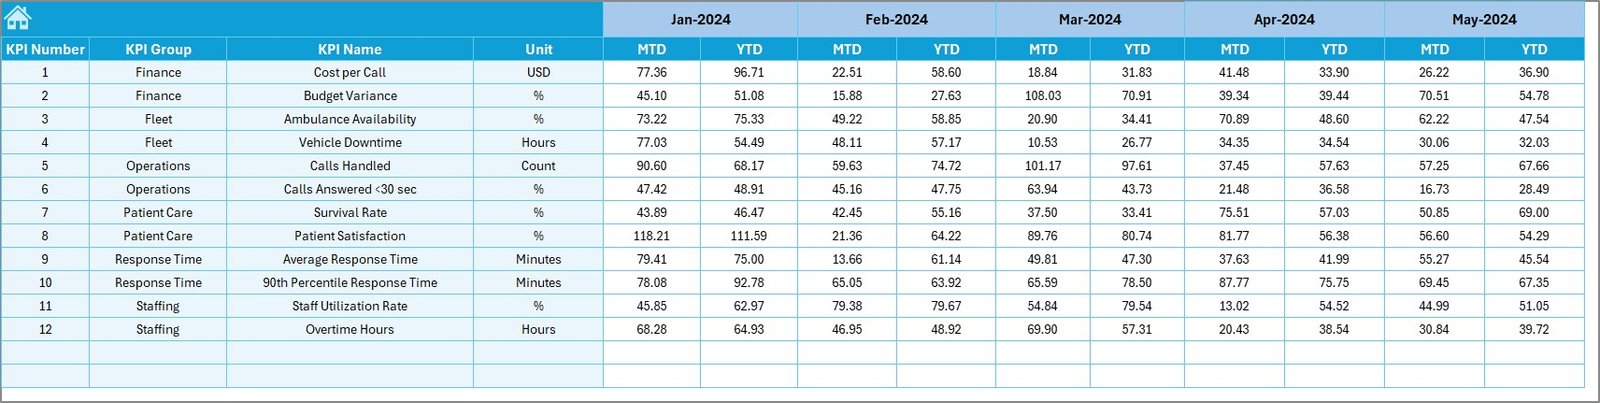
Target Sheet – How Are EMS Performance Targets Managed?
The Target Sheet helps organizations define expected performance levels.
Target Data Entry
- Enter monthly MTD targets
- Enter cumulative YTD targets
- Maintain consistency across all KPIs
By defining clear targets, EMS leaders can align operations with strategic goals.
Click to buy Emergency Medical Services KPI Dashboard in Excel
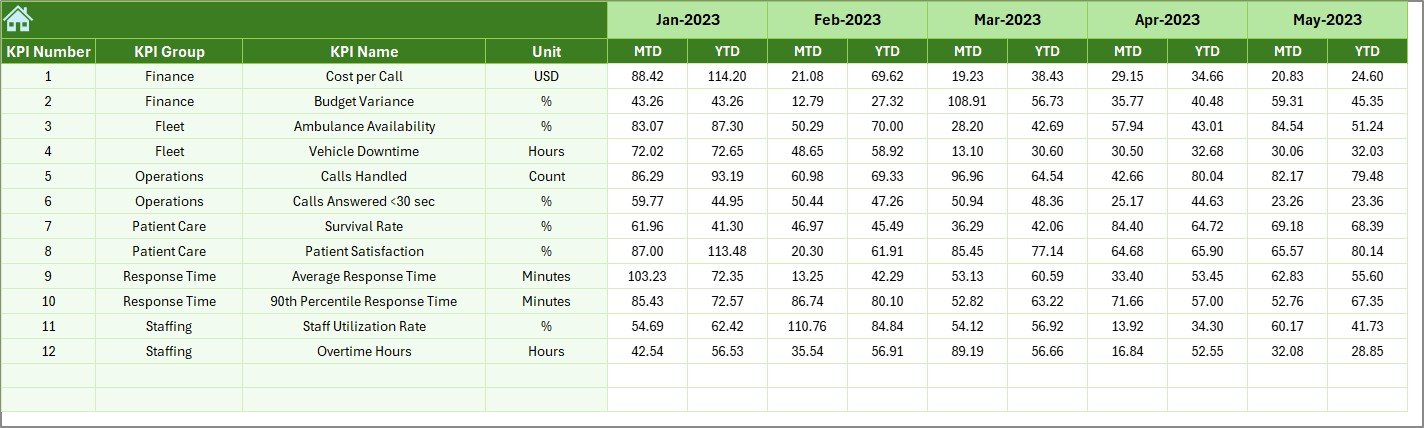
Previous Year Numbers Sheet – Why Is Historical Comparison Important?
The Previous Year Numbers Sheet captures historical EMS data.
Benefits of Using Previous Year Data
- Enables year-over-year performance comparison
- Highlights long-term improvement or decline
- Supports realistic target setting
Since EMS performance evolves over time, historical benchmarking becomes critical.
Click to buy Emergency Medical Services KPI Dashboard in Excel
KPI Definition Sheet – Why Is KPI Standardization Critical?
The KPI Definition Sheet acts as the foundation of the dashboard.
Information Captured in This Sheet
- KPI Name
- KPI Group
- Unit of Measurement
- KPI Formula
- KPI Definition
Because this sheet standardizes KPIs, it ensures consistency, transparency, and shared understanding across teams.
What Are Common KPIs Used in an Emergency Medical Services KPI Dashboard in Excel?
An EMS KPI Dashboard can include various operational, clinical, and financial KPIs.
Examples of EMS KPIs
- Average Response Time
- On-Time Response Percentage
- Call Volume per Month
- Patient Transport Time
- Ambulance Utilization Rate
- Crew Availability Rate
- Cost per Call
- Patient Satisfaction Score
By tracking these KPIs, EMS organizations gain actionable insights into service quality and efficiency.
Advantages of Emergency Medical Services KPI Dashboard in Excel
Implementing an EMS KPI Dashboard in Excel delivers multiple benefits.
Key Advantages
- Centralized KPI tracking
- Real-time MTD and YTD visibility
- Easy month and KPI selection
- No dependency on complex BI tools
- Cost-effective and scalable
- Faster decision-making
- Improved accountability
Because Excel remains widely used, adoption becomes quick and seamless.
Who Can Use an Emergency Medical Services KPI Dashboard in Excel?
This dashboard supports a wide range of users.
Ideal Users
- EMS Operations Managers
- Hospital Administrators
- Emergency Department Heads
- Quality and Performance Analysts
- Government Health Agencies
- Ambulance Service Providers
Each stakeholder benefits from tailored insights and simplified reporting.
Best Practices for the Emergency Medical Services KPI Dashboard in Excel
To maximize value, EMS organizations should follow proven best practices.
Best Practices You Should Follow
- Define KPIs clearly before implementation
- Update actual data on a fixed schedule
- Validate targets and historical data regularly
- Use trend analysis for proactive planning
- Limit KPIs to what truly matters
- Train users on dashboard navigation
- Review dashboard insights in management meetings
By following these practices, teams ensure accuracy, reliability, and impact.
How Does This Dashboard Support Better Decision-Making?
Because the dashboard combines current performance, targets, and historical benchmarks, it supports evidence-based decisions.
Decision-Making Benefits
- Faster identification of response delays
- Better resource allocation
- Improved service quality
- Enhanced accountability
- Data-driven operational planning
As a result, EMS organizations move from reactive management to proactive leadership.
Conclusion: Why Should You Use an Emergency Medical Services KPI Dashboard in Excel?
An Emergency Medical Services KPI Dashboard in Excel transforms raw EMS data into meaningful insights. Moreover, it simplifies performance tracking, enhances transparency, and supports faster decision-making.
Because the dashboard includes structured worksheets, dynamic visuals, and standardized KPIs, it becomes a reliable performance management tool. Therefore, EMS organizations looking to improve efficiency, response times, and patient outcomes should strongly consider adopting this Excel-based solution.
Frequently Asked Questions (FAQs)
- What is an Emergency Medical Services KPI Dashboard in Excel?
An EMS KPI Dashboard in Excel is a performance tracking tool that monitors EMS KPIs using dynamic tables, charts, and comparisons inside Excel.
- Can non-technical users operate this dashboard?
Yes, the dashboard uses simple dropdowns, buttons, and structured input sheets, making it user-friendly.
- Can I customize the KPIs in the dashboard?
Yes, you can easily modify KPI names, formulas, targets, and definitions from the KPI Definition sheet.
- Does the dashboard support MTD and YTD analysis?
Yes, it provides both MTD and YTD analysis along with target and previous-year comparisons.
- Is Excel suitable for EMS performance tracking?
Absolutely. Excel offers flexibility, affordability, and ease of use, making it ideal for EMS KPI dashboards.
- How often should EMS data be updated?
Ideally, EMS data should be updated monthly or weekly, depending on reporting requirements.
- Can this dashboard support long-term performance improvement?
Yes, trend analysis and historical comparison enable continuous improvement and strategic planning.
Visit our YouTube channel to learn step-by-step video tutorials
Watch the step-by-step video tutorial:
Click to buy Emergency Medical Services KPI Dashboard in Excel