Employee engagement is a key driver of productivity, satisfaction, and retention in any organization. The Employee Engagement Dashboard in Excel provides a ready-to-use solution for HR teams and managers to track engagement metrics, analyze trends, and take actionable steps to improve workplace culture.
This article explains the features, advantages, and best practices of using this dashboard.
What Is an Employee Engagement Dashboard?
An Employee Engagement Dashboard is a visual and interactive Excel tool that consolidates employee engagement and satisfaction metrics. It tracks participation in surveys, training, recognition programs, projects, and other key indicators that reflect employee involvement and morale.
By using this dashboard, organizations can:
-
Monitor engagement scores across departments, locations, and job roles
-
Identify high-performing and under-engaged employees or teams
-
Analyze trends over time to implement improvements
-
Make data-driven decisions to enhance employee experience
Key Features of the Employee Engagement Dashboard
Click to Buy Employee Engagement Dashboard in Excel
This dashboard contains multiple sheets to provide a comprehensive view of employee engagement metrics.
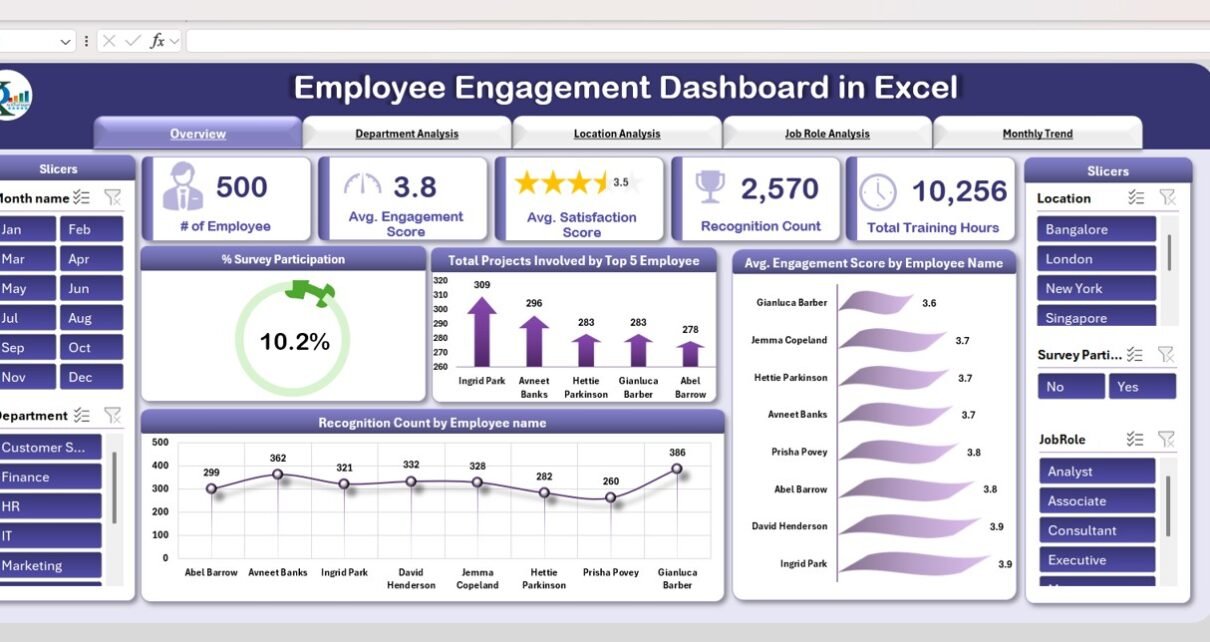
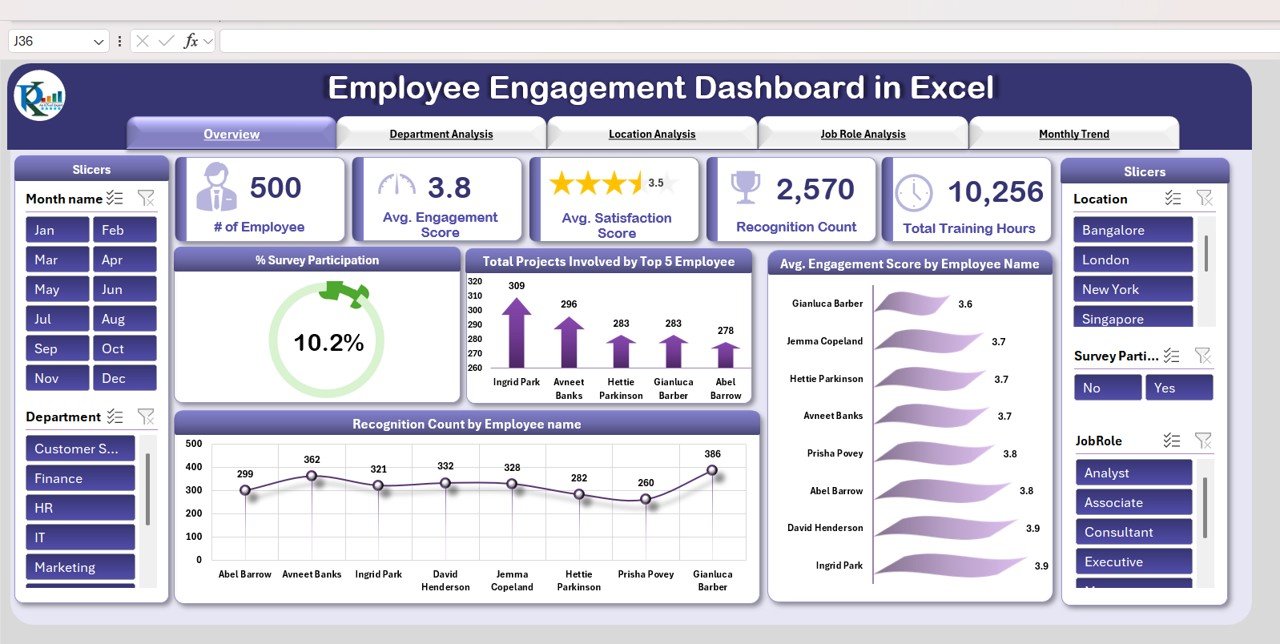
1. Overview Sheet Tab
The Overview Sheet provides a high-level snapshot of engagement across the organization.
Cards:
-
# of Employees – Total number of employees tracked
-
Average Engagement Score – Overall engagement rating across employees
-
Average Satisfaction Score – Overall satisfaction rating
-
Recognition Count – Number of recognition events given
-
Total Training Hours – Cumulative training hours completed
Charts:
-
% Survey Participation – Measures the proportion of employees who completed surveys
-
Total Projects Involved by Top 5 Employees – Highlights high contributors
-
Average Engagement Score by Employee Name – Individual engagement visualization
-
Recognition Count by Employee Name – Shows which employees received the most recognition
Click to Buy Employee Engagement Dashboard in Excel
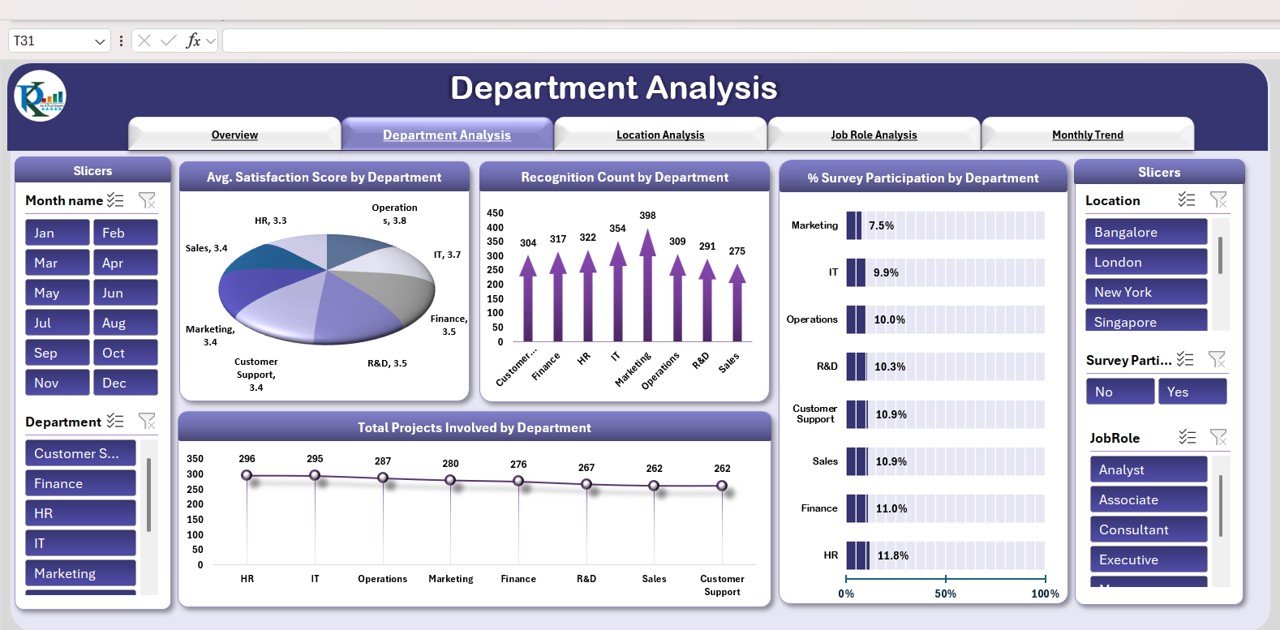
2. Department Analysis
This sheet provides insights at the departmental level:
Charts:
-
Average Satisfaction Score by Department
-
Recognition Count by Department
-
% Survey Participation by Department
-
Total Projects Involved by Department
This helps managers identify departments with lower engagement and take corrective actions.
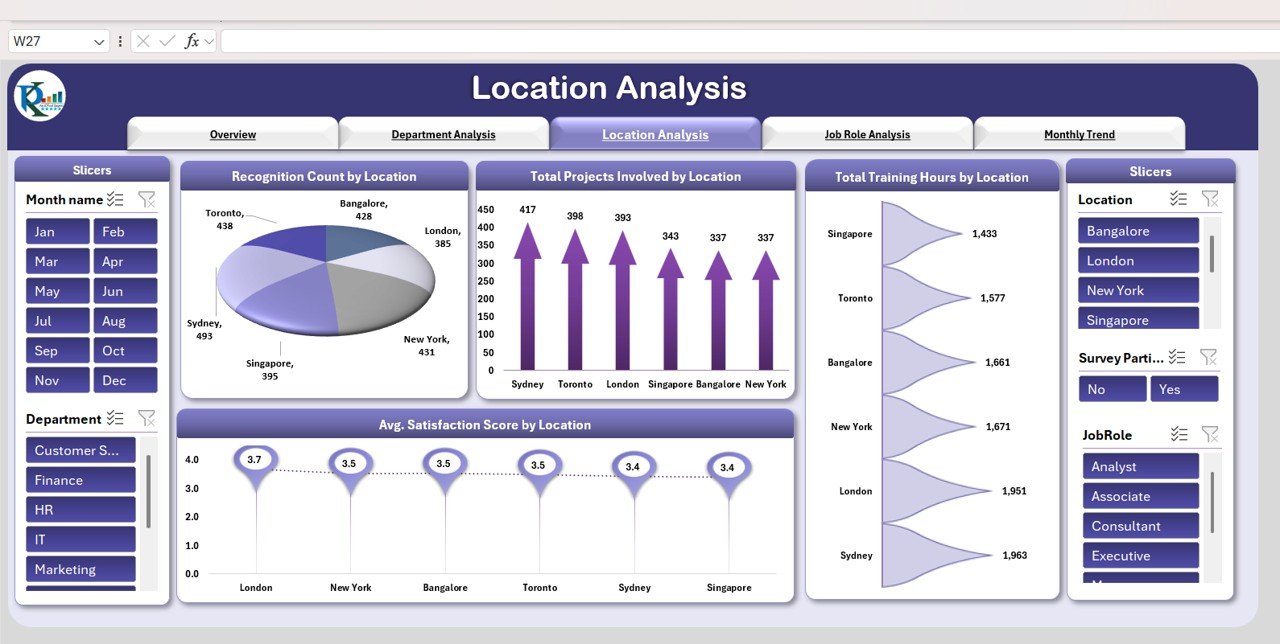
3. Location Analysis
The Location Analysis sheet evaluates employee engagement across various offices or sites:
Charts:
-
Recognition Count by Location
-
Total Projects Involved by Location
-
Total Training Hours by Location
-
Average Satisfaction Score by Location
This allows HR teams to compare locations and implement location-specific engagement initiatives.
Click to Buy Employee Engagement Dashboard in Excel
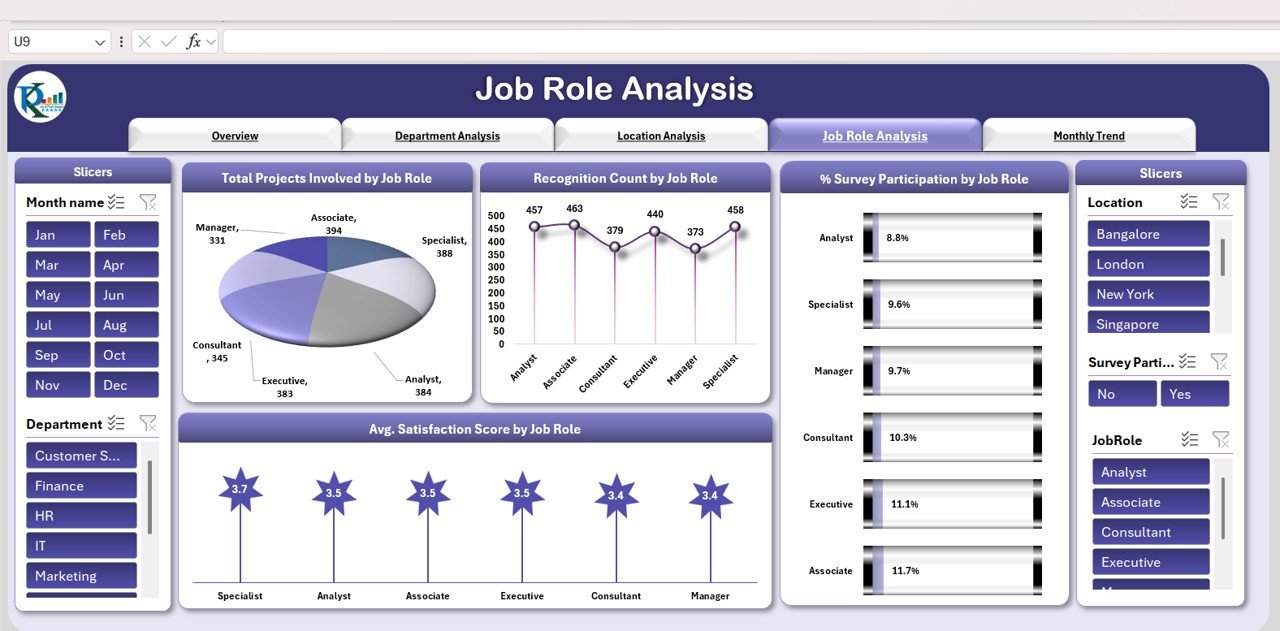
4. Job Role Analysis
The Job Role Analysis sheet examines engagement metrics across different job roles:
Charts:
-
Total Projects Involved by Job Role
-
Recognition Count by Job Role
-
% Survey Participation by Job Role
-
Average Satisfaction Score by Job Role
By analyzing job roles, organizations can identify positions that may require additional recognition, training, or support.
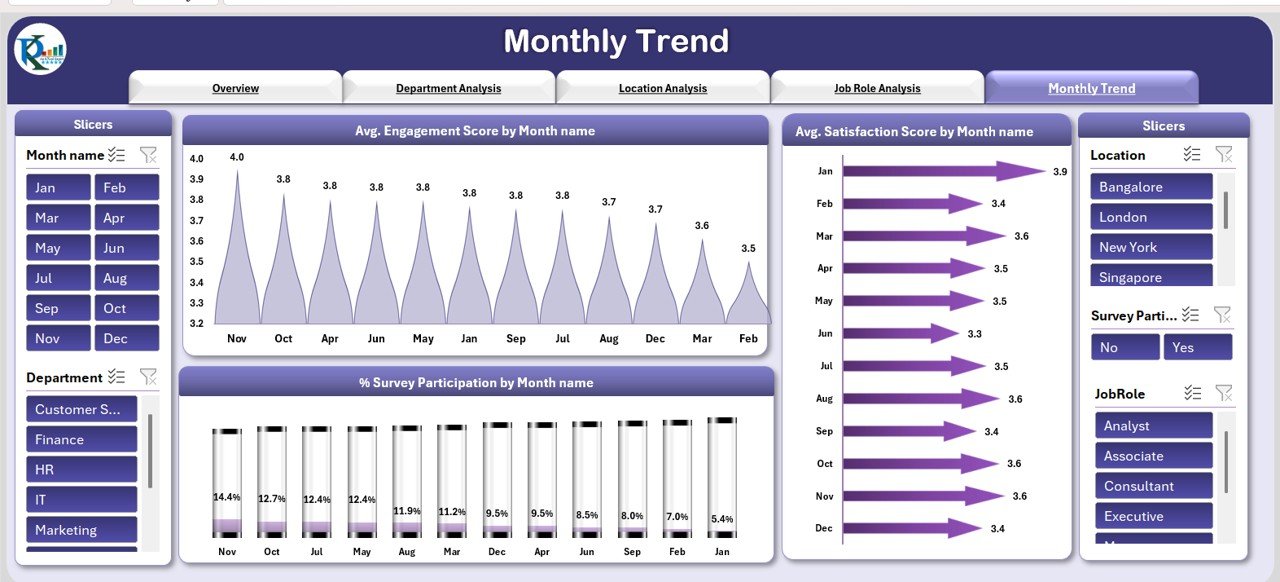
5. Monthly Trend
The Monthly Trend sheet provides a time-based analysis of engagement metrics:
Charts:
-
Average Engagement Score by Month
-
Average Satisfaction Score by Month
-
% Survey Participation by Month
This helps HR monitor trends, identify improvements or declines, and measure the impact of engagement initiatives over time.
Click to Buy Employee Engagement Dashboard in Excel
6. Data Sheet Tab
The Data Sheet serves as the input sheet where all employee engagement information is recorded:
-
Survey responses, project involvement, recognition events, training hours, and other key metrics
-
Data updates in this sheet automatically reflect across all dashboard sheets
This ensures real-time tracking and reliable reporting.
Advantages of Using the Employee Engagement Dashboard
-
Centralized Tracking: All engagement metrics in one Excel file
-
Real-Time Insights: Dashboards update automatically when new data is entered
-
Visual Analysis: Charts and cards make trends easy to interpret
-
Identify Gaps: Quickly spot low engagement in departments, locations, or job roles
-
Support HR Strategy: Use insights to improve recognition, training, and satisfaction programs
-
Customizable: Add or remove KPIs based on organizational priorities
Best Practices for Using the Dashboard
-
Update Data Regularly: Ensure all survey, training, and recognition data is recorded promptly
-
Segment Data Effectively: Track engagement by department, location, and job role for detailed insights
-
Monitor Trends Over Time: Use the Monthly Trend sheet to analyze changes in engagement metrics
-
Focus on Actionable Metrics: Prioritize initiatives in areas with lower engagement or satisfaction
-
Communicate Results: Share insights with leadership and employees to improve transparency
-
Adjust KPIs as Needed: Modify dashboard metrics to align with organizational goals and programs
How This Dashboard Helps HR Teams
Click to Buy Employee Engagement Dashboard in Excel
-
Monitor Engagement: Track participation in surveys, training, and recognition programs
-
Evaluate Employee Experience: Identify satisfaction and engagement trends across employees
-
Support Decision-Making: Implement initiatives to improve retention, morale, and productivity
-
Recognize Top Performers: Highlight high-contributing employees and reward engagement
-
Plan Training and Development: Allocate resources based on engagement and performance trends
Frequently Asked Questions (FAQs)
Click to Buy Employee Engagement Dashboard in Excel
Q1: Can I add more KPIs to the dashboard?
Yes, the dashboard is fully customizable. You can track additional metrics such as wellness scores, performance ratings, or employee feedback.
Q2: How often should data be updated?
Monthly updates are ideal, but you can update more frequently depending on survey and program cycles.
Q3: Can this dashboard track engagement by location and department simultaneously?
Yes, you can filter and segment data by both location and department for detailed insights.
Q4: Is this dashboard suitable for large organizations?
Absolutely. The structured data input sheet allows for scalable tracking across thousands of employees.
Q5: Can the dashboard track engagement trends over time?
Yes, the Monthly Trend sheet visualizes changes in engagement, satisfaction, and participation over time.
Conclusion
The Employee Engagement Dashboard in Excel is a comprehensive, ready-to-use tool for tracking and improving employee engagement. By consolidating survey data, recognition events, training hours, and project involvement, HR teams can identify trends, address gaps, and foster a more motivated and productive workforce.
Visit our YouTube channel to learn step-by-step video tutorials
Youtube.com/@NeotechNavigators
Watch the step-by-step video Demo:
Click to Buy Employee Engagement Dashboard in Excel