Ensuring that employee training is effective is crucial for any organization. The Employee Training Effectiveness Dashboard in Excel is a ready-to-use tool designed to help HR teams and training coordinators track, measure, and analyze the effectiveness of their training programs. This dashboard provides visual insights into key performance indicators (KPIs) related to training effectiveness, allowing you to monitor the success of each training program, identify areas for improvement, and make data-driven decisions.
In this article, we will explain the key features of the Employee Training Effectiveness Dashboard in Excel and how it can help streamline your training analysis process.
What is the Employee Training Effectiveness Dashboard in Excel?
The Employee Training Effectiveness Dashboard in Excel is a powerful tool for measuring and evaluating the effectiveness of training programs within your organization. It tracks multiple metrics, such as pre- and post-training scores, feedback ratings, certification rates, and training completion rates, and visualizes these metrics through various charts and cards. This dashboard provides real-time insights into the impact of your training programs, enabling HR teams and managers to optimize training sessions for better employee performance.
The dashboard is divided into multiple sheets to give you a comprehensive view of your training data
Key Features of the Employee Training Effectiveness Dashboard
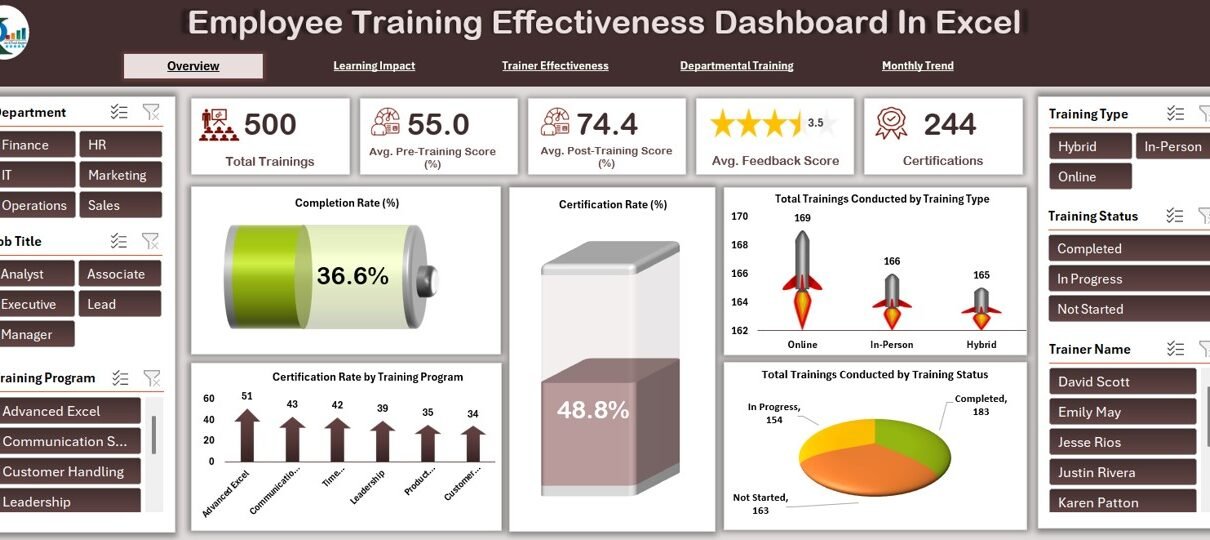
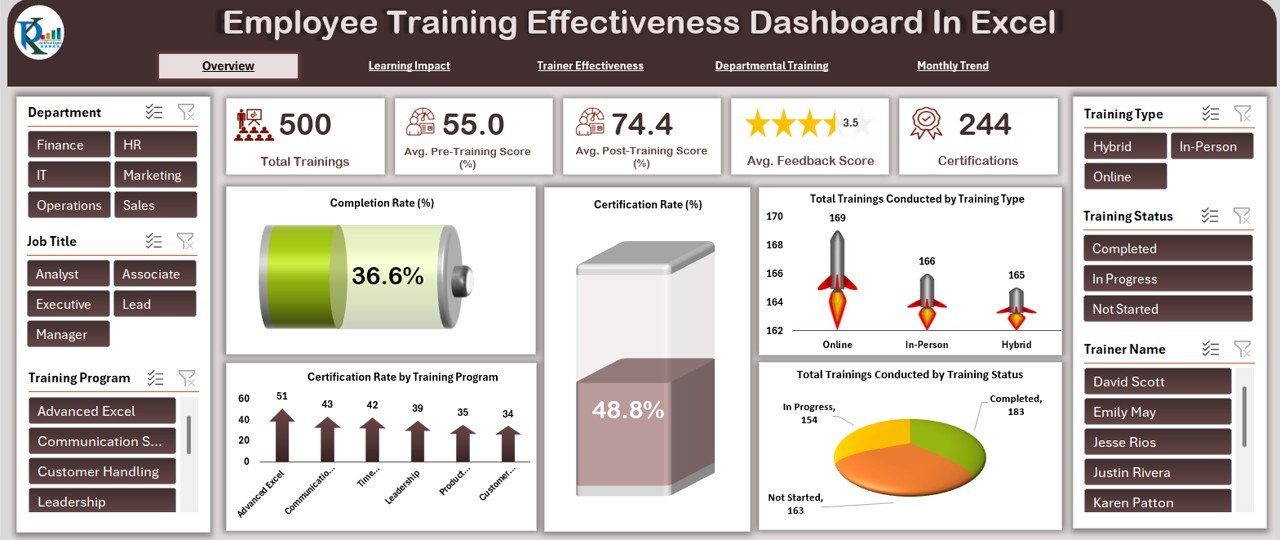
1) Overview Sheet Tab: High-Level Insights
The Overview Sheet Tab provides a quick summary of key training metrics. This sheet includes:
Cards:
- Total Trainings Conducted: Displays the total number of training sessions held.
- Avg. Pre-Training Score (%): The average score of employees before the training session.
- Avg. Post-Training Score (%): The average score of employees after the training session.
- Avg. Feedback Score: The average feedback rating from employees (on a scale of 1–5).
- Certifications: Displays the total number of certifications awarded upon completion.
Charts:
- Completion Rate (%): Shows the percentage of training sessions that were completed.
- Certification Rate (%): Displays the percentage of participants who earned certifications.
- Total Trainings Conducted by Training Type: Breaks down the number of trainings conducted by type (e.g., technical, soft skills).
- Total Trainings Conducted by Training Status: Categorizes the trainings by their status (e.g., completed, in progress).
- Certification Rate by Training Program: Tracks the certification rate for each training program.
This sheet helps you quickly assess the overall performance of your training programs.
Click to buy Employee Training Effectiveness Dashboard in Excel
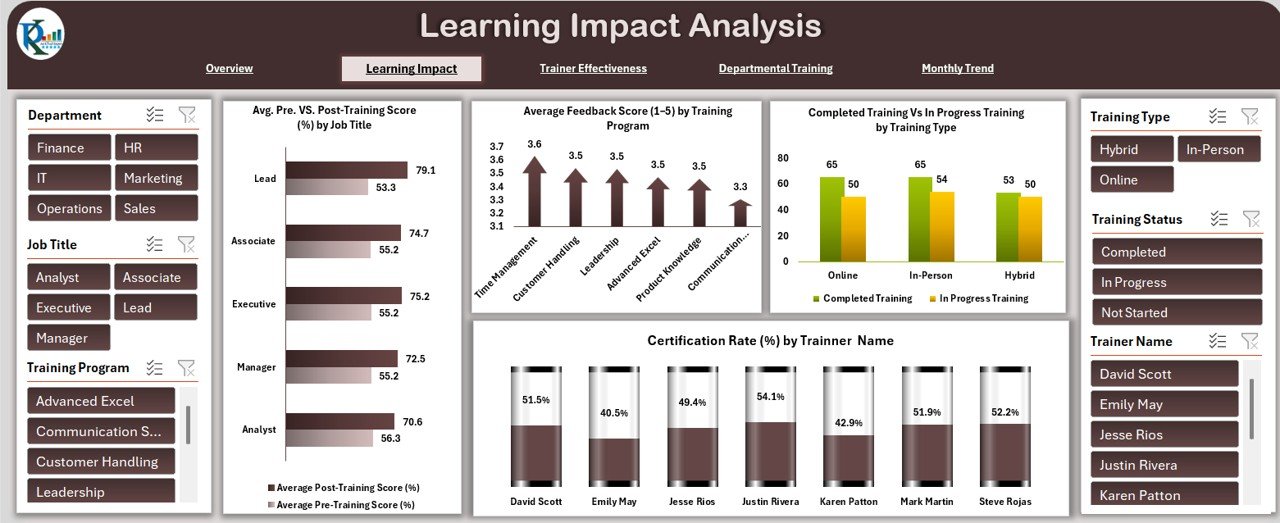
2) Learning Impact Analysis Sheet Tab: Measuring Training Effectiveness
The Learning Impact Analysis Sheet Tab is designed to evaluate the effectiveness of training programs by comparing pre- and post-training scores. Features include:
Charts:
- Avg. Pre. VS. Post-Training Score (%) by Job Title: Compares the average pre- and post-training scores for employees in different job titles.
- Average Feedback Score (1–5) by Training Program: Displays the average feedback score for each training program.
- Completed Training Vs In Progress Training by Training Type: Tracks the number of completed and ongoing training sessions categorized by training type.
- Certification Rate (%) by Trainer Name: Displays the certification rate by each trainer.
This sheet is ideal for measuring the impact of your training programs and understanding how they influence employee learning outcomes.
3) Trainer Effectiveness Sheet Tab: Evaluating Trainer Performance
The Trainer Effectiveness Sheet Tab helps you analyze the performance of trainers. It includes:
Charts:
- Total Trainings Conducted by Trainer Name: Displays the total number of training sessions conducted by each trainer.
- Completion Rate (%) by Trainer Name: Shows the completion rate for each trainer.
- Avg. Pre. VS. Post-Training Score (%) by Trainer: Compares the average pre- and post-training scores for each trainer’s sessions.
- In Progress Vs Completed Training by Trainer: Tracks the number of in-progress and completed training sessions by trainer.
This sheet helps you identify the most effective trainers and assess their ability to engage participants and improve learning outcomes.

Click to buy Employee Training Effectiveness Dashboard in Excel
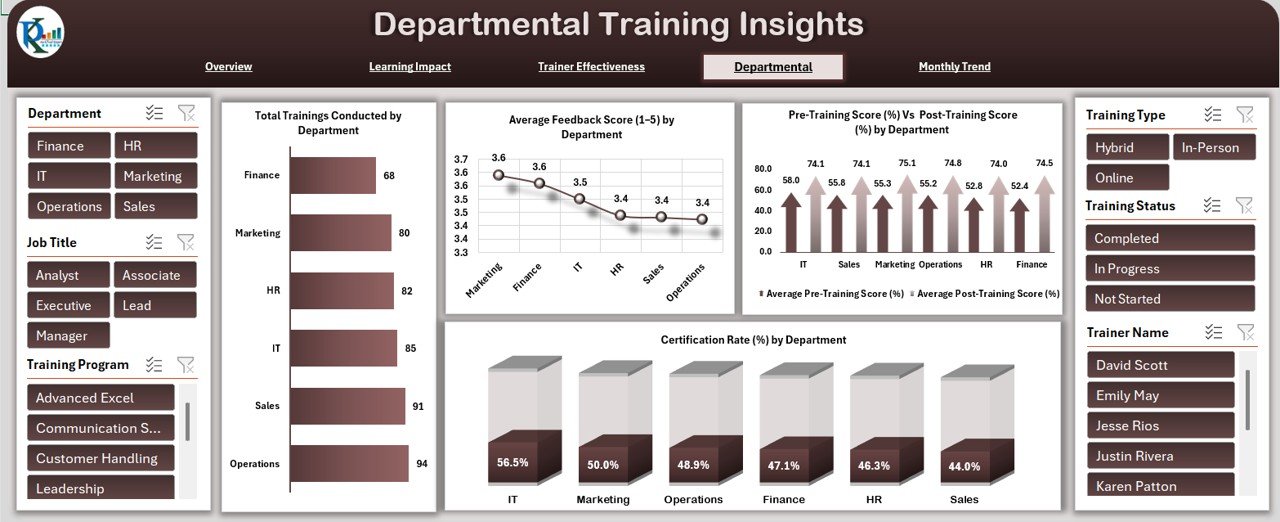
4) Departmental Training Insights Sheet Tab: Department-Level Analysis
The Departmental Training Insights Sheet Tab provides insights into how different departments are performing in terms of training effectiveness. Features include:
Charts:
- Total Trainings Conducted by Department: Displays the number of training sessions conducted by each department.
- Average Feedback Score (1–5) by Department: Shows the average feedback score by department.
- Pre-Training Score (%) Vs Post-Training Score (%) by Department: Compares the average pre- and post-training scores for each department.
- Certification Rate (%) by Department: Displays the certification rate for each department.
This sheet helps you analyze training performance at the departmental level and identify areas where training may need to be improved.
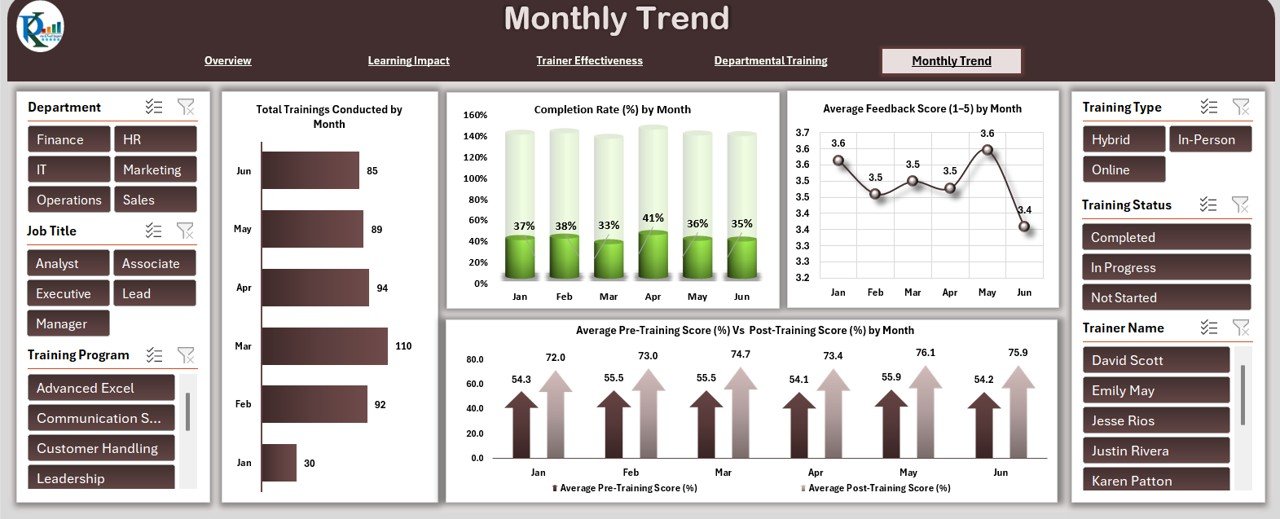
5) Monthly Trend Sheet Tab: Track Training Trends Over Time
The Monthly Trend Sheet Tab provides insights into the trends of key metrics on a monthly basis. Features include:
Charts:
- Total Trainings Conducted by Month: Displays the number of training sessions held each month.
- Completion Rate (%) by Month: Tracks the completion rate for each month.
- Average Feedback Score (1–5) by Month: Shows the average feedback score for each month.
- Average Pre-Training Score (%) Vs Post-Training Score (%) by Month: Compares the average pre- and post-training scores for each month.
This sheet allows you to monitor training performance trends over time, helping you assess whether training efforts are improving or declining.
Click to buy Employee Training Effectiveness Dashboard in Excel
6) Data Sheet Tab: Centralized Data Input
The Data Sheet Tab is where all training-related data is entered. Key columns include:
- ID: A unique identifier for each training session.
- Project Name: The name of the training program.
- Trainer Name: The name of the trainer.
- Department: The department responsible for the training.
- Pre-Training Score: The score of employees before the training.
- Post-Training Score: The score of employees after the training.
- Feedback Score: The feedback rating from participants (on a scale of 1–5).
- Certification Status: Whether the participant received certification (Yes/No).
- Training Duration: The duration of the training.
- Training Type: The type of training (e.g., technical, soft skills).
- Comments: Any additional notes or comments about the training.
This sheet ensures that all necessary training data is captured and organized for analysis.
Benefits of Using the Employee Training Effectiveness Dashboard
Click to buy Employee Training Effectiveness Dashboard in Excel
The Employee Training Effectiveness Dashboard in Excel offers several key benefits:
-
Centralized Data Management: All training data is organized in one place, making it easy to track and analyze performance.
-
Real-Time Insights: The dashboard provides real-time data visualization, helping HR teams monitor training effectiveness as it happens.
-
Informed Decision Making: The data-driven insights enable organizations to make informed decisions on improving training programs and employee development.
-
Trainer Evaluation: The ability to evaluate trainers’ effectiveness helps ensure that the right trainers are selected for each training session.
-
Department-Level Insights: Analyze training performance by department, allowing you to tailor training efforts to specific organizational needs.
-
Progress Tracking: Track training progress over time with the monthly trend analysis, ensuring that training programs remain effective and up-to-date.
Best Practices for Using the Employee Training Effectiveness Dashboard
To make the most of the Employee Training Effectiveness Dashboard, follow these best practices:
-
Update Regularly: Ensure that all training data is updated regularly to reflect new sessions, feedback, and performance metrics.
-
Monitor Key Metrics: Focus on key performance indicators such as post-training scores, completion rates, and feedback to gauge the effectiveness of your training programs.
-
Review Trainer Performance: Use the Trainer Effectiveness sheet to identify top-performing trainers and areas where improvement is needed.
-
Customize for Your Organization: Tailor the dashboard to your organization’s specific training goals, whether that means adding custom fields or modifying the charts.
-
Share with Your Team: Share the dashboard with relevant stakeholders to ensure alignment and collaboration in training program improvement.
Conclusion
Click to buy Employee Training Effectiveness Dashboard in Excel
The Employee Training Effectiveness Dashboard in Excel is a comprehensive tool for managing and analyzing training programs within your organization. With its powerful data visualization, real-time insights, and easy-to-use interface, this dashboard helps HR teams and managers track training performance, evaluate trainers, and ensure the continuous improvement of employee development efforts.
Frequently Asked Questions (FAQs)
1. How do I update the Employee Training Effectiveness Dashboard?
You can update the dashboard by adding new training sessions, modifying existing records, and updating training scores. The charts and metrics will automatically update based on the new data.
2. Can I track multiple training programs with this dashboard?
Yes, the dashboard can track multiple training programs simultaneously, helping you monitor the effectiveness of each program.
3. How do I evaluate trainer performance?
Use the Trainer Effectiveness sheet to analyze key metrics such as the number of trainings conducted, completion rates, and pre- vs. post-training scores by trainer.
4. Can I track the effectiveness of training by department?
Yes, the Departmental Training Insights sheet helps you evaluate training effectiveness at the departmental level.
5. Can I share the dashboard with my team?
Yes, since the dashboard is built in Excel, you can easily share it with your team for collaboration and real-time updates.
Visit our YouTube channel to learn step-by-step video tutorials
Youtube.com/@NeotechNavigators
Watch the step-by-step video Demo:
Click to buy Employee Training Effectiveness Dashboard in Excel