Employee turnover is a critical metric for HR teams, reflecting both workforce stability and organizational health. Our Employee Turnover Dashboard in Power BI is a ready-to-use, interactive tool designed to help organizations track, analyze, and manage employee departures efficiently.
This dashboard is perfect for HR managers, team leads, and business leaders who want actionable insights into employee turnover trends, departmental impact, and workforce demographics.
Key Features
This dashboard is organized into multiple pages, each focusing on a specific aspect of employee turnover:
1. Overview Page
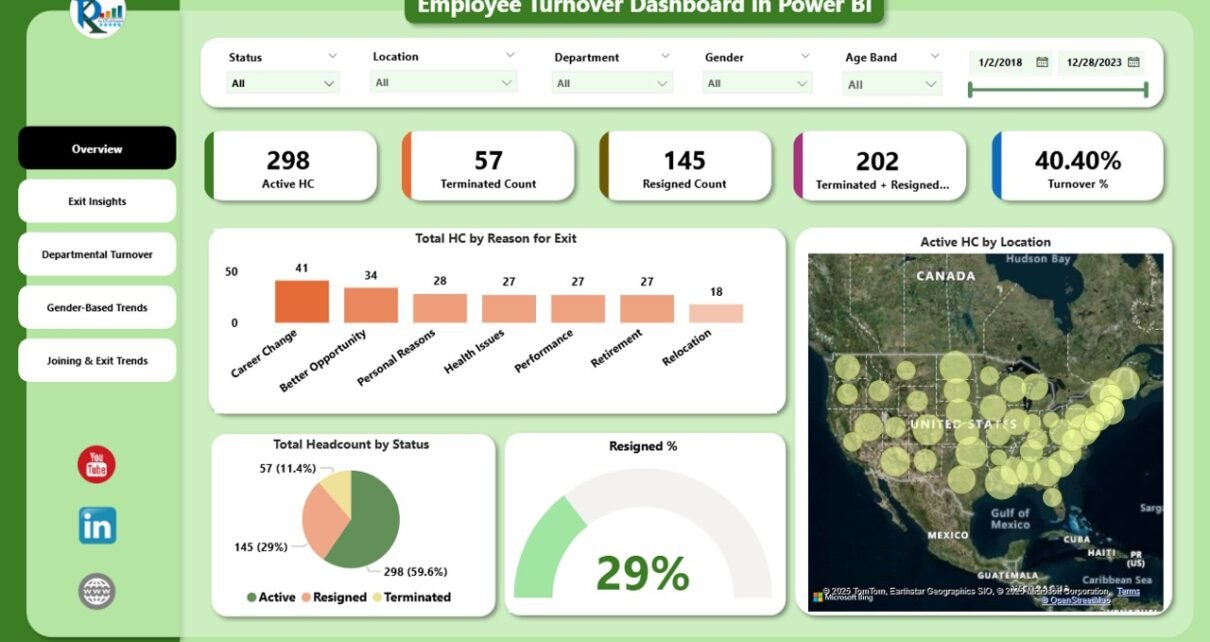
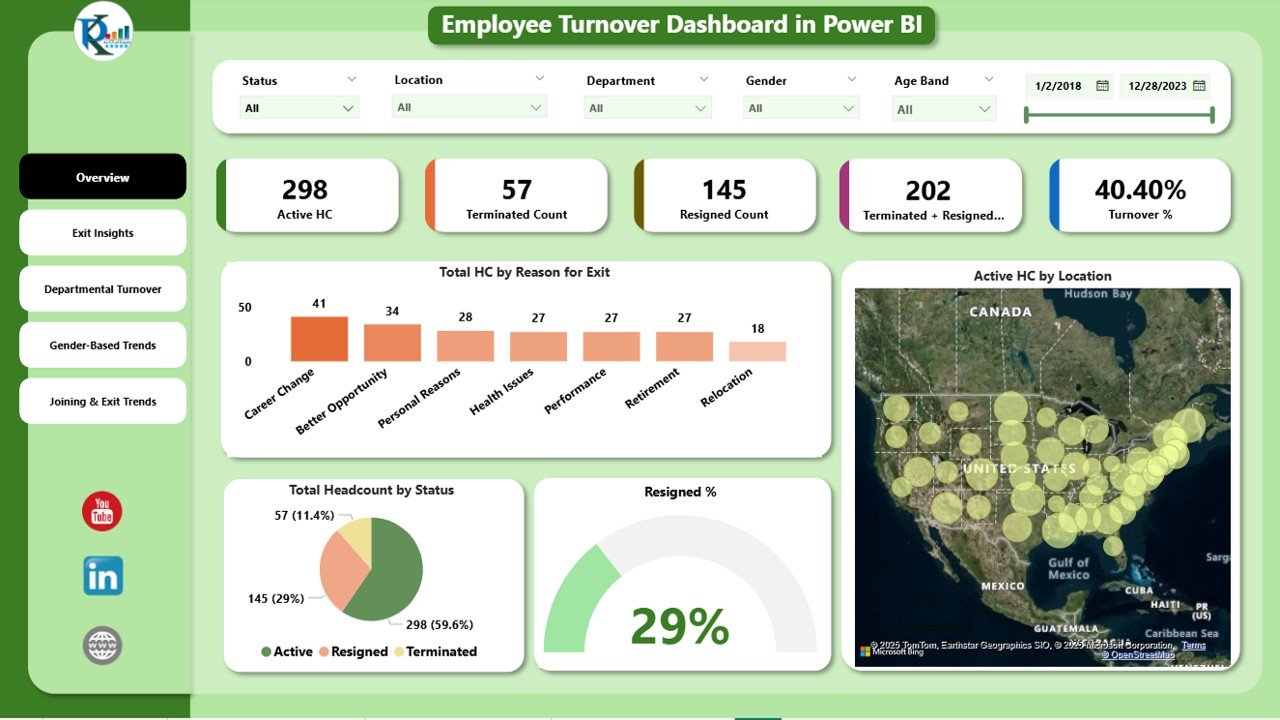
The Overview Page provides a high-level snapshot of your workforce and turnover metrics.
Cards Include:
-
Active HC: Total active headcount in the organization.
-
Resigned Count: Total number of employees who resigned.
-
Terminated + Resigned Count: Combined count of employees leaving voluntarily or involuntarily.
-
Terminated Count: Total number of employees terminated.
-
Turnover %: Overall turnover percentage for the organization.
Charts Include:
-
Total HC by Reason for Exit: Shows distribution of headcount based on exit reasons.
-
Active HC by Location: Breaks down current employees by geographic location.
-
Resigned %: Visualizes the percentage of employees resigning over a period.
-
Total Headcount by Status: Highlights active, terminated, and resigned employees.
Click to Buy Employee Turnover Dashboard in Power BI
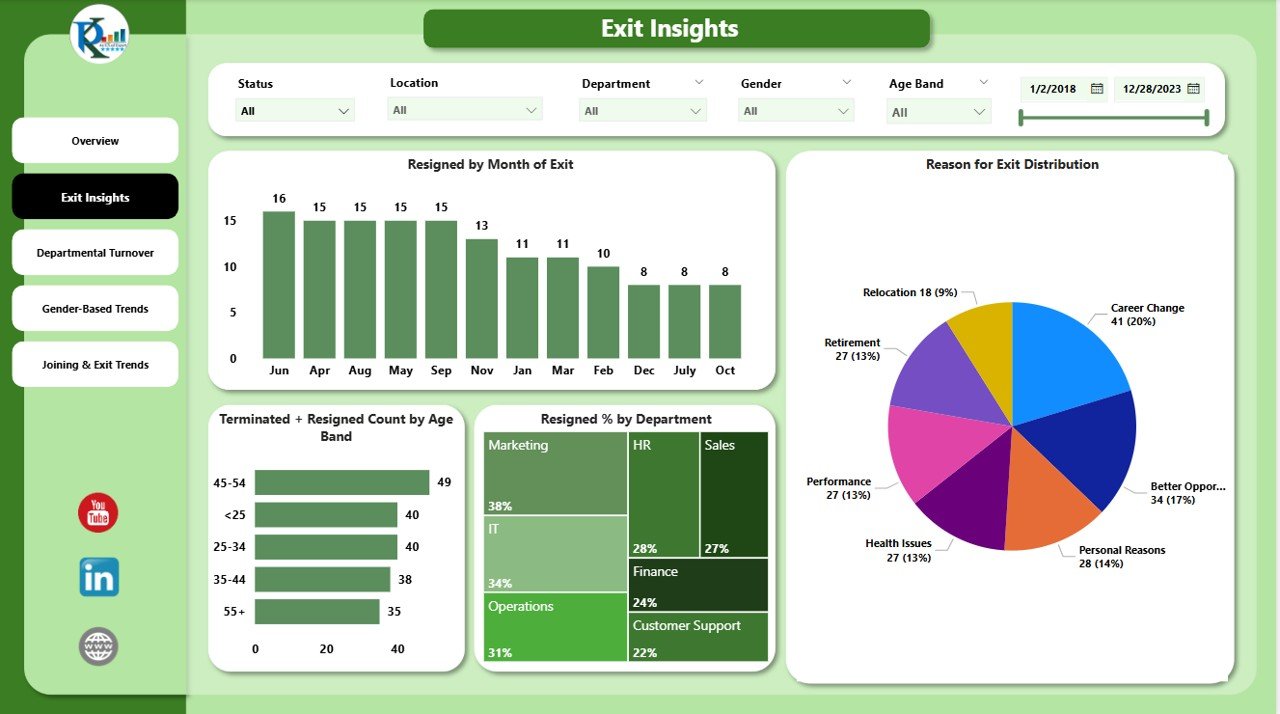
2. Exit Insights Page
The Exit Insights Page dives deeper into the reasons and patterns behind employee departures.
Charts Include:
-
Resigned by Month of Exit: Track monthly resignation trends.
-
Reason for Exit Distribution: Understand why employees leave.
-
Resigned % by Department: Department-level resignation percentages.
-
Terminated + Resigned Count by Age Band: Analyze turnover across different age groups.
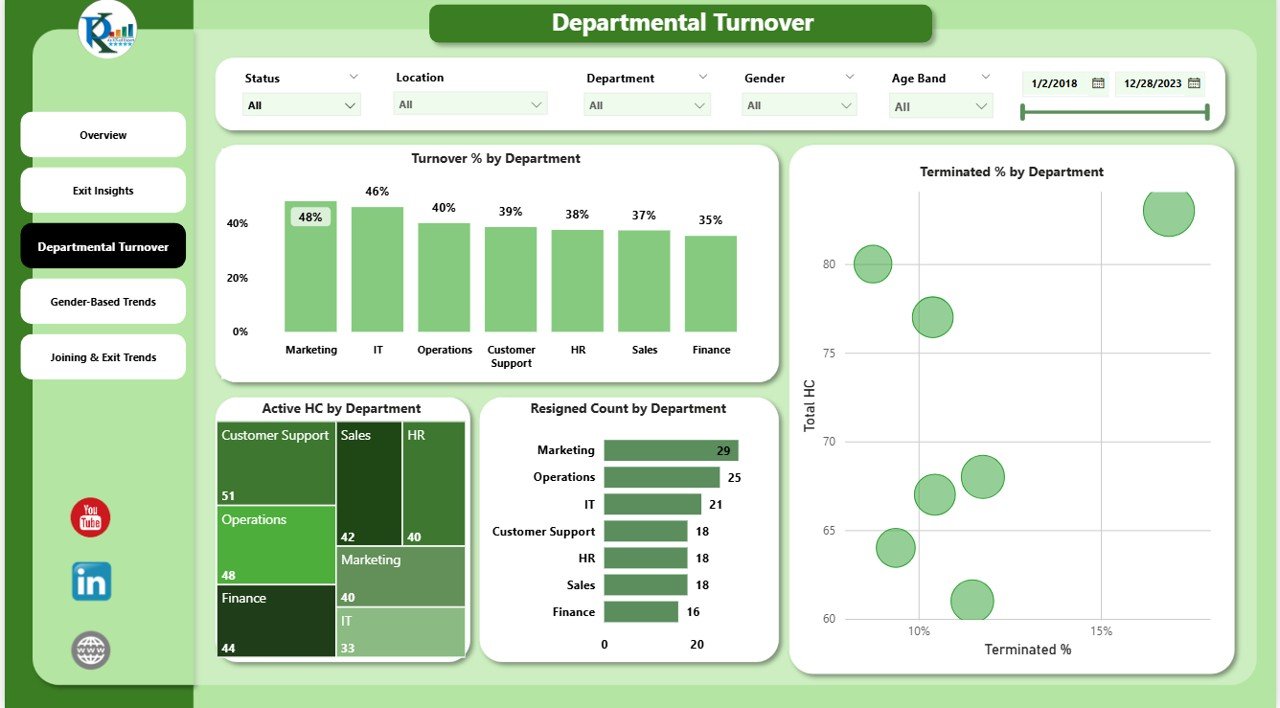
3. Departmental Turnover Page
The Departmental Turnover Page focuses on department-level analysis to identify areas of high attrition.
Charts Include:
-
Turnover % by Department: Compare turnover percentages across departments.
-
Resigned Count by Department: Total resignations per department.
-
Active HC by Department: Current active headcount by department.
-
Terminated % by Department: Termination percentages by department.
Click to Buy Employee Turnover Dashboard in Power BI
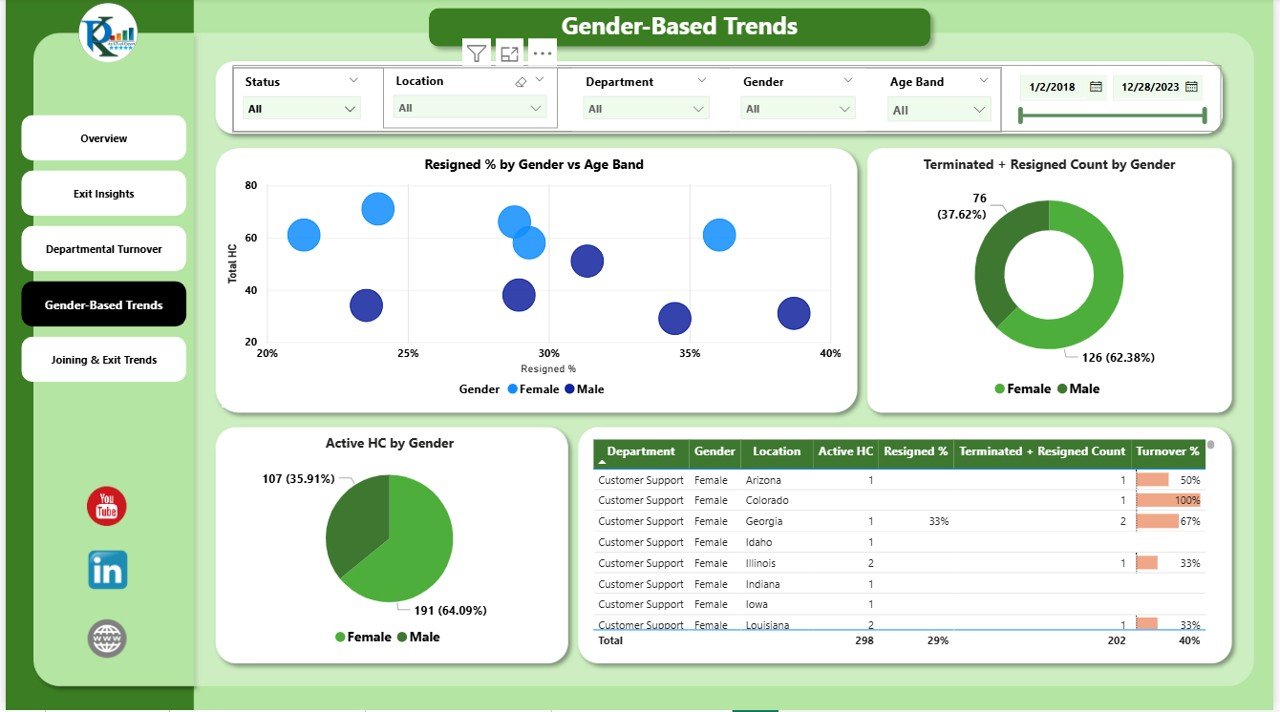
4. Gender-Based Trends Page
This page provides insights into employee turnover based on gender and age bands.
Charts Include:
-
Resigned % by Gender vs Age Band: Identify patterns of resignation across genders and age groups.
-
Terminated + Resigned Count by Gender: Overall exits by gender.
-
Active HC by Gender: Current workforce distribution by gender.
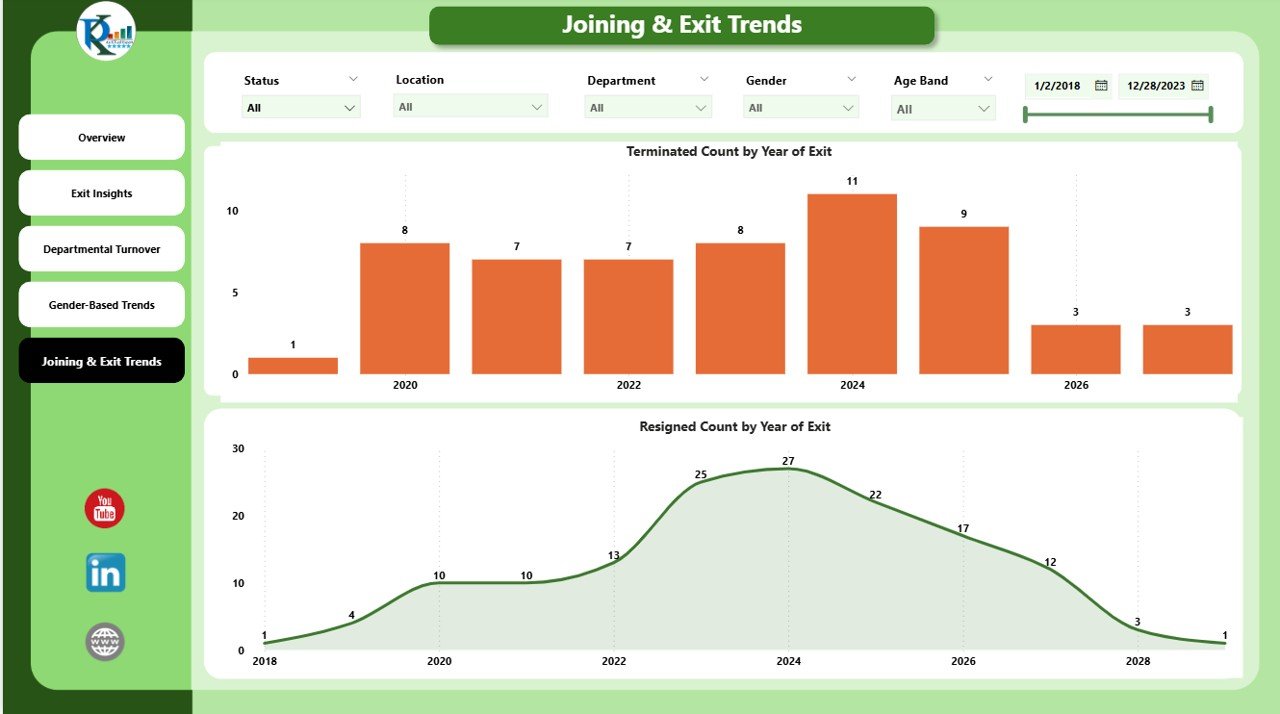
5. Joining & Exit Trends Page
Analyze historical trends for both joining and exiting employees.
Charts Include:
-
Terminated Count by Year of Exit: Track yearly terminations.
-
Resigned Count by Year of Exit: Monitor yearly resignations to spot trends.
Click to Buy Employee Turnover Dashboard in Power BI
Advantages of Using This Dashboard
-
Gain real-time insights into employee turnover patterns.
-
Identify departments or demographic groups with high attrition.
-
Support data-driven HR decision-making and retention strategies.
-
Visualize turnover trends with interactive Power BI visuals.
-
Quickly compare voluntary vs involuntary exits.
Opportunities for Improvement
Click to Buy Employee Turnover Dashboard in Power BI
-
Integrate with HRIS systems for automated data updates.
-
Add predictive analytics to forecast future turnover.
-
Include exit interview sentiment analysis for deeper insights.
Best Practices
-
Regularly update employee data to ensure dashboard accuracy.
-
Use departmental and demographic insights to design retention programs.
-
Monitor historical trends to identify patterns and prevent future turnover.
Conclusion
The Employee Turnover Dashboard in Power BI is a comprehensive tool for tracking and analyzing workforce attrition. By leveraging this dashboard, organizations can make informed HR decisions, reduce employee turnover, and maintain a productive and stable workforce.
Visit our YouTube channel to learn step-by-step video tutorials
Click to Buy Employee Turnover Dashboard in Power BI