In today’s rapidly evolving financial technology (Fintech) landscape, data plays a critical role in driving business growth and operational excellence. Every transaction, customer interaction, and investment decision generates valuable information. But without a structured system to monitor and analyze this data, it’s easy to miss opportunities for optimization and growth.
That’s where the Fintech KPI Dashboard in Excel comes in — a ready-to-use, interactive, and highly visual tool designed to help Fintech companies track performance across various financial and operational metrics. Built entirely in Microsoft Excel, this dashboard empowers finance professionals, analysts, and decision-makers to visualize data, track targets, and make informed business decisions with ease.
In this article, we’ll explore what a Fintech KPI Dashboard is, its structure, benefits, and best practices to make the most of it.
Click to buy Fintech KPI Dashboard in Excel
What Is a Fintech KPI Dashboard in Excel?
A Fintech KPI Dashboard is a comprehensive performance monitoring system that consolidates all key performance indicators (KPIs) related to financial technology operations into one central platform.
Instead of working with scattered spreadsheets or complex software, users can now manage all vital financial and operational KPIs in a single Excel workbook. The dashboard provides a clear, real-time picture of performance through dynamic charts, KPI cards, and automated metrics — giving decision-makers the insights they need to act quickly.
It focuses on metrics such as transaction volume, customer acquisition cost, churn rate, profitability ratios, fraud rate, compliance adherence, and system uptime — all crucial for Fintech organizations that operate in a fast-paced, data-driven environment.
Why Excel for a Fintech KPI Dashboard?
While there are several BI tools in the market, Excel remains a go-to platform for financial professionals because of its flexibility, accessibility, and automation potential.
Here are some reasons why Excel works perfectly for a Fintech KPI Dashboard:
- Ease of Use: No special software installation or training required.
- Data Integration: Excel easily connects with financial data sources, APIs, and accounting systems.
- Customizability: Users can adapt formulas, charts, and visuals based on their organization’s KPIs.
- Automation: Using VBA or formulas, reports can refresh automatically each month.
- Affordability: It offers advanced functionality without expensive licenses.
This makes Excel an ideal environment to build a dynamic Fintech dashboard that is both scalable and cost-effective.
Structure of the Fintech KPI Dashboard in Excel
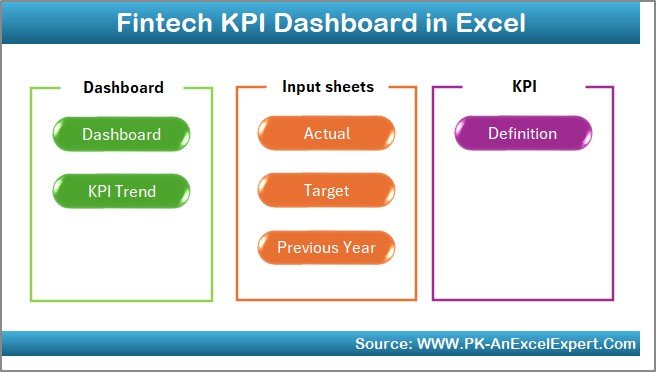
The Fintech KPI Dashboard template includes seven well-structured worksheets, each designed to simplify performance tracking and decision-making.
Let’s look at each sheet in detail:
Summary Page
The Summary Page acts as the index sheet of the dashboard.
It includes six buttons that allow users to navigate directly to other key sheets in the workbook — such as Dashboard, Trend, Actuals, Target, Previous Year, and KPI Definition.
This page serves as the control hub where users can select what they want to view or update, making navigation intuitive and professional.
Click to buy Fintech KPI Dashboard in Excel
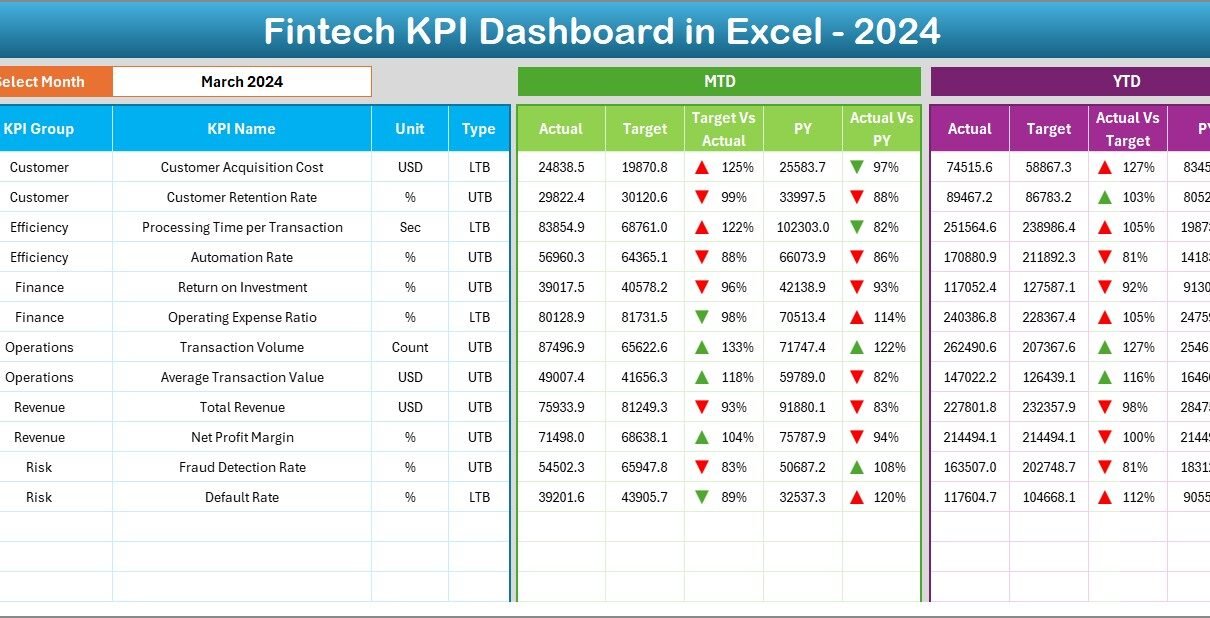
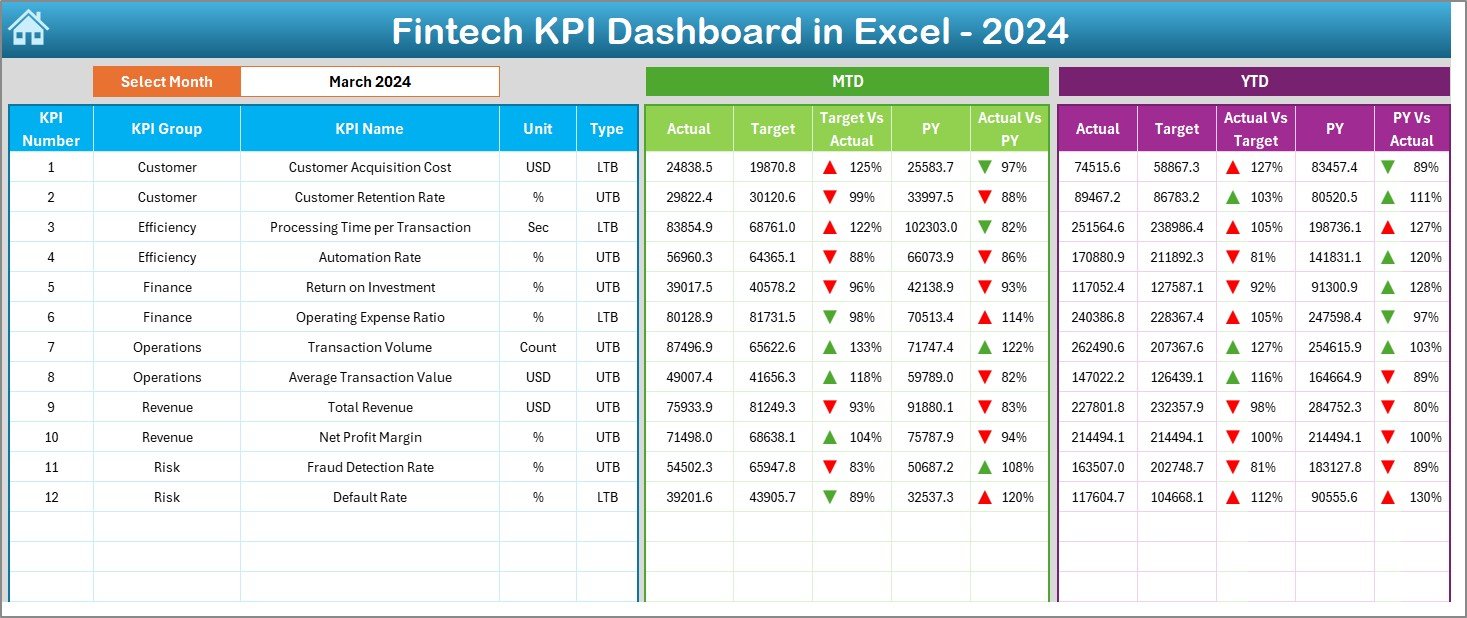
Dashboard Sheet Tab
The Dashboard is the main visual interface of the entire workbook.
It consolidates all critical KPIs into one page, offering instant insights for decision-makers.
- Dynamic Month Selection: A dropdown in cell D3 allows you to choose a specific month. Once selected, all charts and KPI numbers automatically update to reflect that month’s performance.
- MTD & YTD View: The dashboard displays both Month-to-Date (MTD) and Year-to-Date (YTD) metrics for Actual, Target, and Previous Year (PY).
- Visual Indicators: Conditional formatting with up/down arrows highlights performance against targets — green for improvement and red for decline.
- KPI Comparison: The dashboard compares current results with both targets and previous year values for a clear picture of progress.
This tab is designed to make analysis simple, visual, and actionable for busy executives and analysts.
Click to buy Fintech KPI Dashboard in Excel
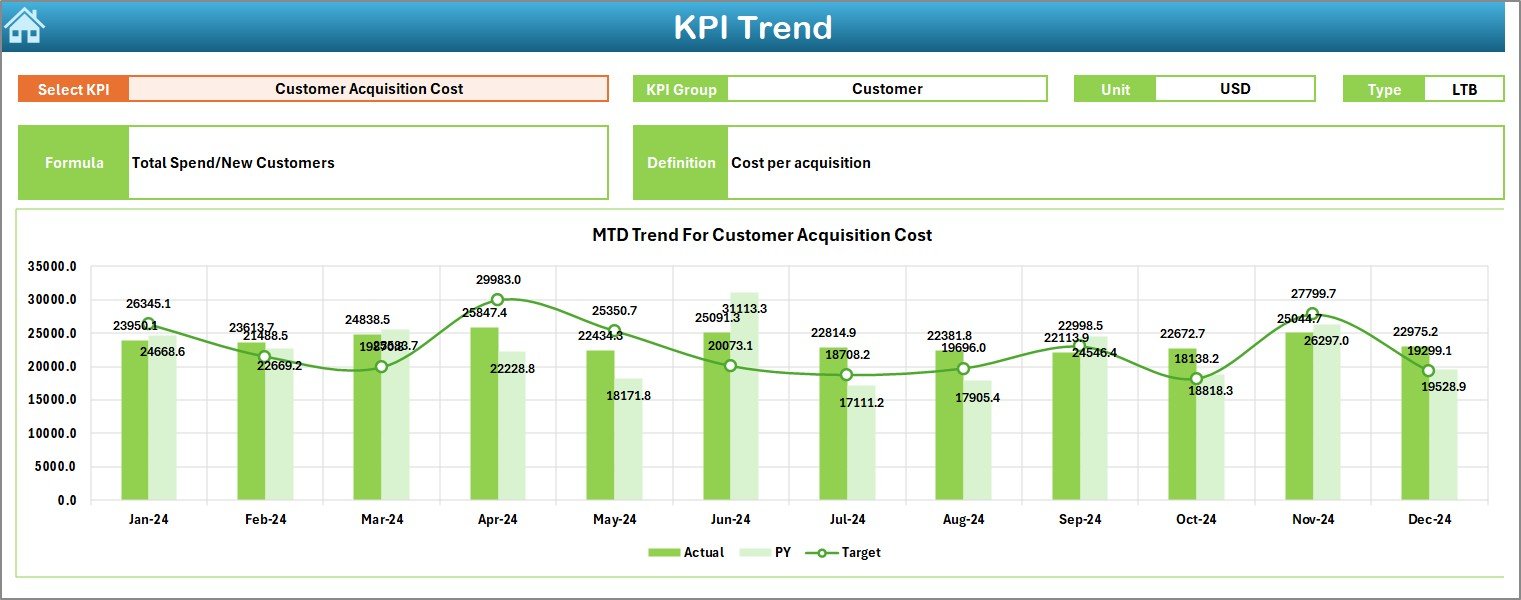
Trend Sheet Tab
The Trend Sheet adds depth to the analysis by displaying KPI performance over time.
- A dropdown in cell C3 allows users to select a KPI name.
- The sheet automatically shows KPI details such as:
- KPI Group
- Unit
- Type (UTB or LTB)
- Formula
- Definition
It also includes interactive MTD and YTD trend charts that visualize performance across months for Actual, Target, and PY values.
This sheet helps in identifying long-term trends, seasonal variations, and growth patterns for each KPI.
Click to buy Fintech KPI Dashboard in Excel
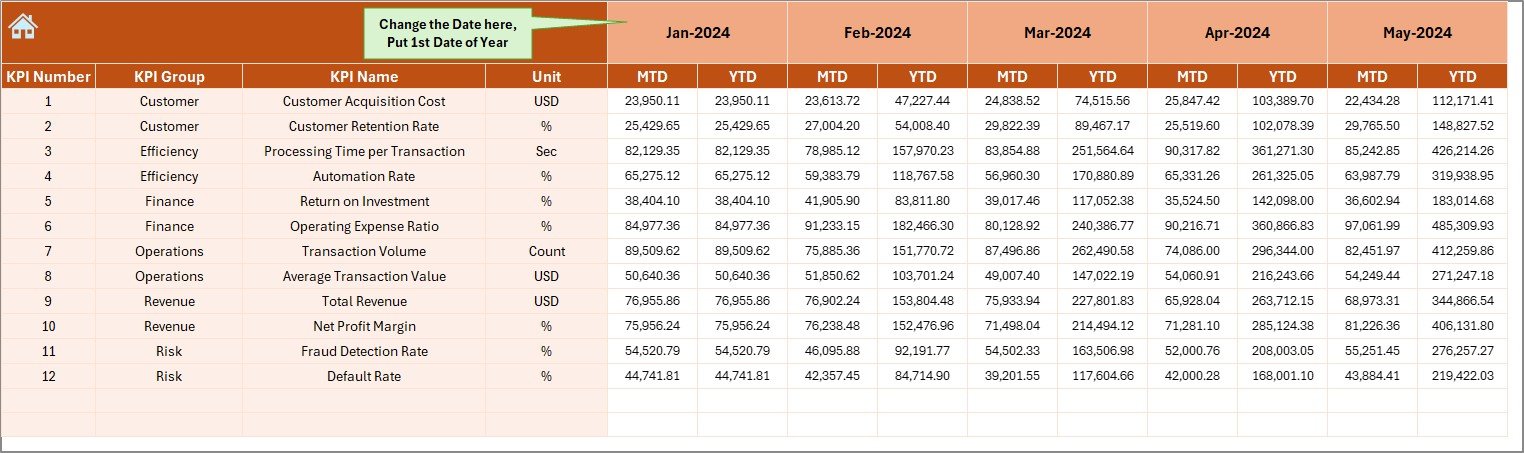
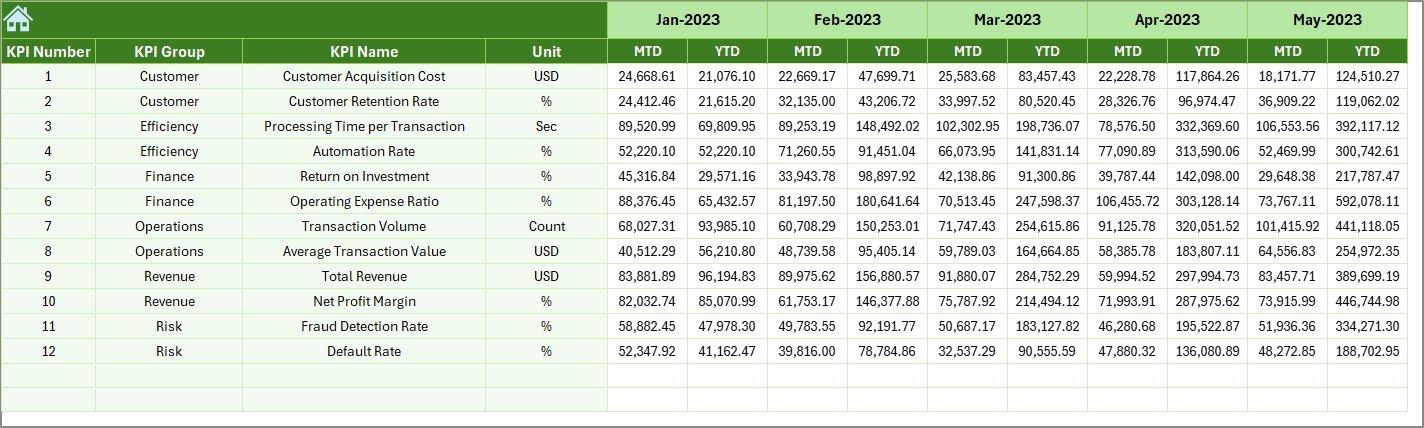
Actual Numbers Input Sheet
The Actual Numbers Input Sheet is the data entry section for recording real performance values.
- Users enter MTD and YTD actuals for each KPI.
- The month can be adjusted in cell E1 — just enter the first month of the fiscal year, and the formulas adjust automatically.
- Once data is entered, all connected charts and summaries refresh instantly.
This sheet ensures that the dashboard always reflects the most recent and accurate data.
Click to buy Fintech KPI Dashboard in Excel
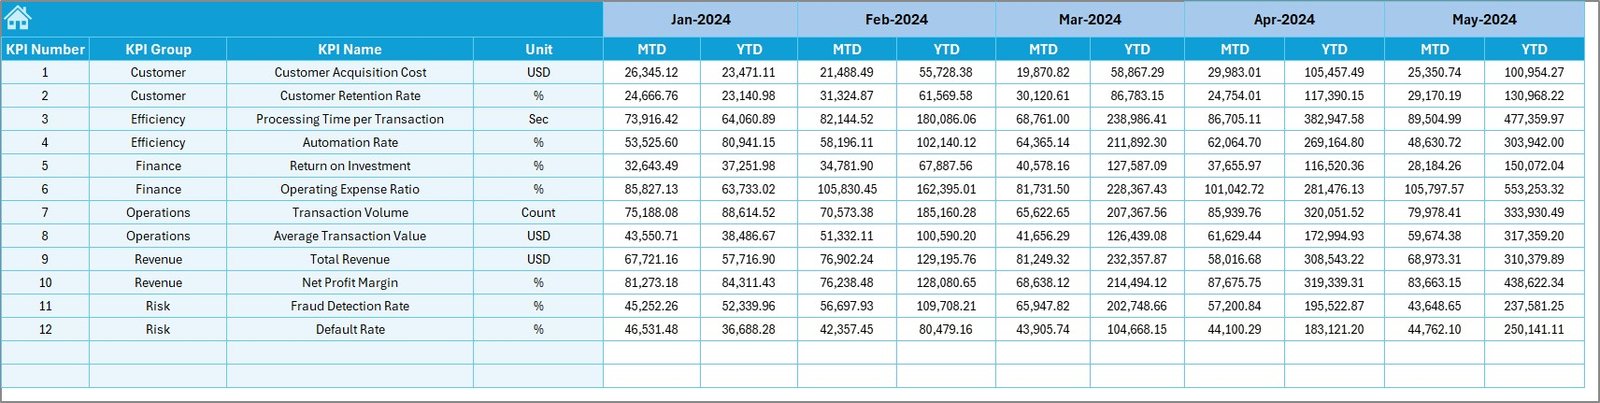
Target Sheet Tab
Targets are the benchmarks against which performance is evaluated.
In the Target Sheet, users input MTD and YTD target numbers for each KPI and month.
These targets drive the comparisons and conditional formatting on the Dashboard and Trend tabs.
Accurate target setting helps organizations align departmental performance with strategic goals and investor expectations.
Previous Year Numbers Sheet
Historical context is vital for performance analysis.
The Previous Year Numbers Sheet stores MTD and YTD figures for the prior year, allowing users to benchmark current performance.
Comparing current results against last year’s data helps reveal growth rates, areas of improvement, and declining metrics that require attention.
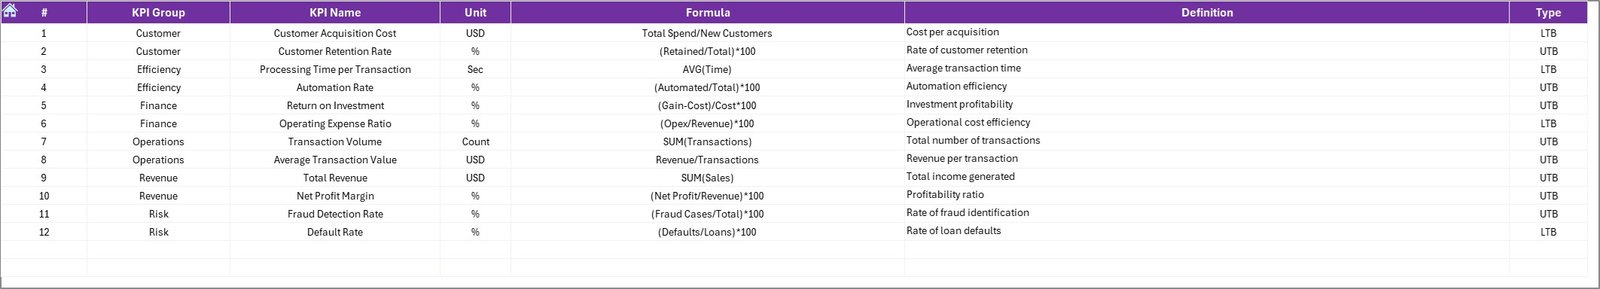
KPI Definition Sheet Tab
This sheet serves as the reference library for all KPIs.
Each KPI entry includes details such as:
- KPI Name
- KPI Group
- Unit
- Formula
- Definition
- Type (UTB or LTB)
Having all definitions in one place ensures standardization across departments and prevents confusion regarding KPI meaning or calculation.
Key Metrics to Track in a Fintech KPI Dashboard
A well-designed Fintech dashboard typically includes a mix of financial, operational, and customer-centric KPIs.
Here are some of the most important ones:
Financial Performance KPIs
- Revenue Growth Rate – Measures how quickly your revenue is increasing month-over-month or year-over-year.
- Profit Margin (%) – Tracks net profitability after all expenses.
- Cost per Transaction – Evaluates operational efficiency.
- Operating Expenses Ratio – Ensures spending aligns with revenue goals.
Customer Metrics
- Customer Acquisition Cost (CAC) – Total marketing and sales spend per new customer acquired.
- Customer Lifetime Value (CLV) – Total projected revenue per customer.
- Churn Rate (%) – Tracks how many customers stop using your platform.
- Net Promoter Score (NPS) – Measures customer satisfaction and loyalty.
Risk and Compliance KPIs
- Fraud Detection Rate – Percentage of fraudulent transactions detected.
- Compliance Adherence (%) – Monitors regulatory and legal compliance.
- Error Rate in Transactions – Ensures operational reliability.
Operational Efficiency KPIs
- Average Transaction Time – Time taken to complete a financial transaction.
- System Uptime (%) – Tracks IT system reliability and performance.
- Ticket Resolution Time – Measures how quickly customer issues are resolved.
Advantages of a Fintech KPI Dashboard in Excel
Building your Fintech dashboard in Excel offers numerous benefits beyond basic reporting. Let’s look at the major advantages:
- Centralized Data Management
All KPIs and performance indicators are available in one location. This ensures consistency, eliminates duplication, and enhances collaboration.
Real-Time Performance Insights
With automatic calculations and interactive charts, managers get instant visibility into financial performance, enabling faster decisions.
Cost-Effective Solution
Excel eliminates the need for expensive BI software or external consultants while still offering professional-grade visualization capabilities.
Customizable and Scalable
You can easily modify KPI groups, add new charts, or expand data columns without redesigning the whole system.
Visual and Interactive Analytics
The dashboard uses conditional formatting, arrows, and color coding for quick interpretation of success or risk areas.
Transparency and Accountability
Clearly defined KPIs ensure every department or team member understands performance expectations and results.
Best Practices for Using a Fintech KPI Dashboard in Excel
To get the best results from your dashboard, follow these proven practices:
- Define Clear KPI Objectives
Ensure every KPI aligns with organizational goals. Avoid vanity metrics that don’t directly impact performance or profitability.
- Automate Where Possible
Use Excel formulas, pivot tables, and VBA macros to reduce manual effort and minimize data entry errors.
- Keep the Design Clean
Avoid cluttered visuals. Use consistent colors, headings, and chart styles for better readability and professional presentation.
- Review and Update Data Regularly
Update Actual, Target, and Previous Year data monthly to keep insights accurate and actionable.
- Use Data Validation
Apply dropdown lists, range checks, and error alerts to maintain data integrity across sheets.
- Monitor Trends Over Time
Don’t focus only on a single month’s performance. Analyze trends to identify consistent improvement or potential red flags.
- Protect Key Sheets
Lock formula cells and restrict access to prevent accidental changes to important calculations.
- Communicate Insights
Share the dashboard monthly or quarterly with stakeholders. Use visual summaries and key highlights to present findings effectively.
How the Fintech KPI Dashboard Improves Decision-Making
A well-implemented Fintech KPI Dashboard empowers organizations to make better financial and strategic decisions.
Here’s how:
- Proactive Management: Early identification of performance dips helps teams take corrective actions before they escalate.
- Data-Driven Strategy: Visual analytics replace guesswork with factual insights.
- Performance Alignment: Teams can align their activities with top-level financial objectives.
- Investor Confidence: Transparent reporting strengthens investor trust and funding potential.
- Operational Efficiency: Automation reduces human errors and saves analysis time.
By transforming complex financial data into easy-to-understand visuals, the dashboard bridges the gap between raw data and strategic action.
Conclusion
The Fintech KPI Dashboard in Excel is not just a spreadsheet — it’s a complete performance management system.
It helps Fintech organizations track critical KPIs, monitor trends, and make informed business decisions in real time.
With structured worksheets, interactive visuals, and dynamic automation, this dashboard simplifies complex financial tracking.
Whether you are analyzing profit margins, customer retention, or compliance rates, this Excel-based tool provides everything you need in one place.
If you want to bring clarity, control, and data-driven decision-making to your Fintech operations, this dashboard is the perfect starting point.
Frequently Asked Questions (FAQs)
- What is a Fintech KPI Dashboard used for?
A Fintech KPI Dashboard tracks key performance indicators across financial, operational, and customer-related areas. It helps Fintech organizations monitor progress, detect issues, and make strategic decisions.
- Can beginners use this Excel dashboard easily?
Yes. The dashboard is user-friendly and includes dropdowns, automated charts, and structured input sheets that make it easy even for non-technical users.
- How often should I update the dashboard?
Ideally, you should update it monthly. Regular updates ensure the data remains relevant and trends remain accurate.
- Can I add more KPIs to the dashboard?
Absolutely. The design is scalable — you can easily add new KPIs to the KPI Definition sheet and link them to your data tables.
- Is the dashboard suitable for startups and small Fintech firms?
Yes. It’s perfect for startups, small businesses, and large enterprises because it’s affordable, customizable, and requires no additional software.
- What’s the difference between MTD and YTD in this dashboard?
- MTD (Month-to-Date): Performance metrics for the current month.
- YTD (Year-to-Date): Cumulative performance metrics from the start of the year up to the selected month.
- Does the dashboard support automation?
Yes. You can automate data refresh, report generation, and even chart updates using Excel formulas or VBA macros.
- How does it help in improving compliance and fraud detection?
The dashboard tracks compliance KPIs and fraud rates to ensure all operations meet legal standards and minimize risks.
- Can I visualize customer data like churn rate or acquisition cost?
Yes. The dashboard supports both financial and customer-centric KPIs such as churn rate, CAC, and NPS — giving a full performance overview.
- Where can I download the Fintech KPI Dashboard in Excel?
You can download the ready-to-use template directly from NextGenTemplates.com and start using it immediately.
Visit our YouTube channel to learn step-by-step video tutorials
Watch the step-by-step video tutorial:
Click to buy Fintech KPI Dashboard in Excel