Managing IT support tickets efficiently is critical for delivering seamless IT services within any organization. With increasing ticket volumes and complex issues, having a well-organized, data-driven approach to track and resolve IT support tickets is essential. In this article, we’ll explore the IT Support Ticket Dashboard in Excel, a ready-to-use tool that provides a comprehensive solution for monitoring IT support operations, resolving issues quickly, and improving customer satisfaction.
What is an IT Support Ticket Dashboard?
An IT Support Ticket Dashboard is a powerful tool used to track and manage the resolution of support tickets. It helps IT teams stay organized, measure performance, and identify areas for improvement by tracking metrics like ticket status, resolution times, and satisfaction scores. The IT Support Ticket Dashboard in Excel is a customizable, easy-to-use template that provides real-time insights into support ticket operations, helping teams improve efficiency and performance.
Key Features of the IT Support Ticket Dashboard in Excel
Click to buy IT Support Ticket Dashboard in Excel
The IT Support Ticket Dashboard in Excel consists of several interactive sheets that allow IT teams to analyze and manage ticket-related data. Below are the key features of each sheet:
1. Overview Sheet Tab
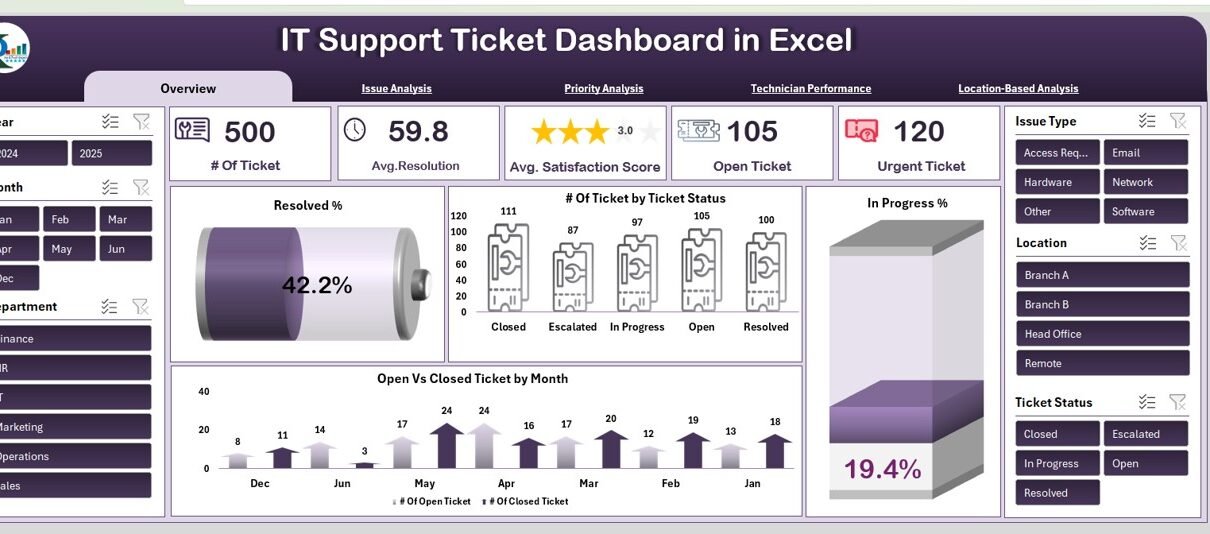
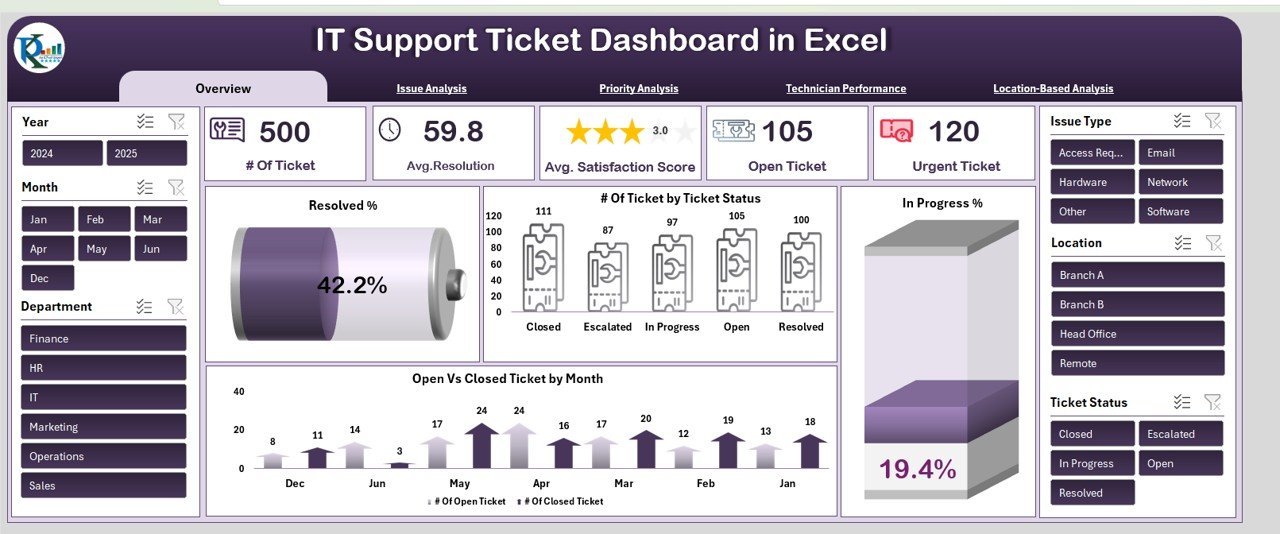
The Overview sheet provides a snapshot of your IT support operations, showcasing critical metrics through various charts, slicers, and cards. This sheet includes:
Cards:
- # of Tickets: Displays the total number of support tickets received.
- Avg. Resolution Time (Hours): Shows the average time it takes to resolve tickets.
- Avg. Satisfaction Score: Displays the average customer satisfaction score for closed tickets.
- Open Tickets: Displays the total number of open, unresolved tickets.
- Urgent Tickets: Displays the number of tickets marked as urgent.
Charts:
- Resolved %: Shows the percentage of tickets that have been resolved.
- # of Tickets by Ticket Status: Breaks down the number of tickets by their current status (e.g., Open, In Progress, Resolved).
- In Progress %: Displays the percentage of tickets that are still being worked on.
- Open vs Closed Tickets by Month: Displays trends of open and closed tickets month-by-month.
Click to buy IT Support Ticket Dashboard in Excel
2. Issue Analysis Sheet Tab
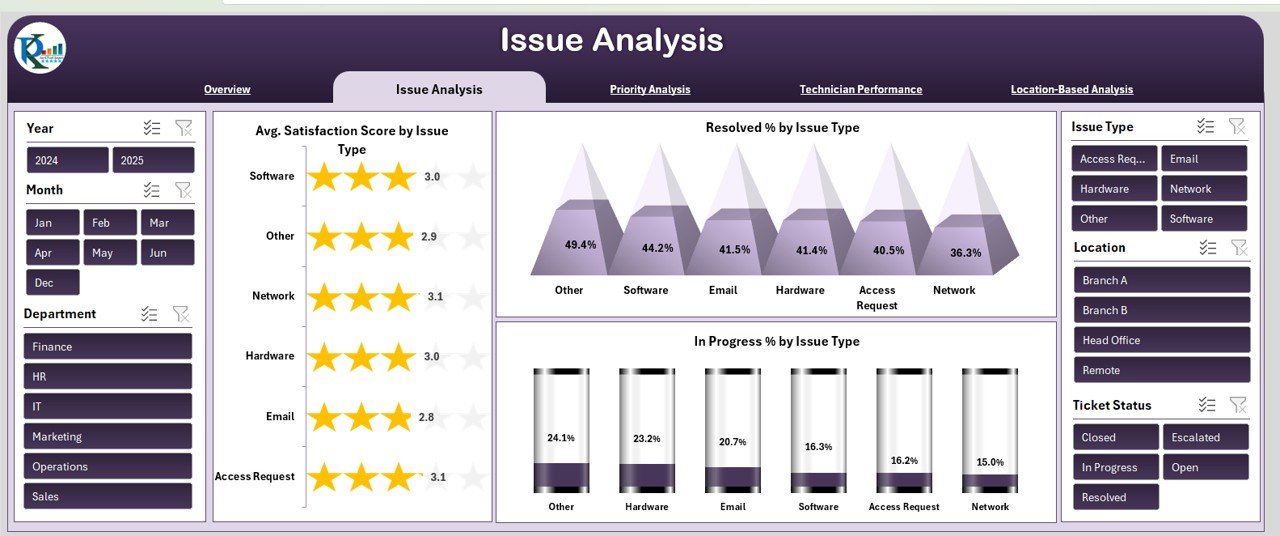
The Issue Analysis sheet allows you to analyze the tickets based on their types, helping identify recurring problems or areas that need attention. The key charts in this sheet are:
-
Avg. Satisfaction Score by Issue Type: Displays satisfaction scores for each type of issue reported.
-
Resolved % by Issue Type: Shows the percentage of tickets resolved for each issue type.
-
In Progress % by Issue Type: Displays the percentage of unresolved tickets for each issue type.
3. Priority Analysis Sheet Tab
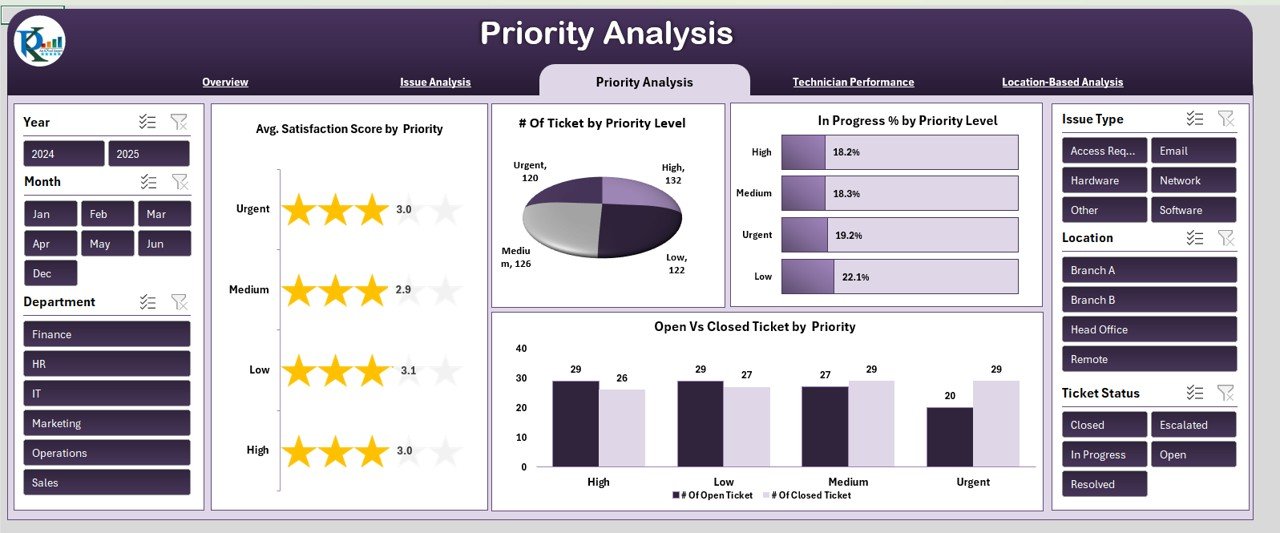
The Priority Analysis sheet provides insights into how tickets of different priority levels are handled. This sheet includes:
-
Avg. Satisfaction Score by Priority: Shows customer satisfaction for tickets based on priority level.
-
# of Tickets by Priority Level: Displays the number of tickets categorized by their priority (e.g., High, Medium, Low).
-
In Progress % by Priority Level: Displays the percentage of tickets still in progress for each priority level.
-
Open vs Closed Tickets by Priority: Shows trends of open and closed tickets based on priority.
Click to buy IT Support Ticket Dashboard in Excel
4. Technician Performance Sheet Tab
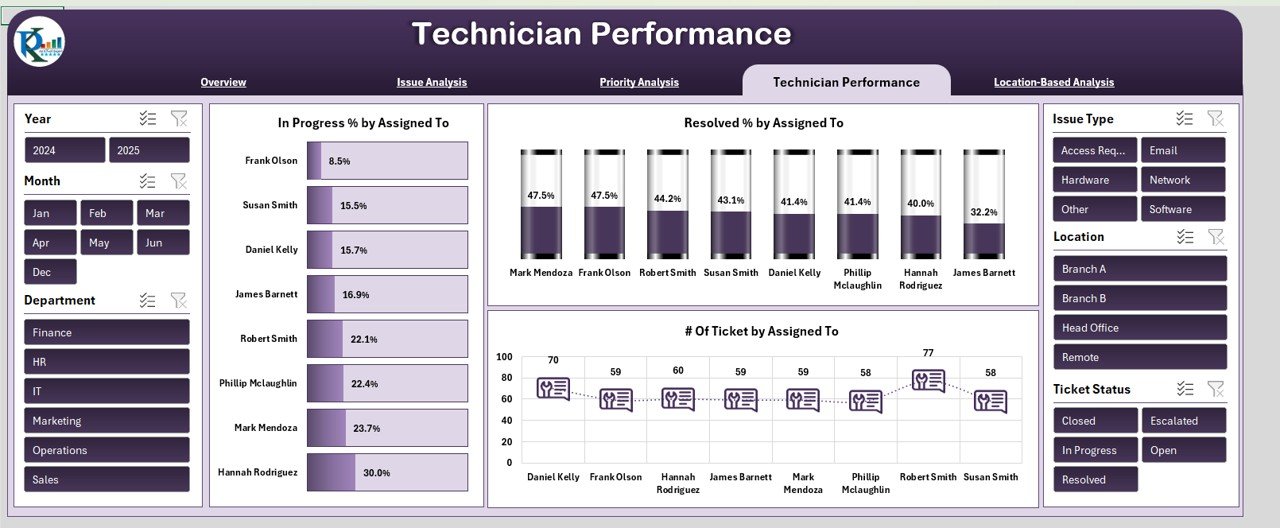
The Technician Performance sheet tracks how individual technicians are performing. It includes:
-
In Progress % by Assigned To: Displays the percentage of unresolved tickets assigned to each technician.
-
Resolved % by Assigned To: Shows the percentage of tickets resolved by each technician.
-
# of Tickets by Assigned To: Displays the total number of tickets assigned to each technician.
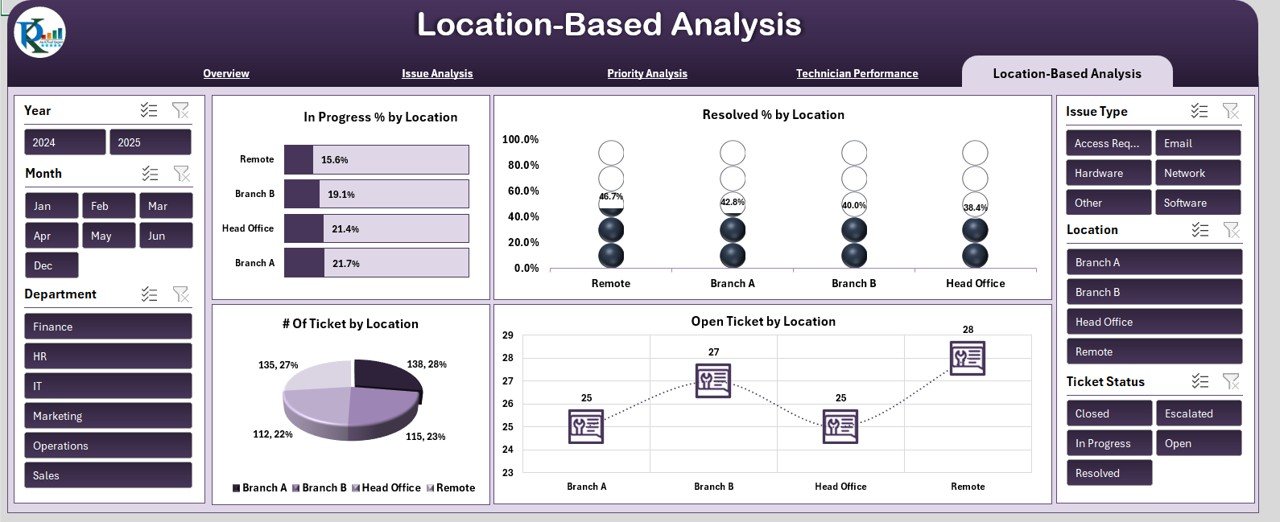
5. Location-Based Analysis Sheet Tab
The Location-Based Analysis sheet provides a breakdown of ticket performance by location. The charts in this sheet include:
-
In Progress % by Location: Displays the percentage of tickets still in progress for each location.
-
Resolved % by Location: Shows the percentage of tickets resolved by location.
-
Open Tickets by Location: Displays the number of open tickets for each location.
-
# of Tickets by Location: Tracks the total number of tickets from each location.
Click to buy IT Support Ticket Dashboard in Excel
6. Data Sheet Tab
The Data Sheet is where raw ticket data is entered. This sheet acts as the input source for all charts and calculations in the dashboard. As new tickets are created, their details (such as ticket status, priority, technician assignment, resolution time, etc.) are entered in this tab, and the entire dashboard will automatically update based on the entered data.
How the IT Support Ticket Dashboard Helps Improve Support Operations
The IT Support Ticket Dashboard in Excel provides valuable insights into support ticket management, allowing businesses to:
-
Track Ticket Resolution Times: Monitor how long it takes to resolve tickets and identify opportunities to improve response times.
-
Monitor Customer Satisfaction: Track customer satisfaction scores and identify trends or areas where service can be improved.
-
Improve Technician Performance: Analyze how well support technicians are performing based on ticket resolution rates and satisfaction scores.
-
Identify Recurring Issues: Use the Issue Analysis tab to spot frequent problems and focus on addressing them to reduce future ticket volume.
-
Optimize Resource Allocation: Use the Priority and Location-based analysis to ensure that tickets are being handled appropriately according to their priority and geographic location.
Advantages of Using the IT Support Ticket Dashboard in Excel
Click to buy IT Support Ticket Dashboard in Excel
The IT Support Ticket Dashboard in Excel offers several advantages for IT teams, support managers, and organizations as a whole:
-
Real-Time Data Monitoring: As soon as new ticket data is entered, the dashboard automatically updates, ensuring that the team always has access to the most up-to-date information.
-
Comprehensive Insights: With multiple tabs that analyze data by ticket status, issue type, priority, technician, and location, this dashboard provides a holistic view of your IT support operations.
-
Customizable and Flexible: You can modify the dashboard to suit your specific needs, add new charts, or adjust data inputs as needed.
-
Easy to Use: Designed with an intuitive layout, the dashboard is simple to set up and use, even for non-technical users.
-
Improved Decision Making: By visualizing key metrics like satisfaction scores and resolution times, support teams can make informed decisions to improve their service quality.
Best Practices for Using the IT Support Ticket Dashboard
To get the most out of your IT Support Ticket Dashboard, follow these best practices:
-
Regular Data Entry: Ensure that ticket data is entered promptly and accurately to maintain the integrity of your dashboard.
-
Consistent Monitoring: Review the dashboard regularly to identify trends and take action to resolve any bottlenecks.
-
Set Goals: Use the data to set performance targets, such as reducing resolution times or increasing customer satisfaction.
-
Focus on Technician Performance: Use the Technician Performance sheet to identify top performers and areas where additional training may be needed.
-
Identify Recurring Issues: Use the Issue Analysis sheet to identify common problems and work on long-term solutions to reduce ticket volumes.
Conclusion
Click to buy IT Support Ticket Dashboard in Excel
The IT Support Ticket Dashboard in Excel is an invaluable tool for managing IT support operations. With its comprehensive metrics, customizable charts, and real-time updates, this dashboard enables IT teams to track performance, improve efficiency, and enhance customer satisfaction. By using this dashboard, support managers can ensure a more streamlined, effective support process, ultimately leading to faster resolution times and happier customers.
Frequently Asked Questions (FAQs)
1. How do I enter ticket data into the IT Support Ticket Dashboard?
You can enter ticket data directly into the Data Sheet tab, including details such as ticket status, priority, assigned technician, and resolution time. The dashboard will automatically update based on this data.
2. Can I customize the IT Support Ticket Dashboard?
Yes, the dashboard is fully customizable. You can modify the charts, add new metrics, and adjust the layout to fit your specific IT support needs.
3. How does the Technician Performance tab help improve support?
The Technician Performance tab tracks how well each technician is performing based on metrics like ticket resolution rate and customer satisfaction, helping identify areas for improvement and training.
4. What are the key metrics in the IT Support Ticket Dashboard?
Key metrics include ticket status, resolution time, customer satisfaction score, number of open/closed tickets, and performance by issue type, priority, technician, and location.
5. Can the IT Support Ticket Dashboard help with workload distribution?
Yes, by analyzing metrics like In Progress % and # of Tickets by Technician, you can identify which technicians have a heavy workload and redistribute tickets as needed.
Visit our YouTube channel to learn step-by-step video tutorials
Click to buy IT Support Ticket Dashboard in Excel