In today’s fast-evolving healthcare landscape, IVF (In Vitro Fertilization) centers handle large volumes of sensitive and complex data every day. From patient cycles and treatment success rates to lab performance and financial metrics, managing everything manually becomes overwhelming. As a result, decision-making slows down, and operational efficiency decreases.
So, how can IVF clinics track performance, improve success rates, and manage KPIs—all in one place?
IVF Centers KPI Dashboard in Power BI.
This powerful and ready-to-use dashboard helps fertility clinics, lab managers, and healthcare analysts monitor key performance indicators (KPIs) in real time. Moreover, it converts raw IVF data into meaningful insights using interactive visuals, charts, and filters.
In this detailed SEO-friendly guide, you will learn everything about this dashboard, including its features, structure, advantages, best practices, and frequently asked questions.
What is an IVF Centers KPI Dashboard in Power BI?
An IVF Centers KPI Dashboard in Power BI is an advanced analytics tool designed to track, measure, and visualize performance metrics related to fertility treatments and clinic operations.
Instead of using multiple reports, this dashboard allows you to:
- 📈 Monitor IVF treatment KPIs in real time
- 🎯 Compare actual vs target performance
- 📊 Analyze monthly and yearly trends
- 🧪 Track lab and clinical efficiency
- ⚖️ Improve compliance and patient outcomes
Therefore, clinics can make faster, data-driven decisions with complete confidence.
Why Do IVF Centers Need a KPI Dashboard?
IVF clinics deal with critical patient data and treatment processes. Therefore, accurate tracking becomes essential.
Here’s why this dashboard is important:
- ✔️ It centralizes all KPI data in one place
- ✔️ It improves decision-making speed
- ✔️ It reduces manual reporting errors
- ✔️ It enhances transparency and accountability
- ✔️ It supports performance optimization
In short, this dashboard simplifies complex IVF data into actionable insights.
Key Features of IVF Centers KPI Dashboard in Power BI
Click to Buy IVF Centers KPI Dashboard in Power BI
This dashboard includes 3 powerful pages, each designed to deliver specific insights.
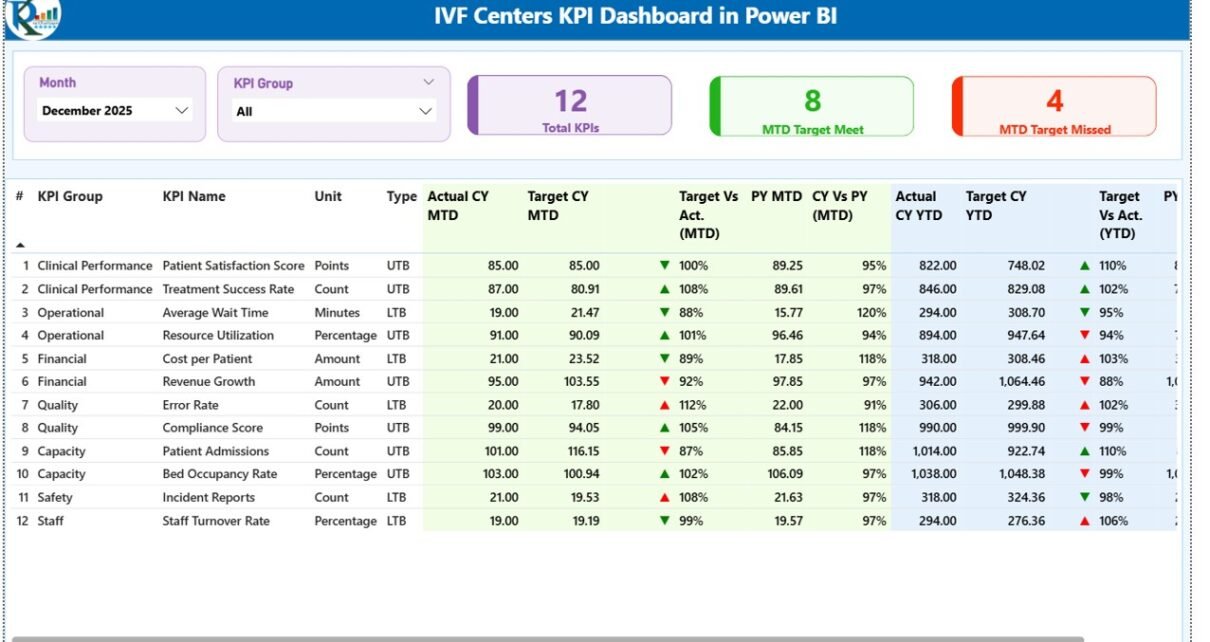
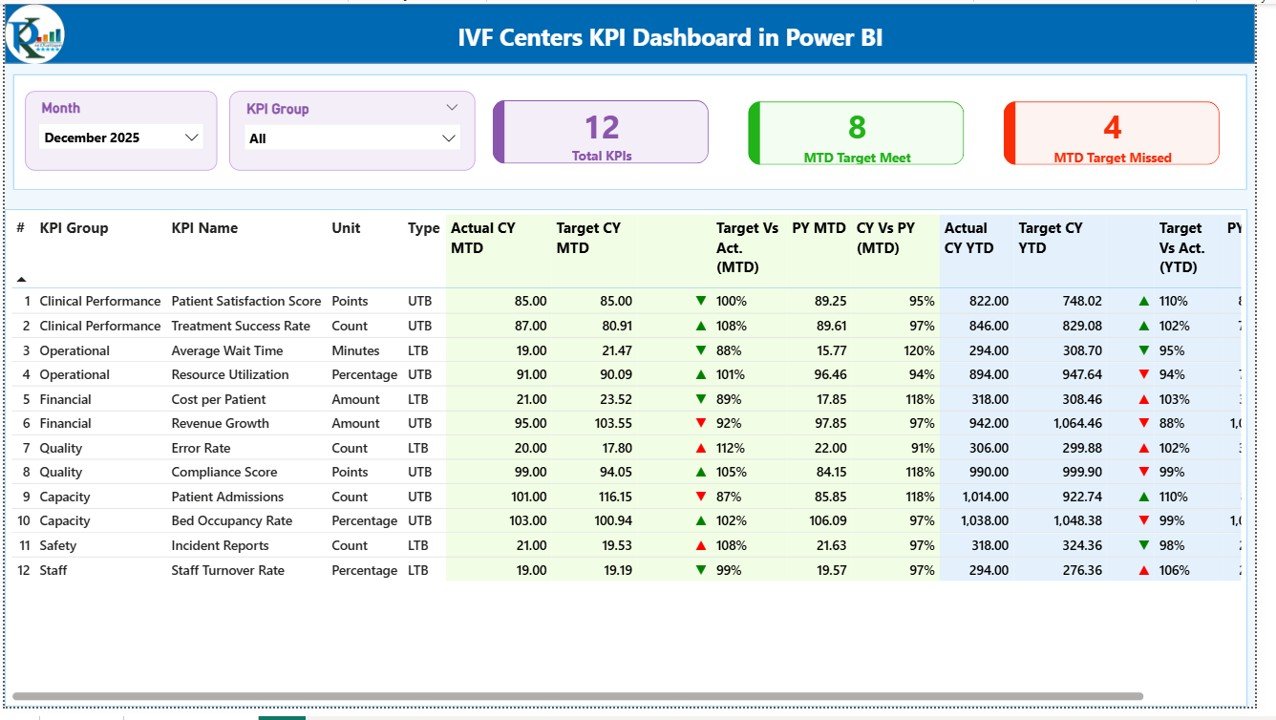
1. Summary Page – Complete KPI Overview
The Summary Page acts as the main control panel of the dashboard. It provides a quick and comprehensive snapshot of all KPIs.
🔑 Key Highlights:
- 🎛️ Slicers (Filters):
- Month slicer
- KPI Group slicer
- 📊 3 KPI Cards:
- Total KPIs Count
- MTD Target Meet Count
- MTD Target Missed Count
- 📋 Detailed KPI Table Includes:
- 🔢 KPI Number
- 📂 KPI Group
- 🏷️ KPI Name
- 📏 Unit
- 🔄 Type (LTB – Lower the Better / UTB – Upper the Better)
- 📈 Actual CY MTD
- 🎯 Target CY MTD
- 🔺🔻 MTD Icon (Performance Indicator)
- 📊 Target vs Actual (MTD %)
- 📅 Previous Year MTD (PY MTD)
- 🔍 CY vs PY (MTD %)
- 📈 Actual CY YTD
- 🎯 Target CY YTD
- 🔺🔻 YTD Icon (Performance Indicator)
- 📊 Target vs Actual (YTD %)
- 📅 Previous Year YTD (PY YTD)
- 🔍 CY vs PY (YTD %)
Click to Buy IVF Centers KPI Dashboard in Power BI
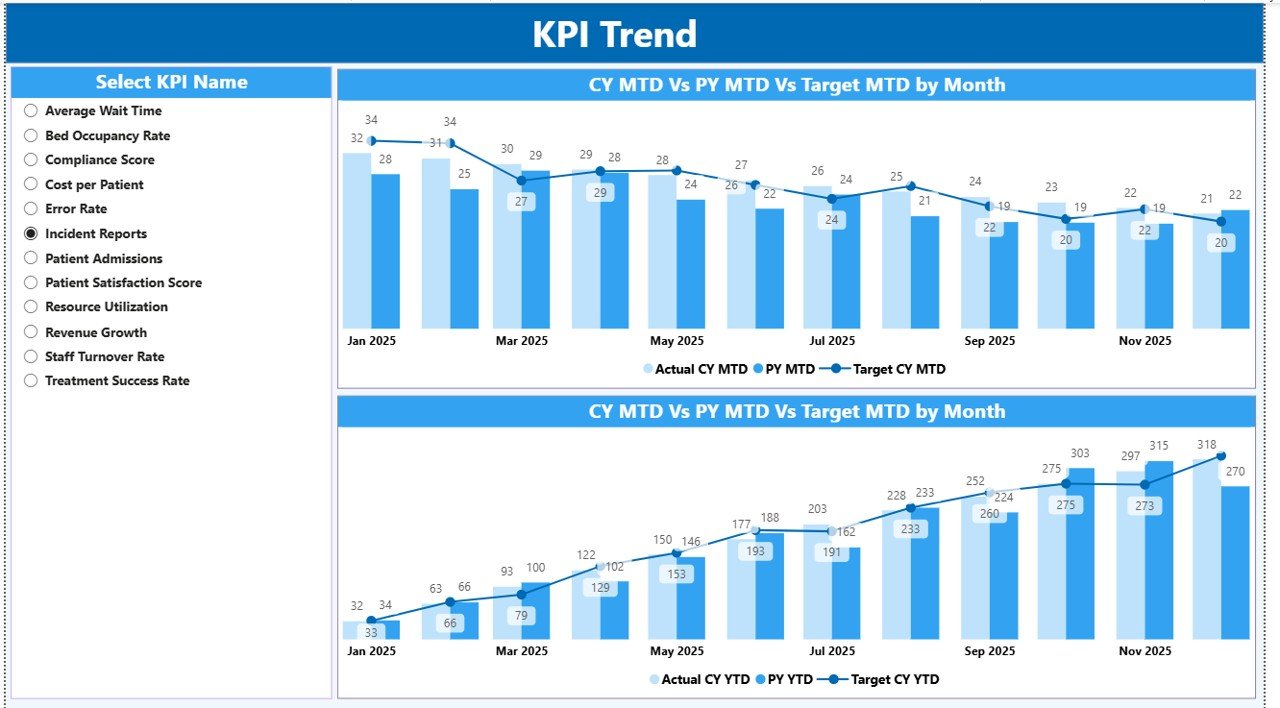
2. KPI Trend Page – Track Performance Trends
The KPI Trend Page helps you analyze KPI performance over time.
📊 Key Features:
- 📉 2 Combo Charts:
- Actual vs Target vs Previous Year (MTD)
- Actual vs Target vs Previous Year (YTD)
- 🎛️ KPI Name Slicer:
- Select specific KPIs for detailed analysis
💡 Insights You Can Gain:
- Identify growth or decline in performance
- Compare current year vs previous year
- Analyze trends to improve planning
Click to Buy IVF Centers KPI Dashboard in Power BI
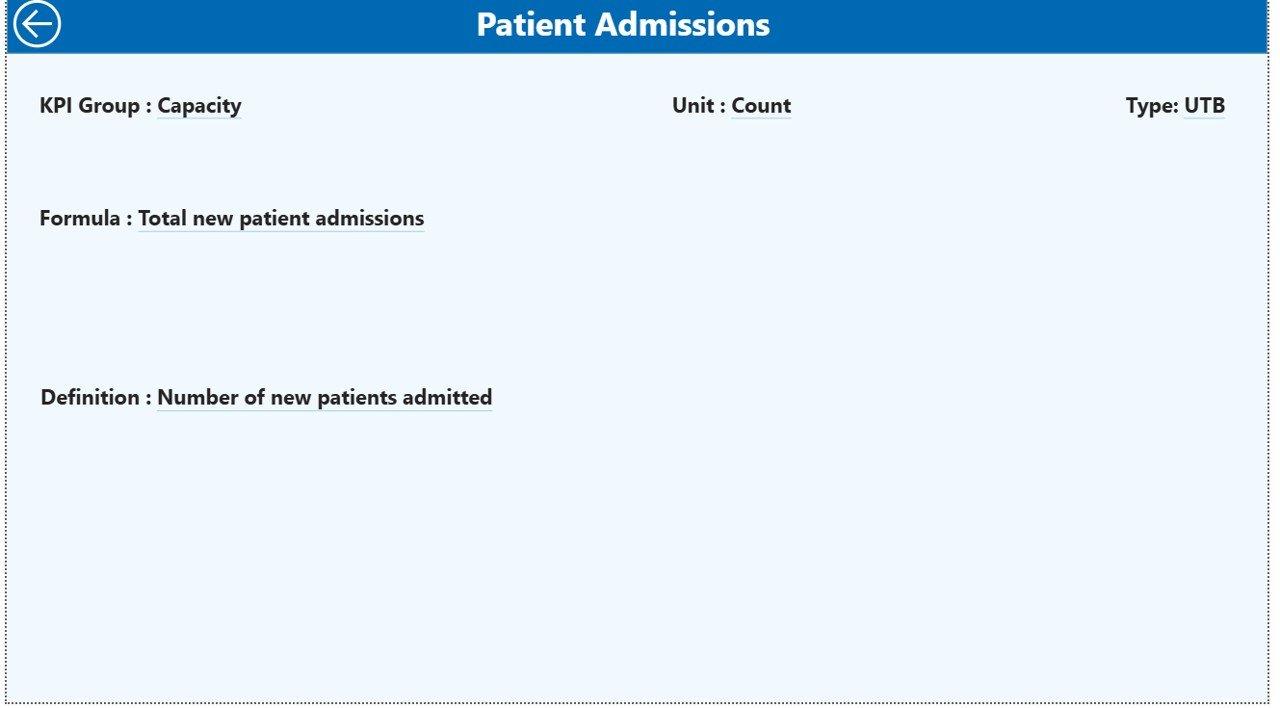
3. KPI Definition Page – Understand KPI Logic
The KPI Definition Page is a drill-through page designed for detailed KPI understanding.
📋 Includes:
- 📌 KPI Number
- 📂 KPI Group
- 🏷️ KPI Name
- 📏 Unit
- 🧮 Formula
- 📖 Definition
- 🔄 Type (LTB or UTB)
💡 Why It’s Important:
Because it ensures clarity, users can understand how each KPI is calculated and interpreted.
Click to Buy IVF Centers KPI Dashboard in Power BI
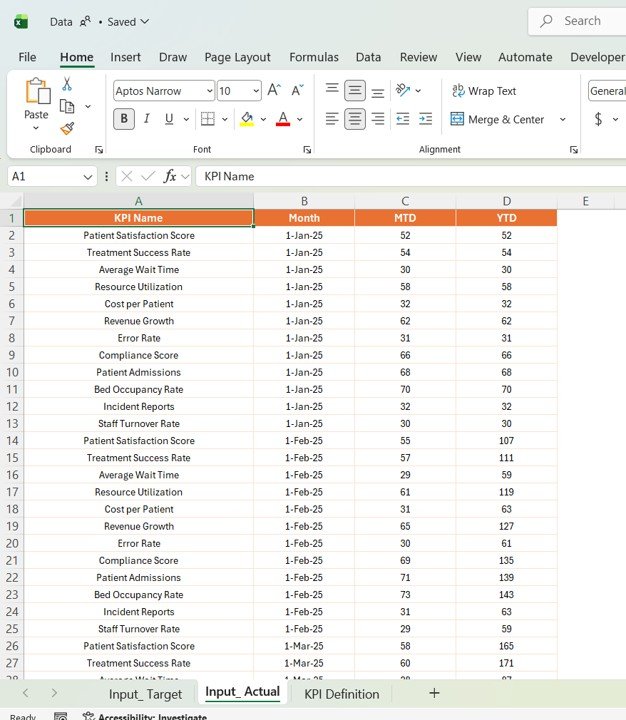
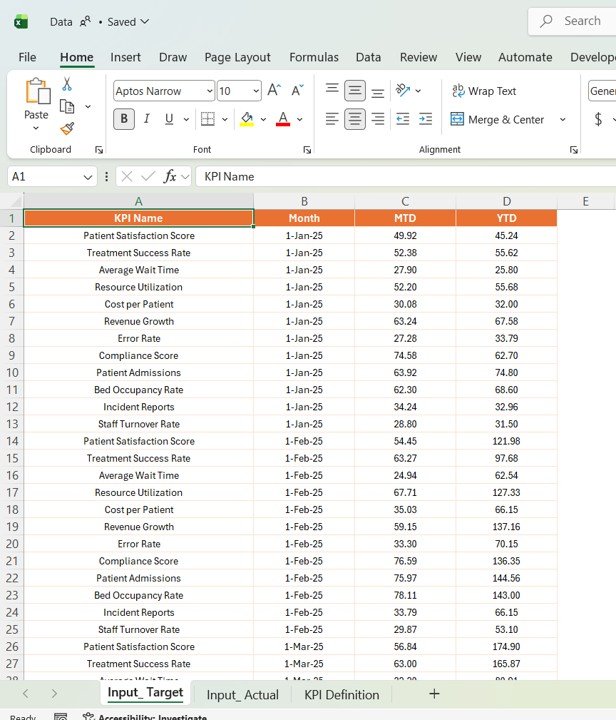
Excel Data Source Structure
This dashboard uses an Excel file as its data source. Therefore, data management becomes simple and flexible.
📊 1. Input_Actual Sheet
- Enter KPI Name
- Add Month (First date of month)
- Fill MTD values
- Fill YTD values
Click to Buy IVF Centers KPI Dashboard in Power BI
🎯 2. Input_Target Sheet
- Enter KPI Name
- Add Month
- Fill Target MTD values
- Fill Target YTD values
Click to Buy IVF Centers KPI Dashboard in Power BI
📘 3. KPI Definition Sheet
- KPI Number
- KPI Group
- KPI Name
- Unit
- Formula
- Definition
- Type (LTB/UTB)

Click to Buy IVF Centers KPI Dashboard in Power BI
Advantages of IVF Centers KPI Dashboard in Power BI
USing this dashboard provides several benefits:
1. Real-Time KPI Monitoring
You can track IVF performance instantly. Therefore, you stay updated at all times.
2. Improved Decision-Making
Clear visuals help you make faster and more accurate decisions.
3. Better Patient Outcome Tracking
You can monitor treatment success rates effectively.
4. Enhanced Operational Efficiency
You can identify bottlenecks and improve workflows.
5. Reduced Manual Errors
Automation ensures accuracy in reporting.
6. Easy Data Visualization
Interactive charts make complex data easy to understand.
Opportunities for Improvement
Click to Buy IVF Centers KPI Dashboard in Power BI
Although this dashboard is powerful, you can enhance it further:
- 🤖 Add AI-based success rate predictions
- 🔔 Implement automated alerts for KPI deviations
- 📱 Optimize for mobile access
- 🌐 Integrate with hospital management systems
- 🔐 Strengthen data privacy and security features
Best Practices for the IVF Centers KPI Dashboard in Power BI
Click to Buy IVF Centers KPI Dashboard in Power BI
To get the best results, follow these best practices:
1. Keep Data Accurate and Updated
Always ensure your data remains clean and current.
2. Define KPIs Clearly
Use clear formulas and definitions for each KPI.
3. Focus on Key Metrics
Track only the most impactful KPIs.
4. Use Visuals Effectively
Avoid clutter and keep charts simple.
5. Monitor Trends Regularly
Analyze trends to improve planning and outcomes.
6. Ensure Data Security
Protect sensitive patient data at all times.
Who Can Benefit from This Dashboard?
This dashboard is ideal for:
- IVF Clinic Managers
- Embryologists and Lab Staff
- Healthcare Analysts
- Hospital Administrators
- Compliance Teams
How Does This Dashboard Improve IVF Clinic Performance?
Click to Buy IVF Centers KPI Dashboard in Power BI
This dashboard improves clinic performance in multiple ways:
- Enhances operational efficiency
- Improves treatment success tracking
- Supports compliance monitoring
- Reduces risks and inefficiencies
- Enables data-driven decision-making
Conclusion
Click to Buy IVF Centers KPI Dashboard in Power BI
The IVF Centers KPI Dashboard in Power BI is a powerful solution for managing and analyzing fertility clinic data. It simplifies complex KPI tracking, improves decision-making, and enhances operational efficiency.
Moreover, with its interactive design, real-time insights, and user-friendly interface, it helps IVF centers deliver better patient outcomes and achieve operational excellence.
If you want to transform your IVF clinic with data-driven insights, this dashboard is the perfect solution.
Visit our YouTube channel to learn step-by-step video tutorials
Click to Buy IVF Centers KPI Dashboard in Power BI