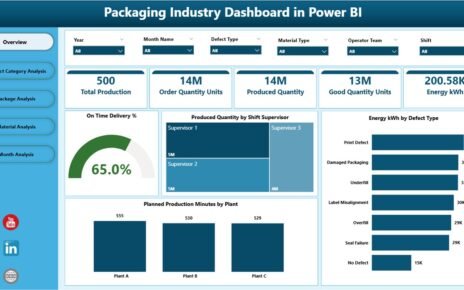
Efficient management of meeting rooms is crucial for organizations to optimize space, improve productivity, and reduce scheduling conflicts. The Meeting Room Utilization Dashboard in Excel is a ready-to-use tool designed to track and analyze meeting room usage across your organization. This dashboard provides insights into booking trends, room efficiency, departmental usage, and time-based patterns, enabling informed decision-making.
Key Features of the Dashboard
This dashboard is organized into multiple sheet tabs for easy navigation and comprehensive analysis. Each tab focuses on a specific aspect of meeting room utilization.
1. Overview Sheet
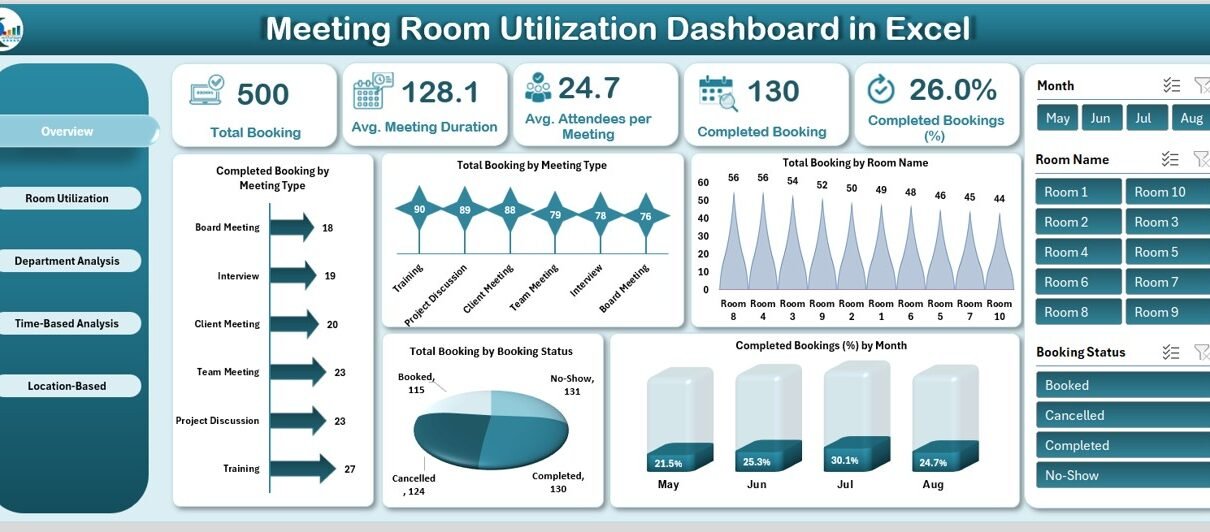
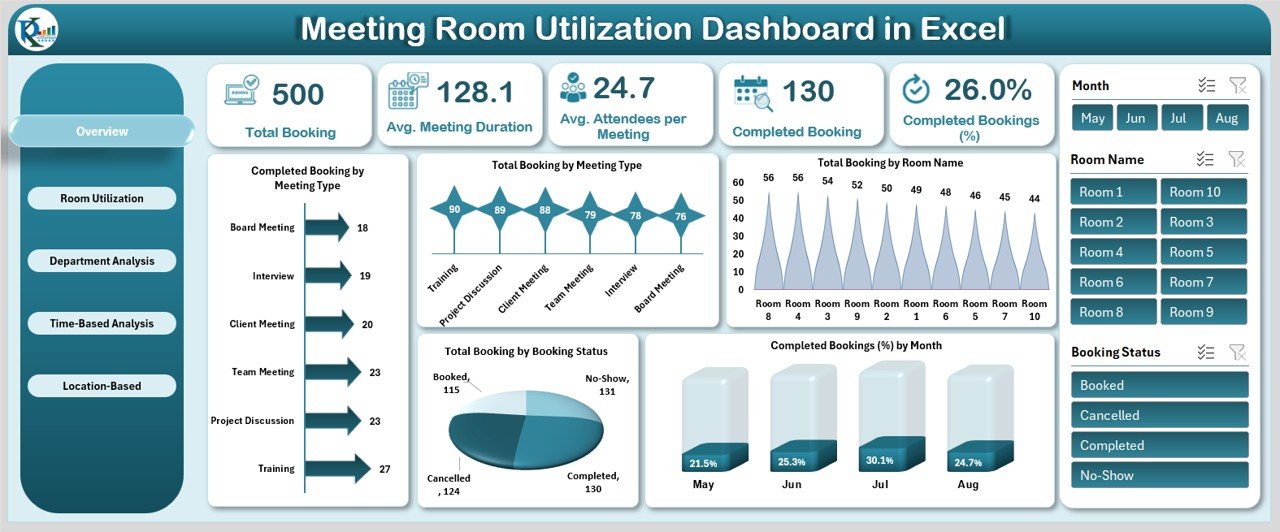
The Overview sheet provides a high-level snapshot of meeting room utilization using cards and charts.
Cards Include:
-
Total Booking: Total number of meetings scheduled.
-
Avg. Meeting Duration: Average duration of all meetings.
-
Avg. Attendees per Meeting: Insight into room occupancy.
-
Completed Booking: Total meetings that were successfully completed.
-
Completed Bookings (%): Percentage of meetings completed versus total bookings.
Charts Include:
-
Completed Booking by Meeting Type: Analyze which types of meetings are most likely to be completed.
-
Total Booking by Meeting Type: Distribution of all bookings by type.
-
Total Booking by Room Name: Identify heavily booked rooms.
-
Completed Bookings (%) by Month: Track monthly completion rates.
-
Total Booking by Booking Status: View active, canceled, or pending bookings.
Click to Buy Meeting Room Utilization Dashboard in Excel
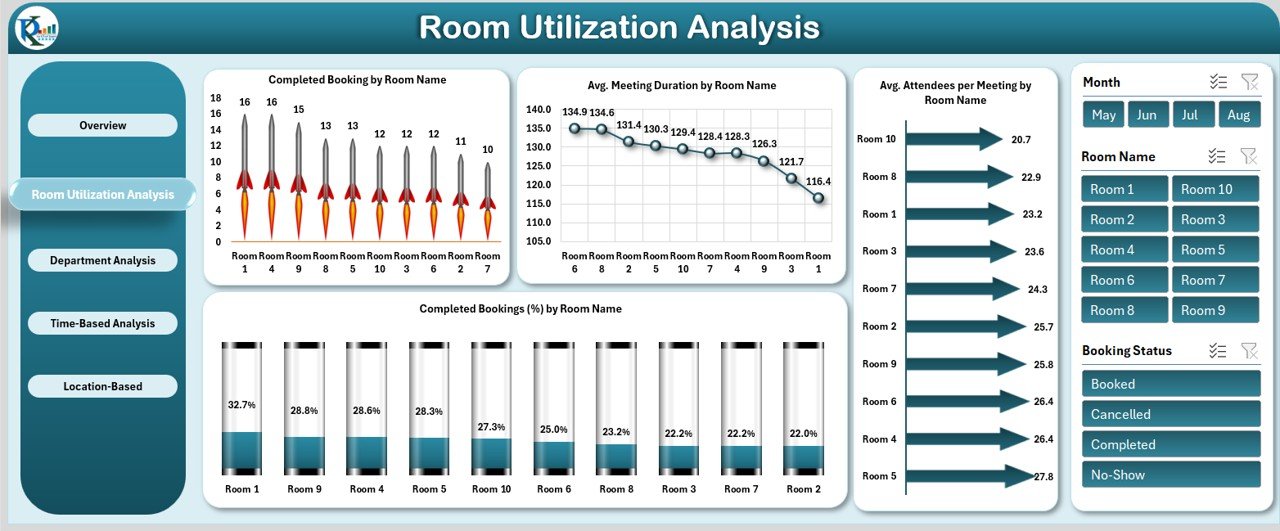
2. Room Utilization Analysis
This sheet focuses on the performance of individual meeting rooms.
Charts Include:
-
Completed Booking by Room Name: Understand which rooms are frequently utilized.
-
Avg. Meeting Duration by Room Name: Measure average time spent per room.
-
Avg. Attendees per Meeting by Room Name: Identify rooms that accommodate larger groups.
-
Completed Bookings (%) by Room Name: Determine rooms with the highest booking success.
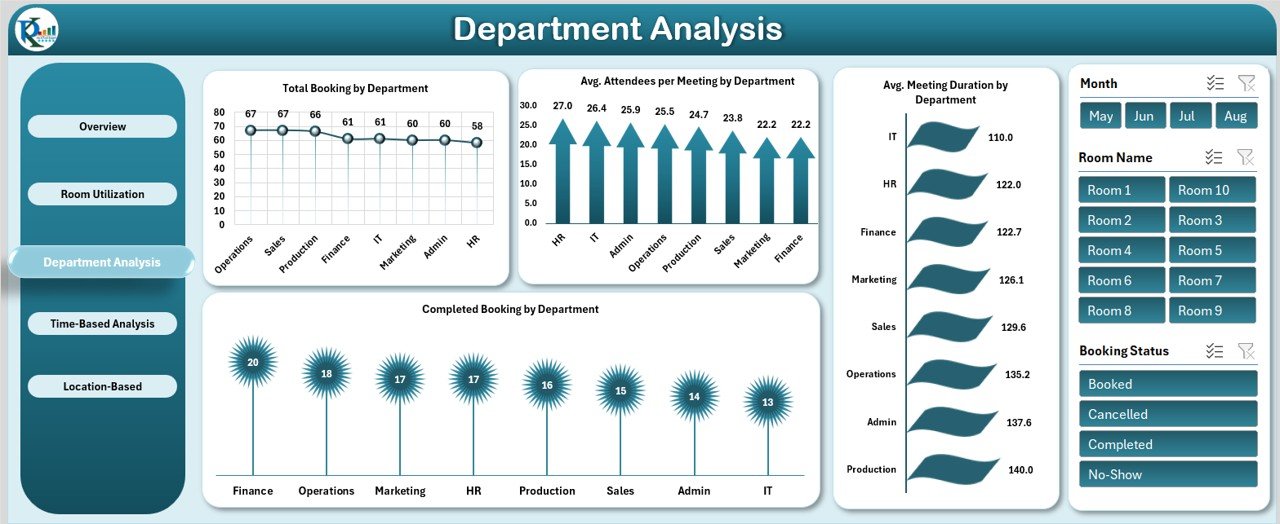
3. Department Analysis
Departments often have varying needs for meeting spaces. This sheet provides a departmental view.
Charts Include:
-
Total Booking by Department: Which teams book the most meetings?
-
Avg. Attendees per Meeting by Department: Understand departmental meeting sizes.
-
Avg. Meeting Duration by Department: Track how long each department’s meetings last.
-
Completed Booking by Department: Measure completion success per team.
Click to Buy Meeting Room Utilization Dashboard in Excel
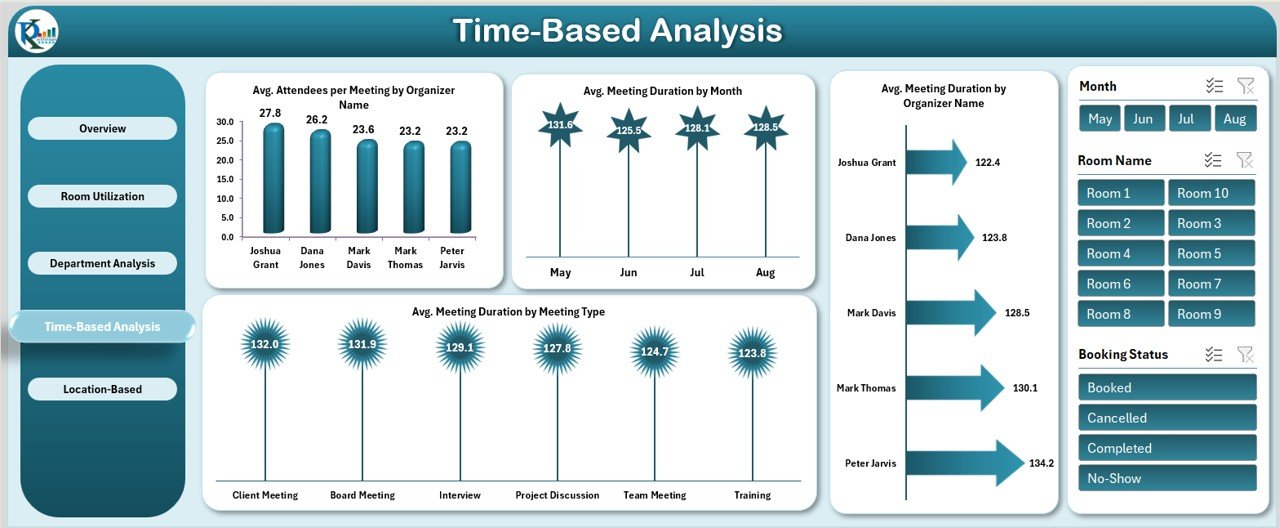
4. Time-Based Analysis
Analyzing usage patterns over time ensures better scheduling and room allocation.
Charts Include:
-
Avg. Attendees per Meeting by Organizer Name: Monitor key organizers’ meeting trends.
-
Avg. Meeting Duration by Month: Identify monthly usage patterns.
-
Avg. Meeting Duration by Organizer Name: See which organizers hold longer meetings.
-
Avg. Meeting Duration by Meeting Type: Compare durations across meeting categories.
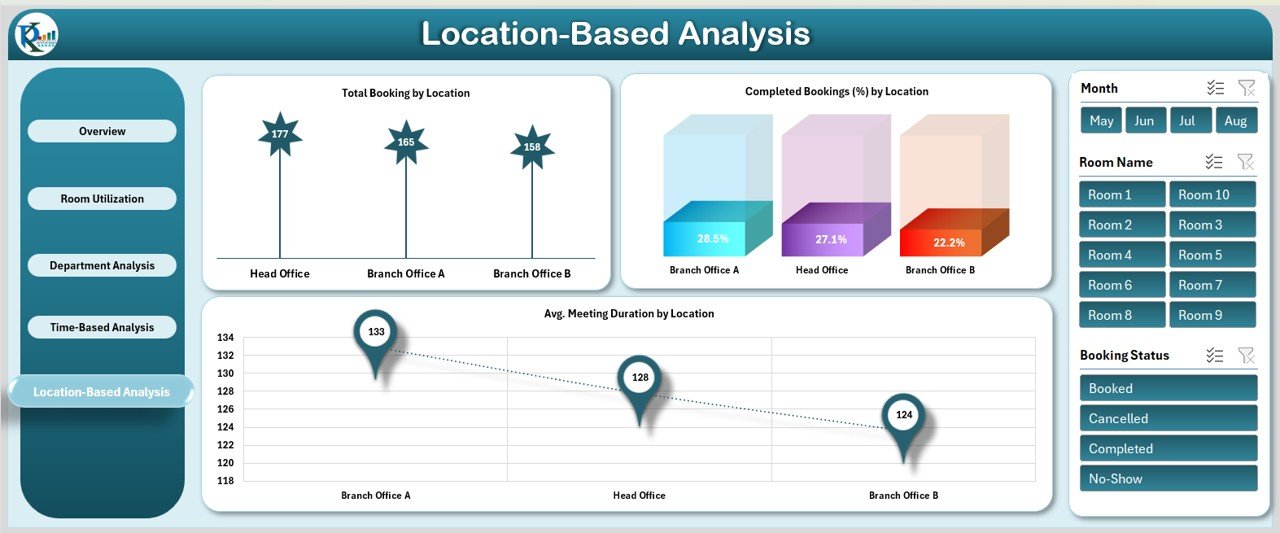
5. Location-Based Analysis
For organizations with multiple office locations, location-specific insights are essential.
Charts Include:
-
Total Booking by Location: See which locations have the most meetings.
-
Completed Bookings (%) by Location: Identify locations with high completion rates.
-
Avg. Meeting Duration by Location: Measure average meeting time per location.
Click to Buy Meeting Room Utilization Dashboard in Excel
6. Data Sheet Tab
The Data sheet acts as the database for the dashboard. It captures all relevant meeting information for analysis:
-
Booking ID
-
Room Name
-
Meeting Type
-
Department
-
Organizer Name
-
Location
-
Start Date & Time
-
End Date & Time
-
Attendees Count
-
Booking Status
All charts and cards are dynamically linked to this data sheet, ensuring real-time updates whenever new data is added.
Benefits of Using This Dashboard
Click to Buy Meeting Room Utilization Dashboard in Excel
-
Optimize Room Usage: Identify underutilized rooms and redistribute meetings efficiently.
-
Improve Scheduling: Detect peak booking periods and avoid conflicts.
-
Measure Productivity: Analyze meeting durations and attendance for better planning.
-
Department Insights: Understand departmental needs and resource allocation.
-
Time & Location Management: Plan better across multiple locations and months.
Frequently Asked Questions (FAQ)
Q1: Can this dashboard be customized for my organization?
Yes, all sheets, charts, and formulas can be modified to fit your company’s specific meeting room structure and reporting needs.
Q2: Do I need advanced Excel skills to use this dashboard?
No. The dashboard is ready-to-use with clear instructions for adding data and interpreting charts.
Q3: Can I track cancellations or reschedules?
Yes. The dashboard tracks booking status, allowing you to filter by canceled, rescheduled, or completed meetings.
Q4: Can I visualize usage trends over time?
Absolutely. Time-based charts provide monthly and organizer-specific trends for better analysis.
Q5: Is this suitable for multiple office locations?
Yes. Location-based analysis enables tracking and comparison across offices.
Opportunities for Improvement
Click to Buy Meeting Room Utilization Dashboard in Excel
-
Integration with Calendar Systems: Sync with Outlook or Google Calendar for automatic updates.
-
Advanced Analytics: Incorporate predictive analytics to forecast room demand.
-
Automated Alerts: Notify organizers of overlapping or conflicting bookings.
-
Mobile Accessibility: Enable access to dashboard insights on mobile devices.
Conclusion
The Meeting Room Utilization Dashboard in Excel is an essential tool for organizations looking to maximize their meeting room efficiency and improve operational planning. With comprehensive insights across rooms, departments, time periods, and locations, this dashboard empowers decision-makers to streamline scheduling, optimize resource use, and enhance overall productivity.
Visit our YouTube channel to learn step-by-step video tutorials
Click to Buy Meeting Room Utilization Dashboard in Excel