Managing music performances, cultural programs, rehearsals, and artist development demands constant attention. Teams handle many tasks at the same time such as event planning, stage setup, rehearsal management, ticket sales, creative quality checks, and audience engagement. When this information spreads across multiple files, it becomes difficult to monitor the overall performance. Because of this, many music academies, performing arts institutions, event organizers, and production houses now use digital dashboards to track their KPIs.
A Music & Performing Arts KPI Dashboard in Power BI solves this problem in a powerful and simple way. It brings every performance indicator into a single visual platform. This makes it easy to check month-to-date (MTD) results, year-to-date (YTD) results, trends, targets, and comparisons with past performance. Decision-makers use this dashboard to improve show quality, grow their audience, and manage operations more efficiently.
This guide explains everything you need to know about this dashboard—from its pages and visuals to its benefits, features, use cases, best practices, and frequently asked questions.
Click to buy Music & Performing Arts KPI Dashboard in Power BI
What Is a Music & Performing Arts KPI Dashboard in Power BI?
A Music & Performing Arts KPI Dashboard in Power BI is a ready-to-use reporting system created for musicians, performing arts schools, event planners, orchestra groups, theatre companies, and cultural institutions. It captures essential KPIs and presents them in a visual format that allows for quick analysis.
You can track multiple performance areas such as:
- Student or artist performance
- Rehearsal productivity
- Show attendance
- Ticket revenue
- Creative quality
- Audience satisfaction
- Operational efficiency
- Training effectiveness
Since the dashboard uses structured KPIs, charts, slicers, cards, and drill-through pages, users understand trends faster and make timely decisions.
Why Do Music & Performing Arts Institutions Need This Dashboard?
Music and performing arts teams work in a dynamic environment. Activities happen every day and performance keeps shifting. Because of this, leadership teams need a clear picture of what works and what needs improvement.
A dashboard provides:
- Quick insights
- Clear comparisons
- Smart visuals
- Trend analysis
- Target tracking
- A single source of truth
It eliminates manual calculations and gives you the confidence to take decisions based on real numbers.
Key Features of the Music & Performing Arts KPI Dashboard in Power BI
This dashboard contains three essential pages, each designed to offer valuable insights.
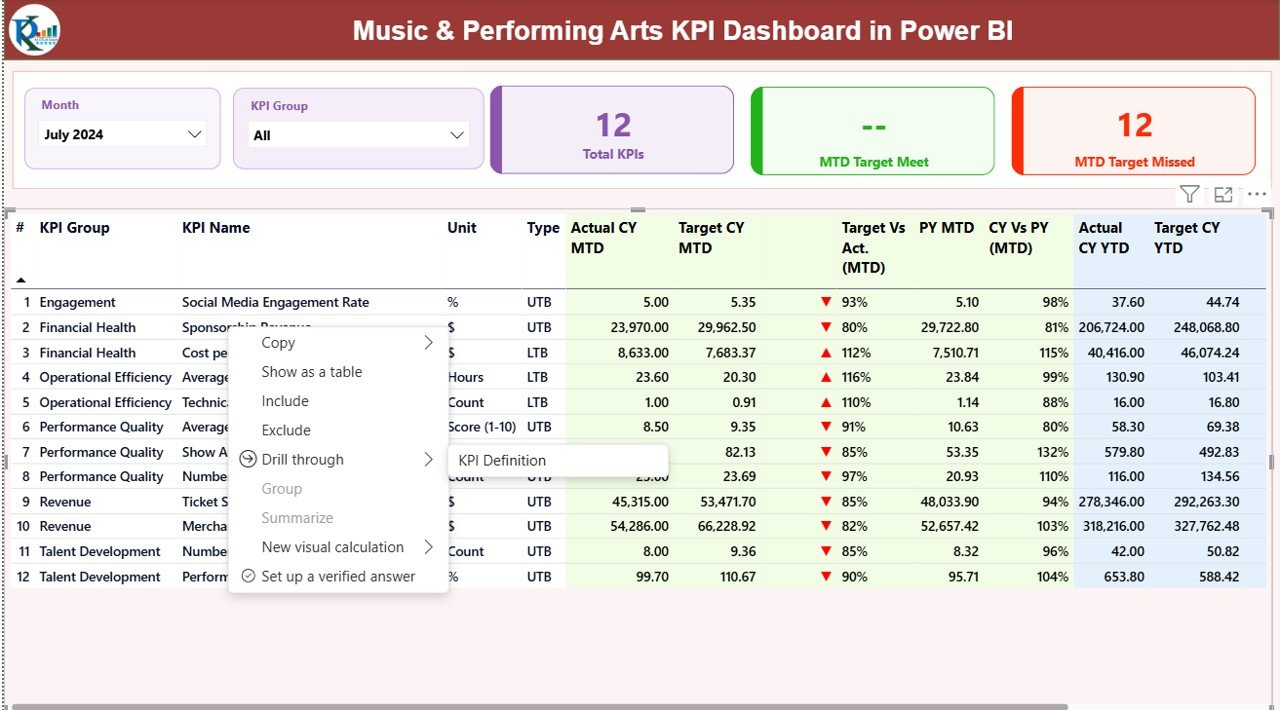
Summary Page – The Main Performance View
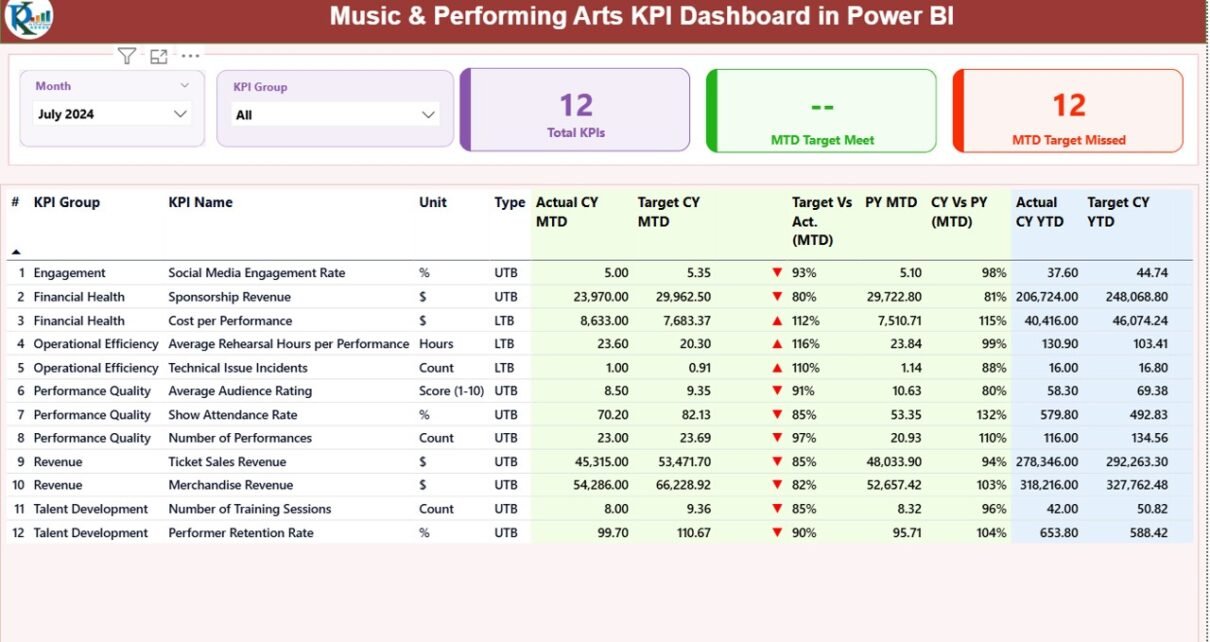
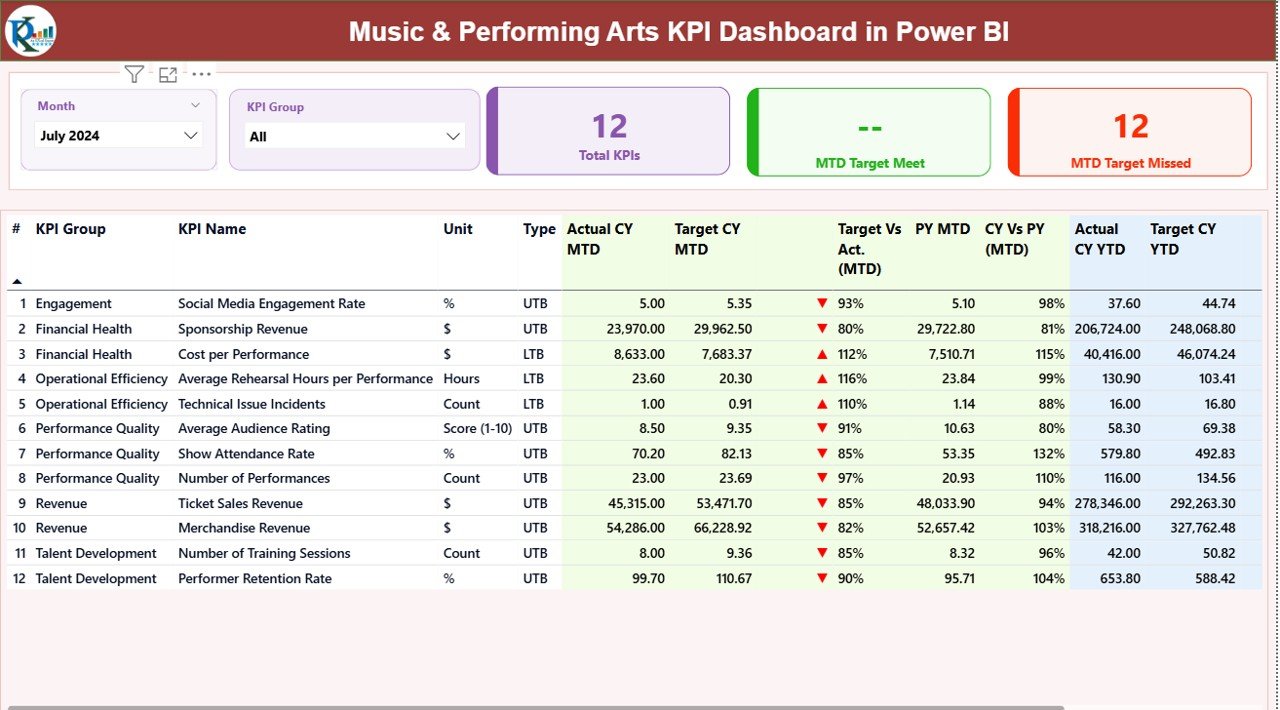
The Summary Page is the core page of the dashboard. It presents a complete view of all KPIs in one place. You can use the Month slicer and KPI Group slicer at the top to filter the whole dashboard.
Main Visuals on the Summary Page
Three Cards for Quick Insights
- Total KPIs
- MTD Target Met
- MTD Target Missed
These cards give a high-level picture of monthly progress.
Detailed KPI Table
This table includes:
- KPI Number: Sequence number for each KPI
- KPI Group: Category of the KPI
- KPI Name: Name of the KPI
- Unit: Measurement unit such as %, count, hours, or score
- Type: LTB (Lower The Better) or UTB (Upper The Better)
- Actual CY MTD: Current Year MTD actual values
- Target CY MTD: Current Year MTD targets
- MTD Status Icon: ▲ or ▼ in green or red to show KPI status
- Target vs Actual (MTD): Actual ÷ Target percentage
- PY MTD: Previous Year MTD
- CY vs PY (MTD): Comparison percentage
- Actual CY YTD: Current Year YTD actual
- Target CY YTD: Current Year YTD target
- YTD Status Icon: ▲ or ▼
- Target vs Actual (YTD): Actual ÷ Target percentage
- PY YTD: Previous Year YTD
- CY vs PY (YTD): YTD comparison percentage
This large table gives a complete picture of performance for every KPI.
Click to buy Music & Performing Arts KPI Dashboard in Power BI
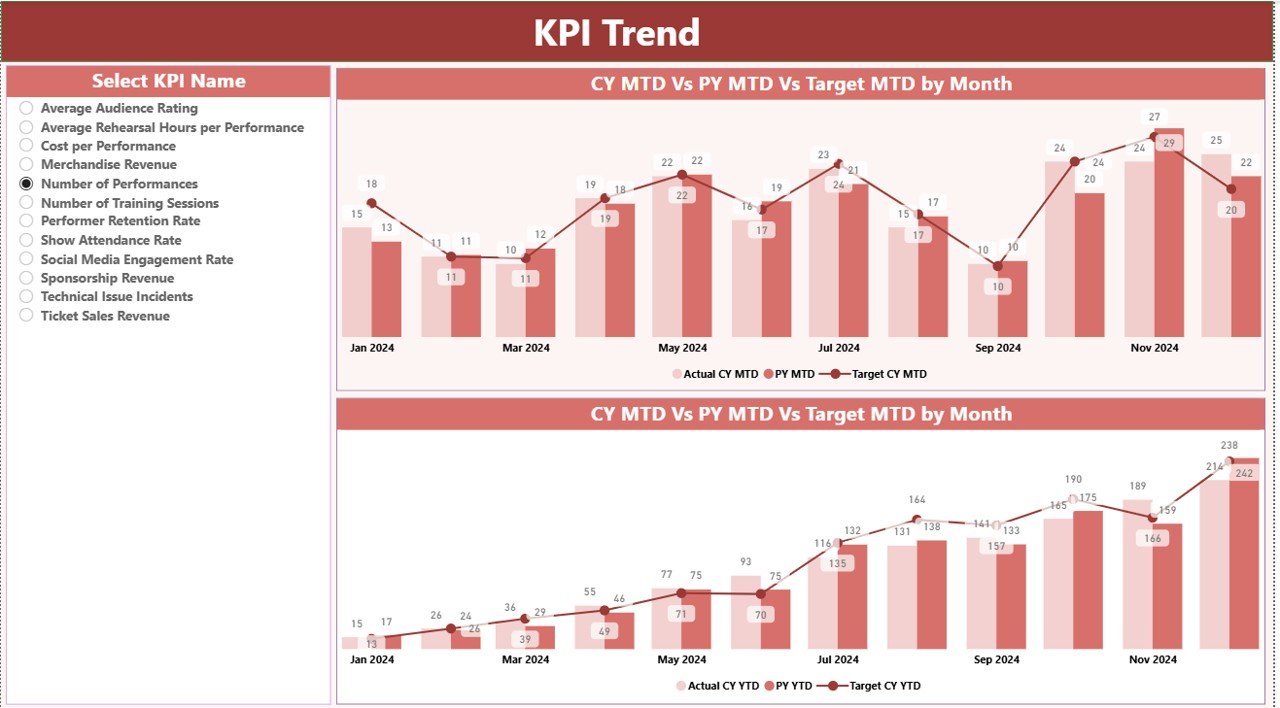
KPI Trend Page – Visual Charts for Better Understanding
The KPI Trend Page helps you understand the monthly trend for each KPI. You can choose any KPI from the slicer on the left side.
The page contains two combo charts:
- Chart for Current Year MTD, Previous Year MTD, and MTD Target
- Chart for Current Year YTD, Previous Year YTD, and YTD Target
These trend charts help you identify patterns, growth areas, and performance gaps.
Click to buy Music & Performing Arts KPI Dashboard in Power BI
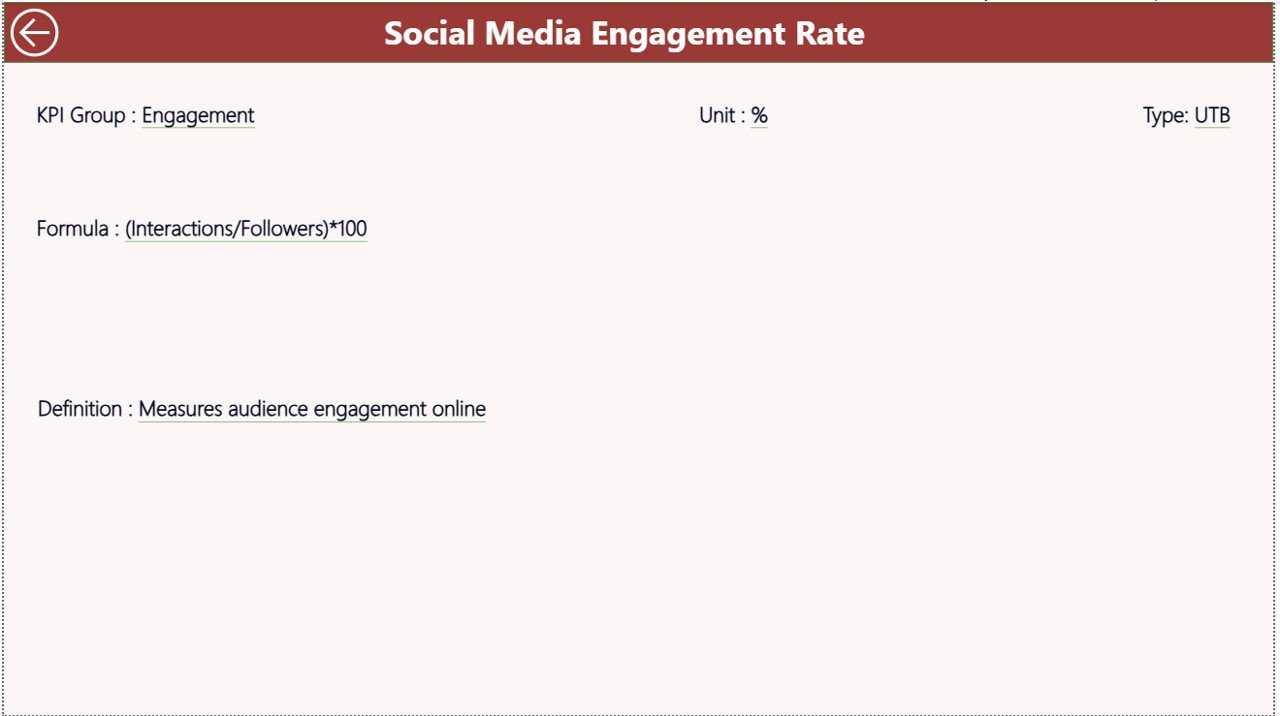
KPI Definition Page – Drill-Through Details
The KPI Definition Page is a hidden drill-through page. When you right-click on any KPI in the Summary Page and use drill-through, it opens the detailed view.
This page shows:
- KPI Number
- KPI Group
- KPI Name
- Unit
- Formula
- Definition
- Type (UTB / LTB)
This page is useful when users need to understand how a KPI works.
You can go back to the Summary Page by clicking the back button on the top-left corner.
Click to buy Music & Performing Arts KPI Dashboard in Power BI
Excel Data Structure Used in the Dashboard
The dashboard uses an Excel file as the data source. You need to fill three worksheets:
Input_Actual Sheet
This sheet contains:
- KPI Name
- Month
- MTD Actual
- YTD Actual
You must use the first date of each month as the Month value.
Input_Target Sheet
This sheet contains:
- KPI Name
- Month
- MTD Target
- YTD Target
Again, enter the first date of the month for consistency.
KPI Definition Sheet
This sheet includes details about each KPI:
- KPI Number
- KPI Group
- KPI Name
- Unit
- Formula
- Definition
- Type (UTB or LTB)
Once these sheets are filled, Power BI automatically updates the dashboard visuals.
Click to buy Music & Performing Arts KPI Dashboard in Power BI
What KPIs Should Music & Performing Arts Institutions Track?
Every institution may have different KPIs, but common performance indicators include:
Artist Performance KPIs
- Accuracy Score
- Creativity Score
- Rehearsal Attendance
- Skill Development Index
Show Performance KPIs
- Ticket Sales
- Audience Attendance
- Show Rating Score
- On-Time Show Start %
Operational KPIs
- Equipment Usage
- Stage Setup Time
- Staff Productivity
- Cost Per Event
Training KPIs
- Training Hours
- New Student Enrollment
- Student Improvement Score
- Certification Rate
These KPIs help track performance from different angles.
Advantages of a Music & Performing Arts KPI Dashboard in Power BI
A dashboard offers many benefits that support growth and decision-making.
- Clear Visual Insights
The dashboard uses charts, tables, cards, and slicers to show performance. Users can understand performance at a glance.
- Better Tracking of MTD and YTD Progress
The dashboard shows both MTD and YTD information. This helps teams understand monthly progress and long-term performance.
- Faster Comparison With Past Year Data
The CY vs PY section allows you to compare performance with previous year results. This gives you a clear view of improvement.
- Drill-Through for KPI Understanding
Users can drill through to view detailed definitions, formulas, and explanations. This helps new users understand each KPI better.
- No Manual Calculations Needed
Once you enter the data into Excel, the dashboard updates automatically. This saves time and effort.
- Complete Overview of the Institution
With this dashboard, leadership teams can track:
- Student performance
- Event quality
- Rehearsal productivity
- Ticket revenue
- Training progress
- Operational efficiency
Everything stays organized in one place.
How to Use the Dashboard Effectively?
Follow the steps below to get the best results:
- Choose a Month and KPI Group
The slicers help you filter the entire dashboard.
- Check the KPI Summary Table
Identify which KPIs are on target and which ones need improvement.
- Review MTD and YTD Comparisons
Look at the trend to understand if your performance is improving.
- Use Trend Charts
Trend charts help you spot patterns and seasonal effects.
- Drill-Through for More Details
If you want to understand how a KPI works, use the drill-through option.
Best Practices for the Music & Performing Arts KPI Dashboard
To get the best results, follow these best practices:
- Maintain Clean and Accurate Data
Always enter the correct numbers in Excel. Clean data ensures accurate visuals.
- Use Consistent Units and KPI Types
Always use the same measurement unit for each KPI. Also keep LTB/UTB consistent.
- Update the Data Every Month
Regular updates will improve decision-making and keep the dashboard relevant.
- Track the Right KPIs
Choose KPIs that match your institution’s goals.
- Compare with Previous Year
PY data helps you understand long-term growth.
- Use Visuals to Drive Decisions
Charts show the real picture behind the numbers. Review them regularly.
Conclusion
The Music & Performing Arts KPI Dashboard in Power BI is a powerful tool for institutions that want to improve performance. It helps track student performance, show quality, operation efficiency, audience engagement, and overall growth. With its visual design, drill-through pages, and easy Excel data entry, the dashboard offers a smart way to manage all KPIs in one place.
Whether you run a music school, theatre company, orchestra group, or event production unit, this dashboard can help you make better decisions and achieve higher performance.
Frequently Asked Questions (FAQs)
- Who can use this Music & Performing Arts KPI Dashboard?
Music schools, performing arts institutions, theatre groups, event organizers, and production houses can use this dashboard.
- Do I need Power BI expertise to use this dashboard?
No. The dashboard is ready to use. You only need to enter data in the Excel sheets.
- Can I add more KPIs?
Yes. You can add more KPIs in the KPI Definition sheet and update the dataset in Power BI.
- Does the dashboard support drill-through?
Yes. You can drill through to see KPI formulas and descriptions.
- How often should I update the dashboard?
Update it monthly for the best results.
- Can I customize the design?
Yes. You can change colors, charts, and layout in Power BI Desktop.
- What type of data source does it use?
It uses an Excel file with three sheets: Actuals, Targets, and KPI Definitions.
- Does the dashboard support comparison with previous years?
Yes. The MTD and YTD sections include PY comparisons.
Visit our YouTube channel to learn step-by-step video tutorials
Watch the step-by-step video tutorial:
Click to buy Music & Performing Arts KPI Dashboard in Power BI