Managing office issues efficiently is vital for smooth operations, employee satisfaction, and timely resolution. The Office Issues Management Dashboard in Excel provides a ready-to-use solution to track, analyze, and manage workplace issues across departments, channels, and locations.
In this article, we’ll explain the dashboard’s features, advantages, best practices, and how it helps organizations improve issue management.
What Is an Office Issues Management Dashboard?
An Office Issues Management Dashboard is a structured Excel tool designed to track and monitor office-related issues. It helps managers measure response times, resolution efficiency, employee satisfaction, and escalation trends.
Using this dashboard, organizations can:
-
Visualize issue trends and resolution rates
-
Monitor departmental performance in handling requests
-
Identify recurring issues and bottlenecks
-
Make data-driven decisions to improve office efficiency
Key Features of the Office Issues Management Dashboard
Click to Buy Office Issues Management Dashboard in Excel
This dashboard consists of multiple sheet tabs, each designed for specific insights:
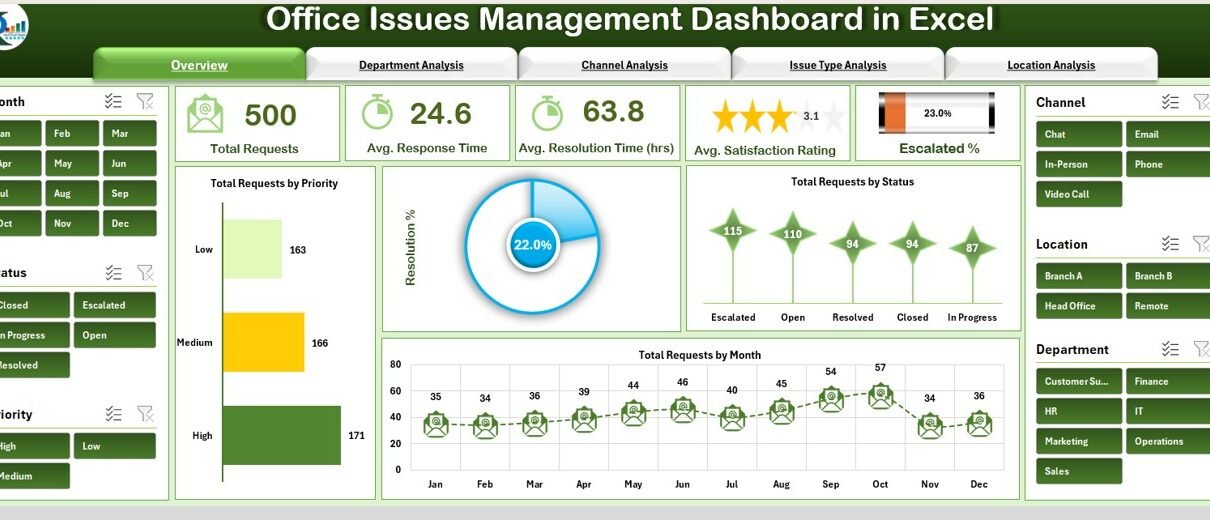
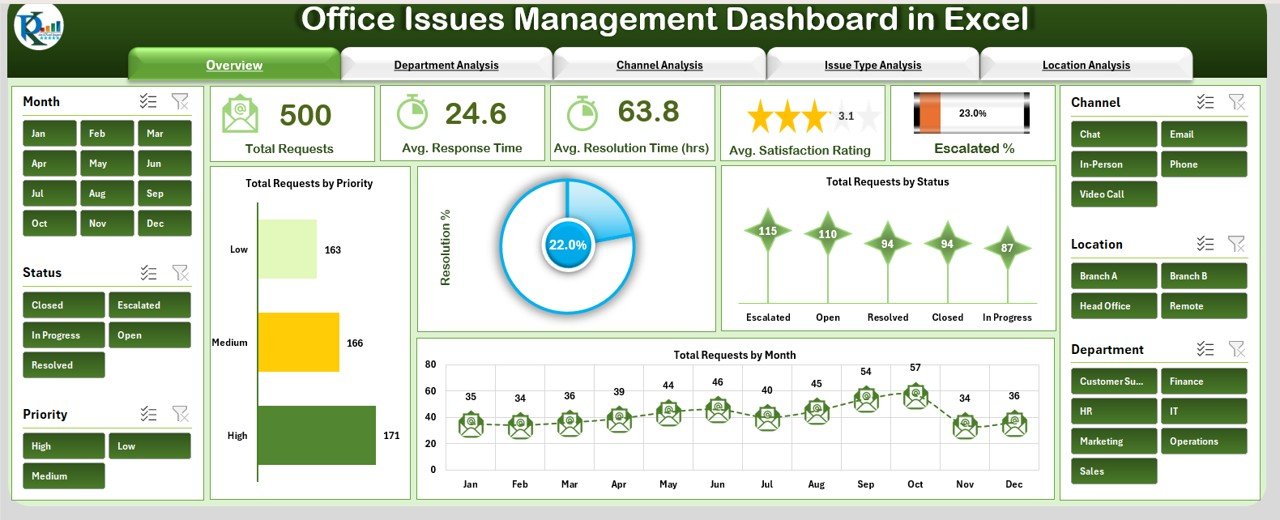
1. Overview Sheet Tab
The Overview Sheet provides a high-level snapshot of office issue management.
Cards Section:
-
Total Requests: Total number of issues reported
-
Avg. Response Time (hrs): Average time taken to respond to issues
-
Avg. Resolution Time (hrs): Average time taken to resolve issues
-
Avg. Satisfaction Rating: Average employee satisfaction score
-
Escalated %: Percentage of issues escalated for higher-level attention
Charts Section:
-
Total Requests by Priority – Categorizes issues by priority levels
-
Total Requests by Status – Shows open, in-progress, and closed issues
-
Total Requests by Month – Tracks issue volume over time
-
Resolution % – Overall resolution percentage
Click to Buy Office Issues Management Dashboard in Excel
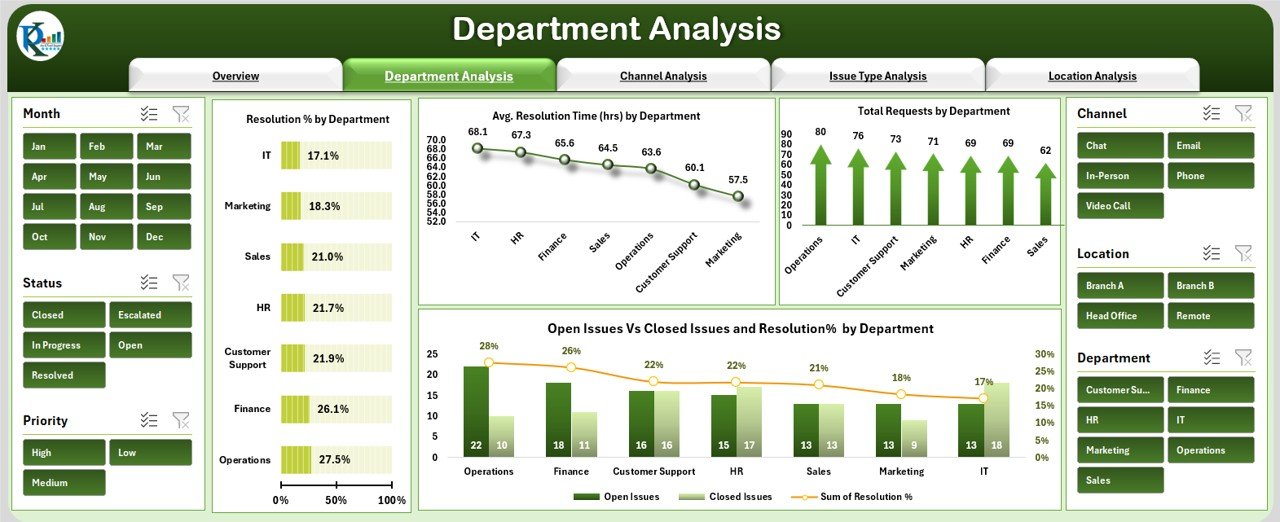
2. Department Analysis Sheet
The Department Analysis sheet evaluates performance by department.
Charts Section:
-
Resolution % by Department – Percentage of issues resolved by each department
-
Avg. Resolution Time (hrs) by Department – Tracks time efficiency per department
-
Total Requests by Department – Shows workload distribution
-
Open Issues vs Closed Issues and Resolution % by Department – Compares open vs. closed issues and resolution rates
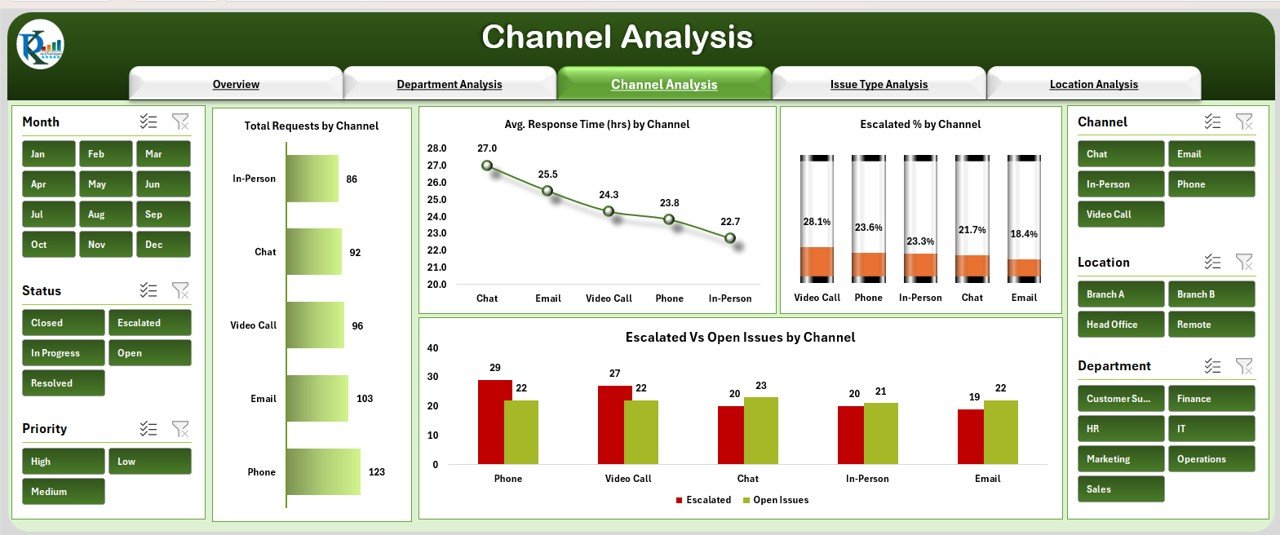
3. Channel Analysis Sheet
The Channel Analysis sheet monitors issue reporting channels.
Charts Section:
-
Total Requests by Channel – Number of issues per channel (email, portal, phone, etc.)
-
Avg. Response Time (hrs) by Channel – Response efficiency per channel
-
Escalated % by Channel – Percentage of escalated issues per channel
-
Escalated vs Open Issues by Channel – Comparison of escalated vs. unresolved issues
Click to Buy Office Issues Management Dashboard in Excel
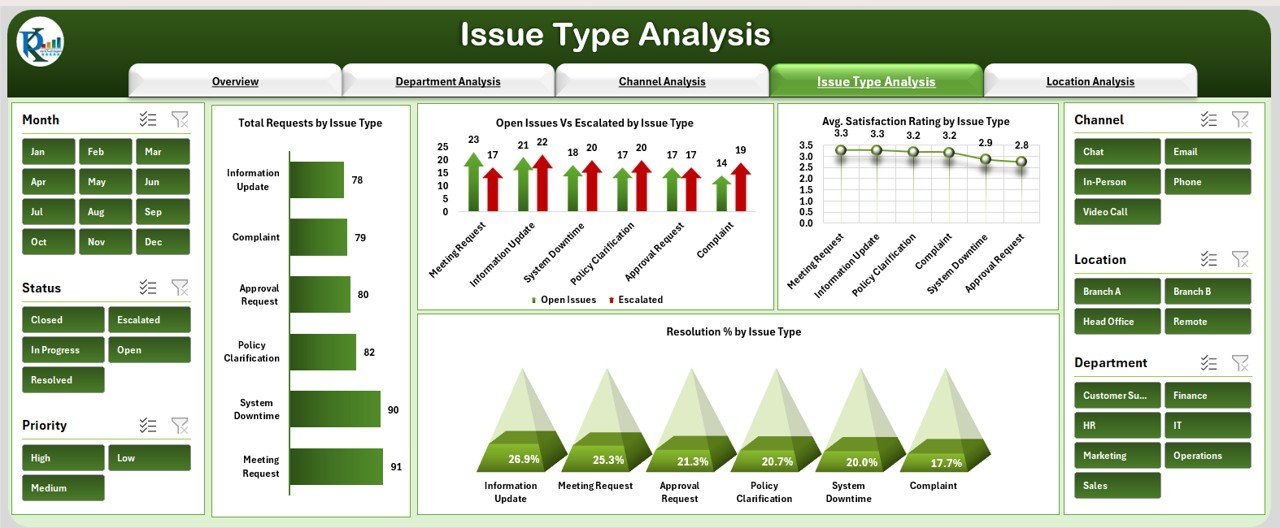
4. Issue Type Analysis Sheet
This sheet categorizes issues by type for better problem identification.
Charts Section:
-
Total Requests by Issue Type – Volume of issues per category
-
Open Issues vs Escalated by Issue Type – Identifies critical issue types
-
Avg. Satisfaction Rating by Issue Type – Employee satisfaction by issue category
-
Resolution % by Issue Type – Tracks efficiency of resolving each issue type
Click to Buy Office Issues Management Dashboard in Excel
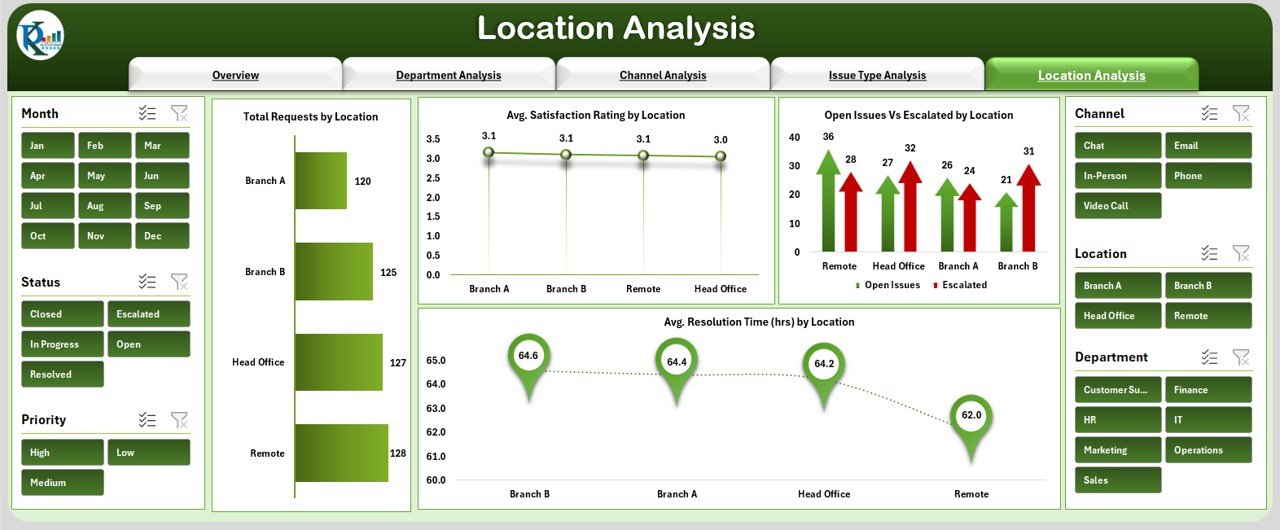
5. Location Analysis Sheet
The Location Analysis sheet provides insights by office or branch location.
Charts Section:
-
Total Requests by Location – Volume of issues per location
-
Avg. Satisfaction Rating by Location – Measures employee satisfaction by location
-
Open Issues vs Escalated by Location – Highlights problem areas
-
Avg. Resolution Time (hrs) by Location – Time efficiency per location
6. Data Sheet Tab
The Data Sheet is the input sheet where all office issues are recorded:
-
Includes columns for request ID, priority, status, department, channel, issue type, location, response time, resolution time, satisfaction rating, and escalation
-
Updating this sheet automatically reflects in all other charts and summaries
Advantages of Using the Office Issues Management Dashboard
Click to Buy Office Issues Management Dashboard in Excel
-
Centralized Tracking: All office issues are tracked in one place
-
Visual Insights: Cards and charts provide instant understanding of trends
-
Identify Bottlenecks: Pinpoint departments, channels, or locations with delays
-
Monitor Employee Satisfaction: Measure satisfaction scores per issue type or department
-
Optimize Processes: Reduce response and resolution times
-
Data Accuracy: Structured input ensures reliable reporting
Best Practices for Using the Dashboard
-
Update Data Promptly: Enter new requests as they are reported
-
Segment by Department, Channel, and Location: Track performance across dimensions
-
Monitor Escalation Rates: Identify recurring issues and prevent bottlenecks
-
Track Monthly Trends: Review total requests and resolution percentage month-to-month
-
Review Satisfaction Scores: Focus on improving employee experience in low-rated areas
How This Dashboard Helps Organizations
Click to Buy Office Issues Management Dashboard in Excel
-
Enhances Efficiency: Track requests and ensure timely resolution
-
Improves Accountability: Departments and channels are clearly monitored
-
Supports Decision-Making: Prioritize issues based on urgency and impact
-
Boosts Employee Satisfaction: Timely resolution leads to higher satisfaction
-
Identifies Recurring Issues: Focus on areas requiring process improvement
Frequently Asked Questions (FAQs)
Q1: Can this dashboard handle multiple departments and locations?
Yes, the dashboard supports analysis across all departments and office locations.
Q2: How often should the data be updated?
Daily or weekly updates are recommended to maintain accurate reporting.
Q3: Can I track escalated issues separately?
Yes, the dashboard includes charts and cards specifically for escalated issues.
Q4: Is this dashboard suitable for large organizations?
Absolutely. With structured data and Excel pivot capabilities, it can manage a large volume of requests efficiently.
Q5: Can this dashboard help improve resolution times?
Yes, tracking response and resolution times per department and channel highlights bottlenecks and helps optimize processes.
Conclusion
Click to Buy Office Issues Management Dashboard in Excel
The Office Issues Management Dashboard in Excel is a powerful tool for tracking, analyzing, and resolving office-related issues. With visual summaries, detailed departmental, channel, issue-type, and location analysis, it empowers managers to streamline operations, improve employee satisfaction, and enhance overall office efficiency.
Visit our YouTube channel to learn step-by-step video tutorials
Youtube.com/@NeotechNavigators
Watch the step-by-step video Demo:
Click to Buy Office Issues Management Dashboard in Excel