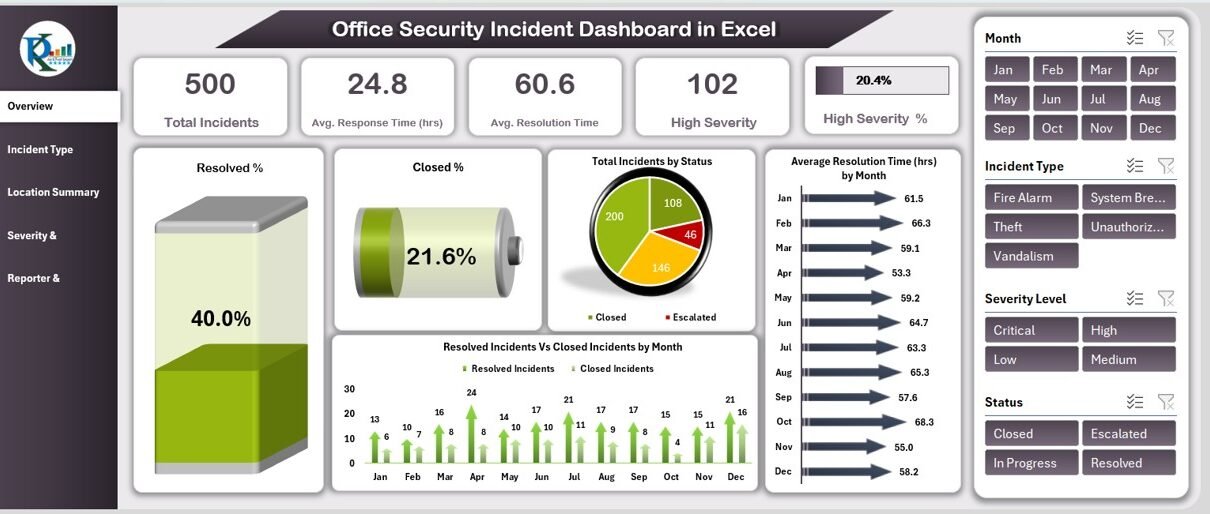
Effective office security management requires careful tracking and analysis of security incidents to identify patterns, improve response times, and enhance overall security protocols. The Office Security Incident Dashboard in Excel is a ready-to-use tool designed to help you monitor, analyze, and optimize your office’s security incident management. This comprehensive dashboard provides real-time insights into incidents, their severity, resolution times, and the performance of your security team.
In this article, we’ll guide you through the key features of the Office Security Incident Dashboard and explain how it helps enhance the security management process.
What is the Office Security Incident Dashboard in Excel?
The Office Security Incident Dashboard in Excel is a powerful tool designed to track and visualize key metrics related to security incidents within an organization. The dashboard consolidates data into easy-to-understand cards and charts, allowing security teams to monitor the number of incidents, response and resolution times, severity levels, and performance by location or team. This dashboard helps organizations quickly identify areas that require attention and ensures that all security incidents are managed effectively.
The dashboard is made up of multiple sheets that each focus on different aspects of incident tracking and analysis.
Key Features of the Office Security Incident Dashboard
Click to buy Office Security Incident Dashboard in Excel
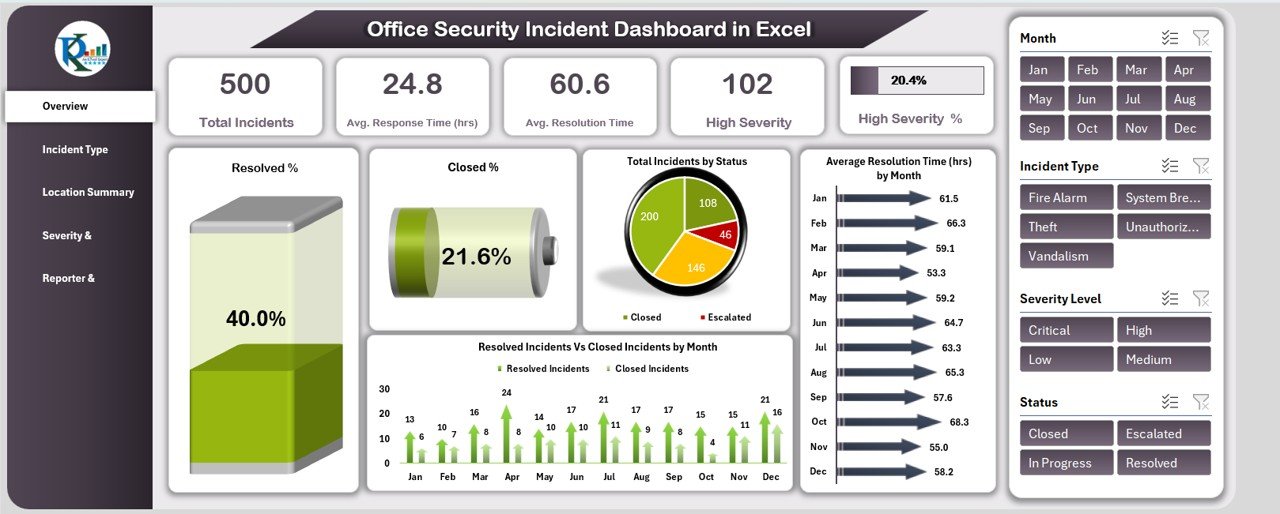
1) Overview Sheet Tab: High-Level Incident Overview
The Overview Sheet provides a quick snapshot of key incident metrics. It includes the following elements:
Cards:
- Total Incidents: Displays the total number of security incidents reported during the selected period.
- Avg. Response Time (hrs): Shows the average response time (in hours) for resolving incidents.
- Avg. Resolution Time (hrs): Displays the average time taken (in hours) to resolve incidents.
- High Severity Incidents: Tracks the number of high-severity incidents.
- High Severity %: Displays the percentage of incidents that are categorized as high severity.
These cards provide an immediate understanding of your organization’s incident management performance.
Charts:
- Resolved %: The percentage of incidents that have been resolved.
- Closed %: The percentage of incidents that have been closed.
- Total Incidents by Status: A chart that breaks down incidents by their current status (e.g., open, closed, resolved).
- Average Resolution Time (hrs) by Month: Shows the average resolution time for incidents broken down by month.
- Resolved Incidents Vs Closed Incidents by Month: A comparison of the number of incidents resolved versus closed each month.
- Incident Type Analysis: A chart that provides insights into the types of incidents reported (e.g., theft, injury, vandalism).
These charts offer a detailed analysis of the overall security incident data and trends, allowing you to track performance and pinpoint areas for improvement.
Click to buy Office Security Incident Dashboard in Excel
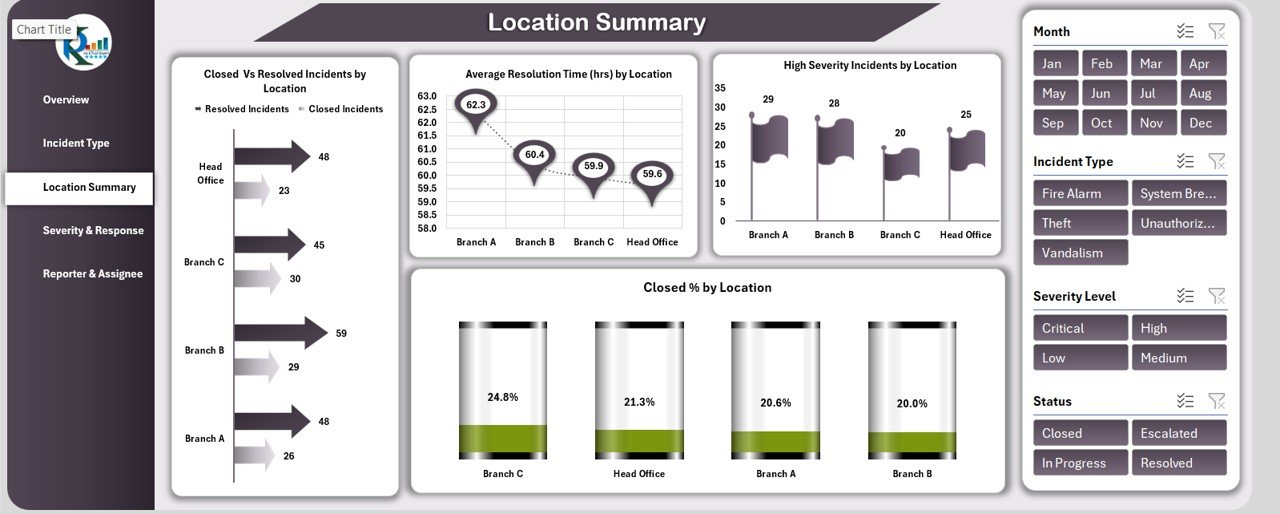
2) Location Summary Sheet Tab: Incident Analysis by Location
The Location Summary Sheet focuses on incidents by location, helping you monitor security incidents across different areas of your office or facility. The key charts include:
-
Closed vs. Resolved Incidents by Location: A comparison of closed and resolved incidents across different locations.
-
Average Resolution Time (hrs) by Location: Displays the average resolution time for incidents by location.
-
High Severity Incidents by Location: Shows the number of high-severity incidents reported at each location.
-
Closed % by Location: The percentage of incidents that have been closed at each location.
This sheet helps you analyze incident trends at specific locations and identify locations that may require additional security measures.
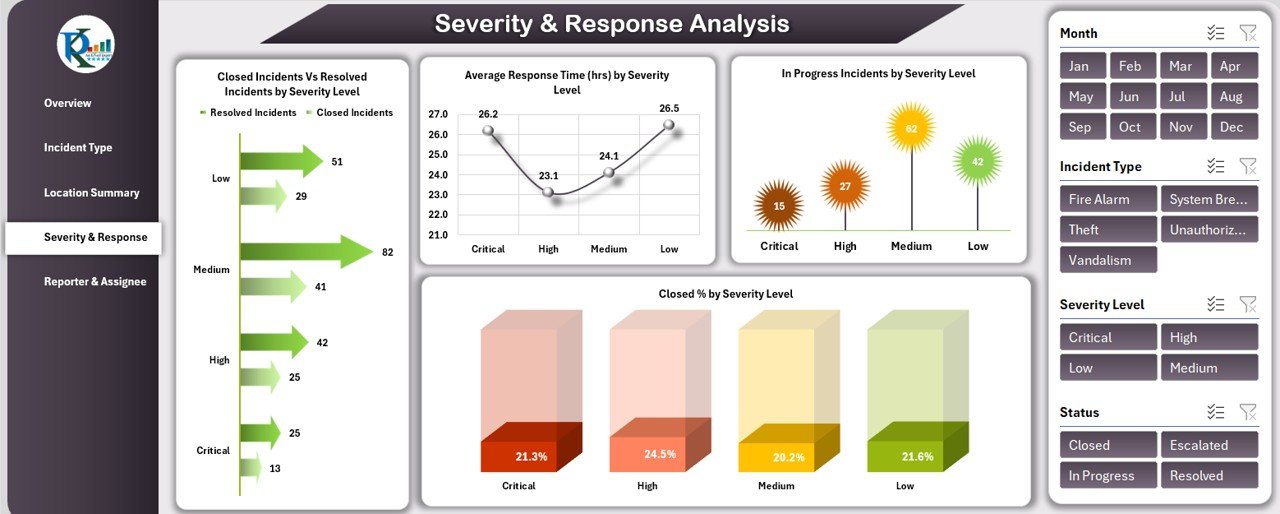
3) Severity & Response Analysis Sheet Tab: In-Depth Severity Level Analysis
The Severity & Response Analysis Sheet provides insights into how incidents are managed based on their severity. Key charts include:
-
Closed Incidents Vs Resolved Incidents by Severity Level: Compares closed incidents and resolved incidents based on severity (e.g., low, medium, high).
-
Average Response Time (hrs) by Severity Level: Displays the average response time for incidents by their severity level.
-
In Progress Incidents by Severity Level: Tracks incidents that are still in progress, categorized by severity.
-
Closed % by Severity Level: Shows the percentage of closed incidents based on their severity level.
This sheet allows you to track how quickly incidents are resolved depending on their severity, helping you improve response strategies for high-priority incidents.
Click to buy Office Security Incident Dashboard in Excel
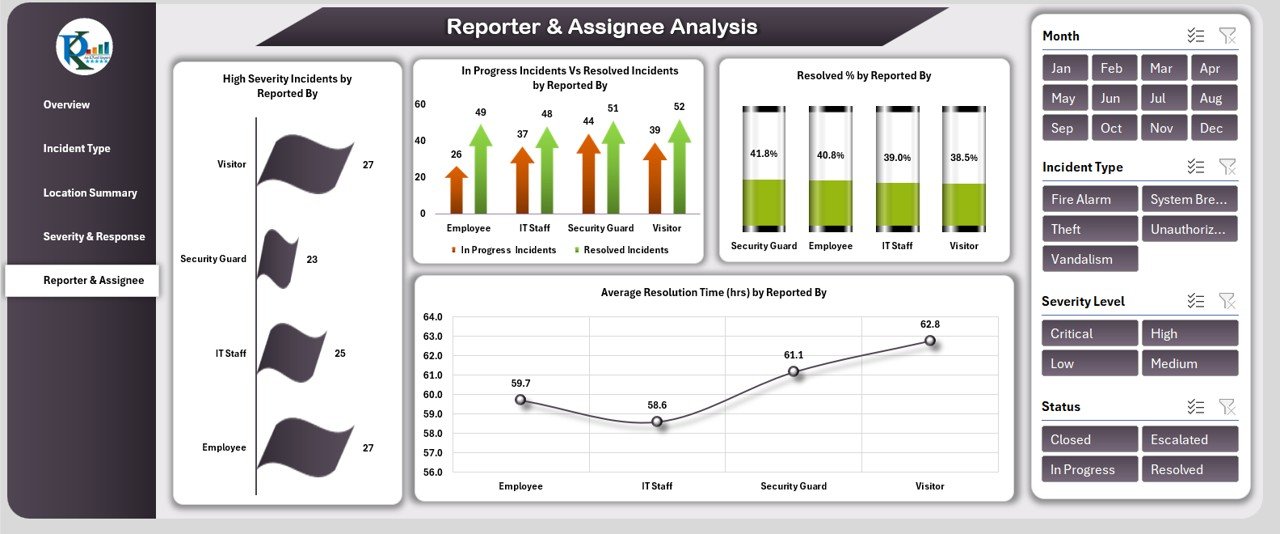
4) Reporter & Assignee Analysis Sheet Tab: Performance by Reporter and Assignee
The Reporter & Assignee Analysis Sheet focuses on tracking incident reporting and resolution performance based on who reported the incident and who is handling the resolution. Key charts include:
-
High Severity Incidents by Reported By: Displays the number of high-severity incidents reported by each individual.
-
In Progress Incidents Vs Resolved Incidents by Reported By: A comparison of incidents that are in progress versus those that have been resolved, broken down by the individual who reported them.
-
Resolved % by Reported By: Tracks the percentage of incidents that have been resolved by each individual reporter.
-
Average Resolution Time (hrs) by Reported By: Shows the average time taken to resolve incidents based on who reported them.
This sheet helps you evaluate the performance of individuals involved in reporting and resolving incidents, enabling you to identify bottlenecks or areas for improvement.
5) Data Sheet Tab: Raw Data Input
The Data Sheet Tab is where all incident data is entered. This sheet allows you to input detailed information about each security incident. Key columns include:
- ID: A unique identifier for each incident.
- Incident Type: The type of incident reported (e.g., theft, accident, vandalism).
- Date of Incident: The date the incident occurred.
- Reported By: The person who reported the incident.
- Assigned To: The person responsible for resolving the incident.
- Severity Level: The severity level of the incident (e.g., low, medium, high).
- Incident Status: The current status of the incident (e.g., open, closed, resolved).
- Response Time (hrs): The time it took to respond to the incident.
- Resolution Time (hrs): The time taken to resolve the incident.
- Remarks: Additional notes or details about the incident.
This sheet acts as the foundation for the entire dashboard, allowing you to enter and track data that feeds into the visual charts and metrics in other tabs.
Benefits of Using the Office Security Incident Dashboard
Click to buy Office Security Incident Dashboard in Excel
The Office Security Incident Dashboard offers several benefits for managing security incidents effectively:
-
Comprehensive Incident Tracking: The dashboard provides a clear view of all incidents, including their type, severity, and resolution status, helping you stay organized.
-
Real-Time Insights: The charts and cards provide real-time insights into incident management, helping you monitor response times and resolution efforts.
-
Performance Evaluation: The dashboard helps you assess the performance of your security team by analyzing response times, resolution times, and the status of incidents.
-
Data-Driven Decisions: With detailed charts and trend analysis, you can make data-driven decisions to improve your security processes and allocate resources more effectively.
-
Customizable: The dashboard is fully customizable, allowing you to add new metrics, modify existing charts, or adjust the template to fit your specific needs.
Best Practices for Using the Office Security Incident Dashboard
To get the most out of your Office Security Incident Dashboard, follow these best practices:
-
Update Data Regularly: Ensure that the Data Sheet Tab is updated with the latest incident details so that the dashboard reflects real-time data.
-
Monitor Key Metrics: Focus on critical KPIs, such as response time, resolution time, and the number of high-severity incidents, to ensure your security team is performing well.
-
Analyze Trends: Regularly review the charts to spot trends or patterns in incident types, severity levels, or response times. This can help identify areas for improvement.
-
Improve Incident Handling: Use the Severity & Response Analysis sheet to track and optimize the handling of high-severity incidents.
-
Share with Your Team: Share the dashboard with relevant team members to ensure that everyone is aligned on incident management and resolution.
Conclusion
Click to buy Office Security Incident Dashboard in Excel
The Office Security Incident Dashboard in Excel is an invaluable tool for organizations looking to improve their incident management processes. By providing real-time insights, performance tracking, and trend analysis, the dashboard helps security teams optimize response times, resolve incidents efficiently, and enhance overall security operations. With customizable features and easy-to-read charts, this dashboard simplifies incident tracking and provides actionable insights to improve security management.
Frequently Asked Questions (FAQs)
1. How often should I update the Office Security Incident Dashboard?
It is recommended to update the Data Sheet regularly, ideally after each incident is reported or resolved, to keep the dashboard up to date.
2. Can I customize the dashboard to include additional metrics?
Yes, the dashboard is fully customizable. You can add new metrics, charts, or data points based on your specific security needs.
3. How can I analyze incidents by location?
The Location Summary sheet provides insights into incidents based on location, allowing you to monitor and manage security efforts across different areas.
4. Can I track performance over time with this dashboard?
Yes, the dashboard tracks key metrics over time, such as resolution times and incident counts, making it easy to analyze trends and patterns.
5. How do I track high-severity incidents?
The Severity & Response Analysis section helps you track and manage high-severity incidents by analyzing response times, resolution times, and the status of these incidents.
Visit our YouTube channel to learn step-by-step video tutorials
Click to buy Office Security Incident Dashboard in Excel