Managing office waste becomes challenging when multiple departments, vendors, and waste categories generate different types of waste every day. Teams struggle when they track everything manually because sheets grow large, information gets scattered, and reporting becomes slow. However, an Office Waste Management Dashboard in Excel solves these problems in a simple and smart way.Office Waste Management Dashboard in Excel .
This dashboard brings every waste indicator into one place. It shows the waste quantity, cost, recycling patterns, monthly trends, vendor performance, and departmental statistics. As a result, teams get a clear picture of waste performance and take quick action.Office Waste Management Dashboard in Excel
In this detailed guide, you will explore what this dashboard is, how it works, why companies use it, and how each sheet helps users understand waste patterns better. You will also learn the advantages, best practices, and frequently asked questions related to office waste management.
Click to buy Office Waste Management Dashboard in Excel
What Is an Office Waste Management Dashboard in Excel?
An Office Waste Management Dashboard in Excel is a ready-to-use reporting system that tracks all types of waste generated in an office. It highlights disposal cost, recycled percentage, reused waste, compost performance, and vendor contribution in a clean visual format. Because the entire solution runs in Excel, users view insights instantly without any coding.
The dashboard contains multiple sheet tabs such as:
- Overview Sheet
- Waste Analysis
- Department Analysis
- Vendor Analysis
- Monthly Trends
Each sheet displays charts, indicators, and comparison visuals that help teams review their waste management efficiency. You also get automated calculations for disposal cost, composted waste ratio, vendor averages, and month-wise trends.
This dashboard works well for facility managers, environment officers, compliance teams, and sustainability managers who want a fast and easy way to monitor waste performance.
Why Do Offices Need a Waste Management Dashboard?
Offices generate paper waste, food waste, plastic waste, packaging waste, electronic waste, and other categories every day. Without a dashboard:
- Teams guess the patterns
- Vendors work without supervision
- Waste cost grows unexpectedly
- Recycling targets fail
- Composted waste does not reach expected levels
- Monthly reports take long to prepare
Because the dashboard tracks everything at a glance, offices save time and reduce unnecessary waste.
How Does the Office Waste Management Dashboard Work?
The dashboard works on simple Excel logic. Users enter daily or weekly waste data in an input sheet. The dashboard automatically updates visuals such as:
- Waste quantity (kg)
- Cost (USD)
- Composted waste %
- Recycled waste %
- Reused waste %
- Department-wise waste
- Vendor-wise waste
- Monthly trend charts
The dashboard updates instantly because formulas and pivot charts work in the background.
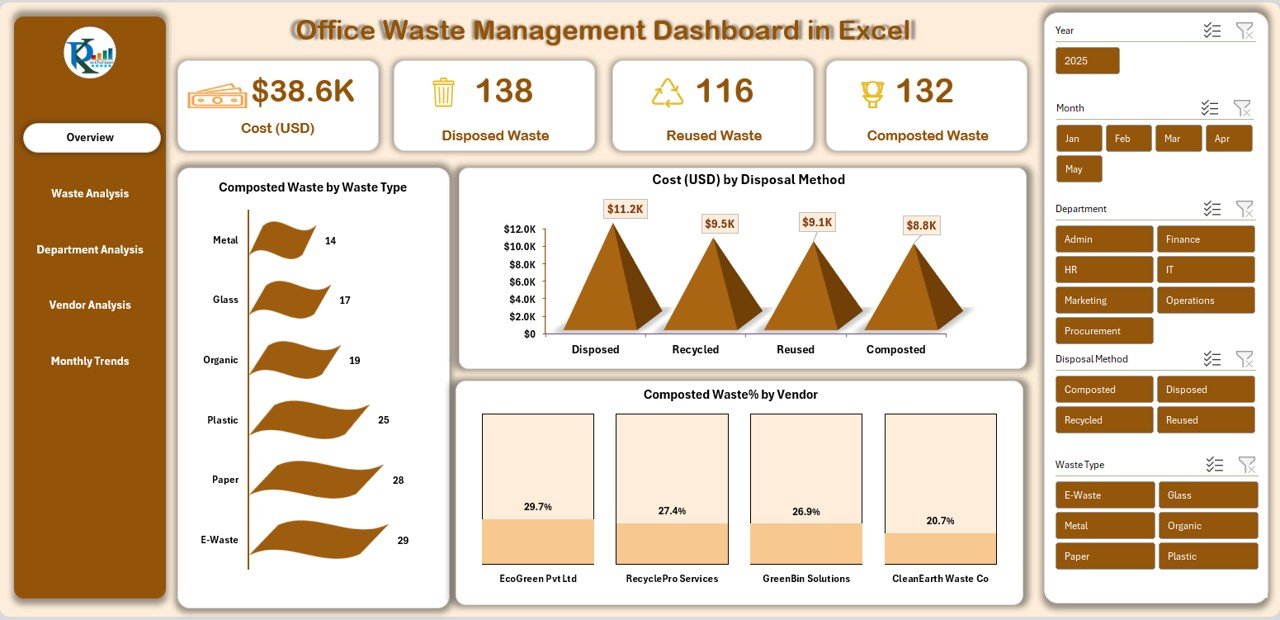
Overview Sheet: What Insights Does It Provide?
The Overview Sheet is the main sheet of the Office Waste Management Dashboard. It displays the total waste performance in one view. As a result, teams get quick insights without switching sheets.
Key Metrics Shown on the Overview Page:
- Cost (USD)
- Disposed Waste
- Reused Waste
- Composted Waste
- Composted Waste by Waste Type
- Cost (USD) by Disposal Method
- Composted Waste % by Vendor
Why the Overview Page Matters
This page helps users:
- Check total cost quickly
- Compare composted, reused, and disposed waste
- Track which waste type contributes most
- View vendor performance in composting
- Understand disposal method cost impact
Because the page displays everything in a clear layout, decision-making becomes quick.
Click to buy Office Waste Management Dashboard in Excel
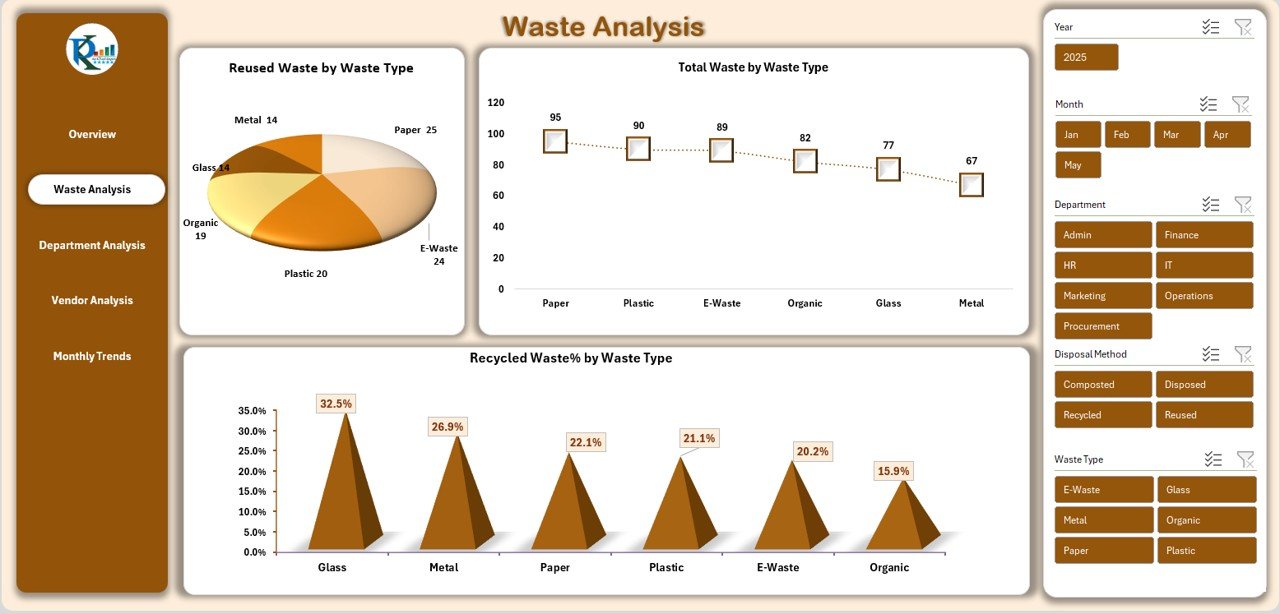
Waste Analysis Sheet: What Do You Learn From It?
The Waste Analysis sheet explains the detailed breakdown of waste categories. Offices usually generate waste such as paper, plastic, organic material, packaging waste, and metal. This sheet shows how every waste type performs across reused, recycled, and total waste categories.
Key Charts in the Waste Analysis Sheet
- Reused Waste by Waste Type
- Total Waste by Waste Type
- Recycled Waste % by Waste Type
Why This Sheet Is Useful
This sheet helps teams:
- Identify which waste type needs attention
- Improve recycling efforts
- Track waste type growth over time
- Make vendor decisions based on waste category
- Reduce high-cost waste types
Because waste patterns change frequently, this sheet gives accurate insights for timely action.
Click to buy Office Waste Management Dashboard in Excel
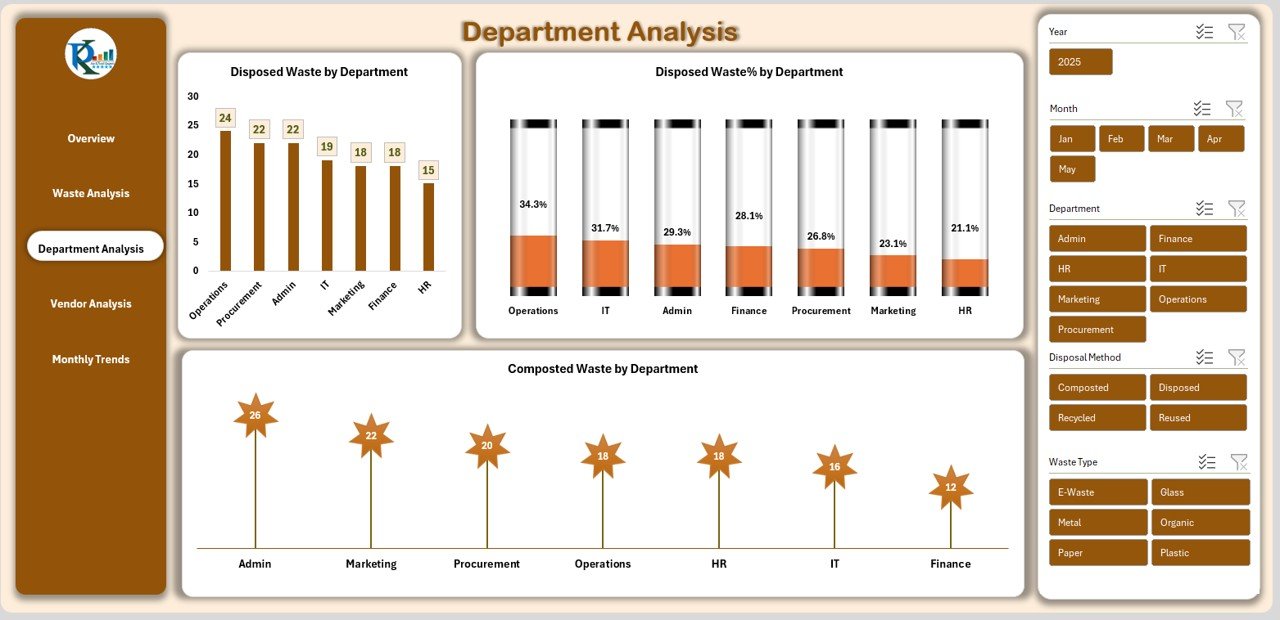
Department Analysis Sheet: What Does It Show?
Every department generates waste in different ways. The Department Analysis sheet highlights the contribution from each unit such as:
- Administration
- HR
- Finance
- Operations
- IT
- Housekeeping
- Pantry
- Security
Key Charts in Department Analysis
- Disposed Waste by Department
- Composted Waste by Department
- Disposed Waste % by Department
Why Departments Need This Analysis
This sheet helps teams:
- Identify high-waste departments
- Encourage waste reduction programs
- Show departments their performance
- Track composting and recycling efforts
- Create awareness drives
Because departmental comparison is important, this sheet supports target-based waste reduction efforts.
Click to buy Office Waste Management Dashboard in Excel
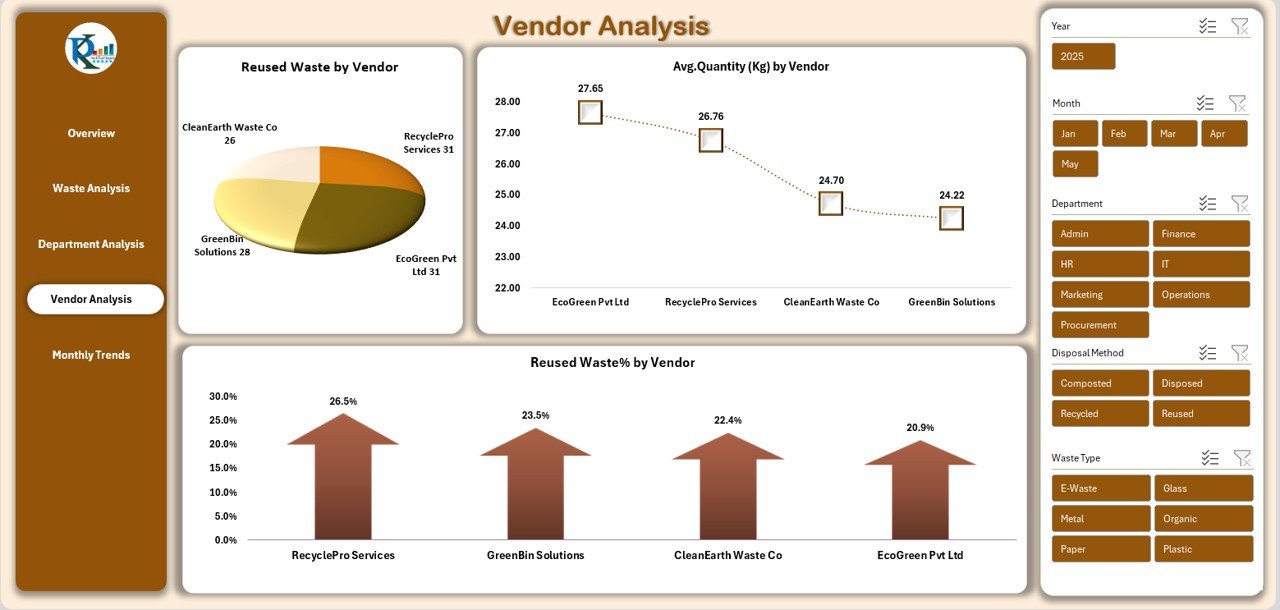
Vendor Analysis Sheet: How Does Vendor Performance Tracking Work?
Many offices hand over their waste to vendors for composting, recycling, or landfill disposal. The Vendor Analysis sheet helps track vendor efficiency and contribution.
Key Charts in Vendor Analysis
- Reused Waste by Vendor
- Reused Waste % by Vendor
- Average Quantity (Kg) by Vendor
Why Vendor Tracking Matters
Vendor performance makes a major impact on recycling rate and disposal cost. The dashboard helps teams:
- Compare vendors
- Identify top-performing vendors
- Negotiate contracts effectively
- Ensure waste goes to the right process
- Track composting vendors separately
Because vendor data is easy to understand in chart form, team decisions become smarter.
Click to buy Office Waste Management Dashboard in Excel
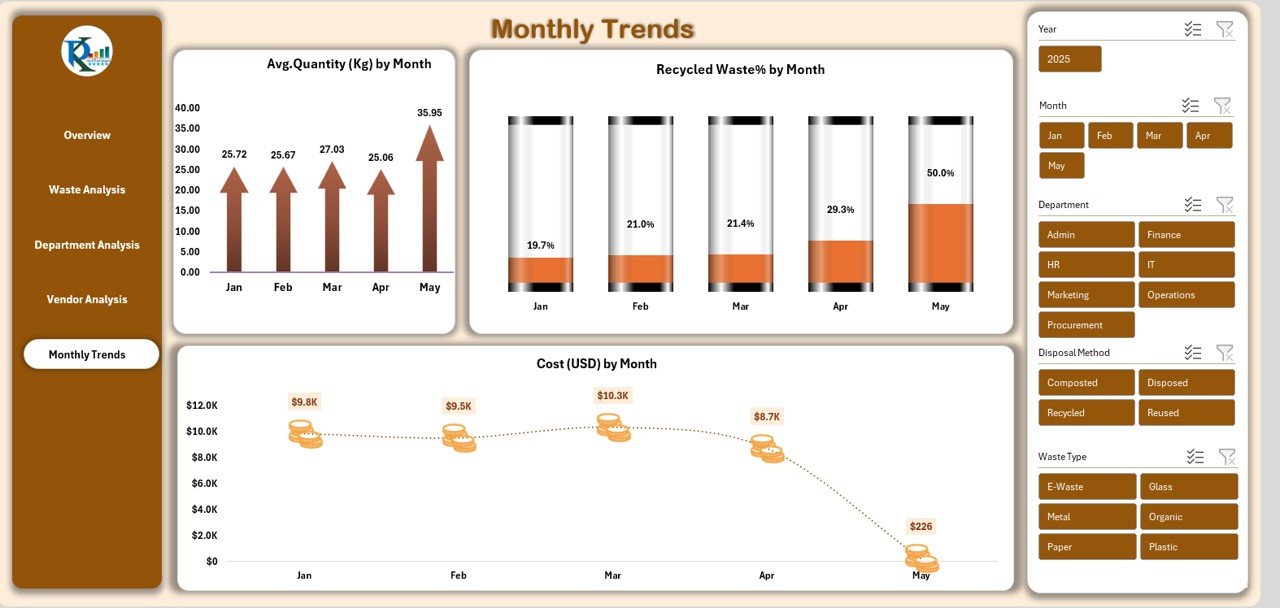
Monthly Trends Sheet: What Trends Can You Review?
The Monthly Trends sheet displays month-wise performance and highlights how waste behaves across the year.
Key Charts in Monthly Trends
- Average Quantity (Kg) by Month
- Cost (USD) by Month
- Recycled Waste % by Month
Why Trend Analysis Helps
Trend charts help teams:
- Identify months with high waste output
- Reduce waste during peak months
- Track seasonal food waste or packaging waste
- Review monthly cost fluctuations
- Improve recycling efforts month by month
Because trend forecasting improves planning, offices use this sheet to prepare smart waste-reduction strategies.
Click to buy Office Waste Management Dashboard in Excel
Advantages of Office Waste Management Dashboard in Excel
A dedicated section on advantages makes readers understand the value better. Below are the major benefits:
- Easy to Use for All Teams
The dashboard runs in Excel. Anyone can use it without technical training.
- Real-Time Insights
Teams see instant updates as soon as they enter new waste data.
- Better Decision-Making
Clear visuals help leaders make quick and correct decisions.
- Department-Wise Comparison
Teams review departmental waste levels and set improvement targets.
- Vendor Transparency
Vendor-wise charts highlight good and poor performers.
- Low Cost & Highly Customizable
Excel dashboards cost less and allow full customization.
- Supports Sustainability Goals
Recycling, composting, and reuse metrics help companies meet sustainability targets easily.
- Reduces Manual Reporting
The dashboard saves time because it automates calculations and visualization.
Best Practices for Using an Office Waste Management Dashboard
To get maximum value, follow these best practices:
- Enter Data Regularly
Update daily or weekly to maintain accurate reports.
- Use Standard Waste Categories
Avoid custom names because they create confusion in charts.
- Track Vendor Performance Monthly
Review vendor contribution each month to improve contract decisions.
- Compare Departments Fairly
Use consistent benchmarks while comparing departments.
- Analyze Trends Every Quarter
Quarterly trend review helps teams identify seasonal waste changes.
- Set Clear Reduction Targets
Assign department-wise and waste-type targets to reduce overall waste.
- Review Disposal Method Costs
Monitor disposal method costs to choose cost-efficient options.
- Encourage Recycling Awareness Programs
Use the dashboard data to run awareness sessions with employees.
- Share Insights with Management
Present dashboard results in monthly review meetings.
- Regularly Refresh formulas and pivot tables
Ensure all formulas work correctly and pivot tables stay updated.
Conclusion
An Office Waste Management Dashboard in Excel offers a complete solution for tracking office waste. It simplifies the work of sustainability teams, helps departments understand their performance, and keeps vendors accountable. Because the entire dashboard works in Excel, companies use it easily without training or expensive software.
The dashboard provides instant insights through Overview, Waste Analysis, Department Analysis, Vendor Analysis, and Monthly Trends sheets. As a result, companies reduce waste, lower cost, improve recycling, and meet sustainability goals faster.
If your office wants a simple and efficient waste management system, this Excel dashboard serves as the perfect tool.
Frequently Asked Questions (FAQs)
- What data do I need for the Office Waste Management Dashboard?
You need waste quantity (kg), cost (USD), waste type, department, vendor, disposal method, and month-wise data.
- Can I customize the dashboard for my company?
Yes. You can change waste types, vendors, colors, formulas, and chart formats because the dashboard runs in Excel.
- Who should use this dashboard?
Facility managers, environment teams, sustainability officers, operations managers, and compliance teams use it daily.
- Does the dashboard support multiple departments?
Yes. You can track unlimited departments and compare their waste performance clearly.
- How often should I update the waste data?
Daily or weekly updates work best because they keep insights accurate.
- Can I track compost, recycling, and disposal separately?
Yes. The dashboard has charts for composted waste, recycled waste, reused waste, and disposed waste.
- What makes this dashboard better than manual reports?
It saves time, improves accuracy, reduces manual effort, and provides real-time insights.
Visit our YouTube channel to learn step-by-step video tutorials
Watch the step-by-step video tutorial:
Click to buy Office Waste Management Dashboard in Excel