Oil and gas companies work in one of the most dynamic, fast-moving, and high-risk industries in the world. Daily operations shift quickly, exploration costs keep changing, production volumes rise and fall, and safety measures evolve every day. Because of this constant movement, leaders need accurate insights, clear metrics, and fast reporting. An Oil & Gas KPI Dashboard in Excel helps teams achieve these goals with ease.
This article explains everything about building and using an Oil & Gas KPI Dashboard in Excel. You will learn how it works, how each sheet functions, how KPIs support operational and financial decision-making, and why this dashboard becomes essential for smooth oil and gas operations.
Click to buy Oil & Gas KPI Dashboard in Excel
What Is an Oil & Gas KPI Dashboard in Excel?
An Oil & Gas KPI Dashboard in Excel is a ready-to-use performance tracking tool designed for upstream, midstream, and downstream operations. It helps companies monitor monthly and yearly KPIs, compare actual results with targets, and view insights in a clear visual format.
Since this dashboard runs in Excel, teams do not struggle with complex tools. They can enter data in simple input sheets and instantly see performance updates without any advanced technical skills.
The dashboard tracks essential KPIs such as:
- Production volume
- Refinery efficiency
- Equipment downtime
- Safety performance
- Transport efficiency
- Exploration costs
- Compliance and environmental KPIs
- Revenue and cost KPIs
Because of this complete setup, the Oil & Gas KPI Dashboard supports faster reporting, better planning, and smarter decisions.
Why Do Oil & Gas Companies Need a KPI Dashboard?
Oil and gas operations involve multiple moving parts—production, distribution, refining, storage, and logistics. Without a centralized dashboard, teams struggle with delays, errors, and poor visibility.
An Excel-based KPI Dashboard solves this problem because it brings all critical information together. Leaders see real-time patterns, spot issues quickly, and work with reliable numbers.
Key Features of the Oil & Gas KPI Dashboard in Excel
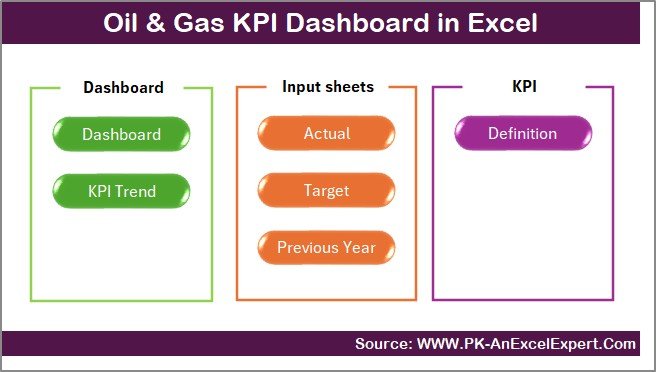
We structured this dashboard with 7 useful worksheets, each serving a clear purpose. Let’s explore them one by one.
Summary Page — The Navigation Control Center
The Summary Page acts as an index that helps users move across the dashboard effortlessly. It contains six quick-action buttons that take you to the respective sheets.
You get a simple and user-friendly layout so anyone can understand the dashboard flow. This page improves speed, navigation, and clarity for all users.
Click to buy Oil & Gas KPI Dashboard in Excel
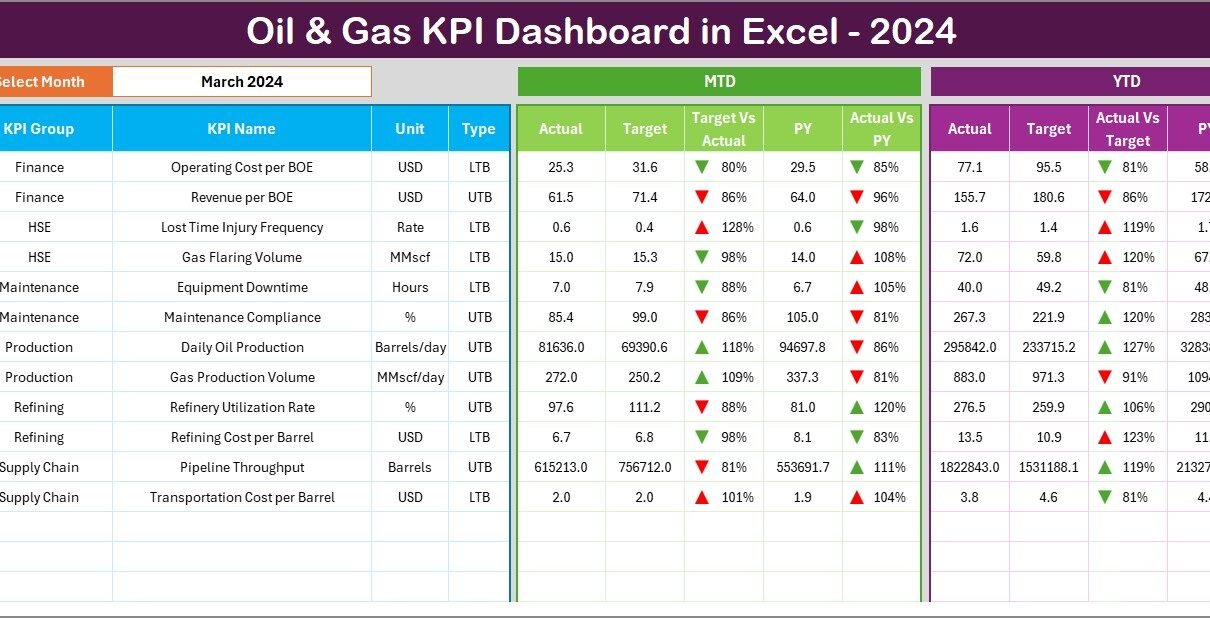
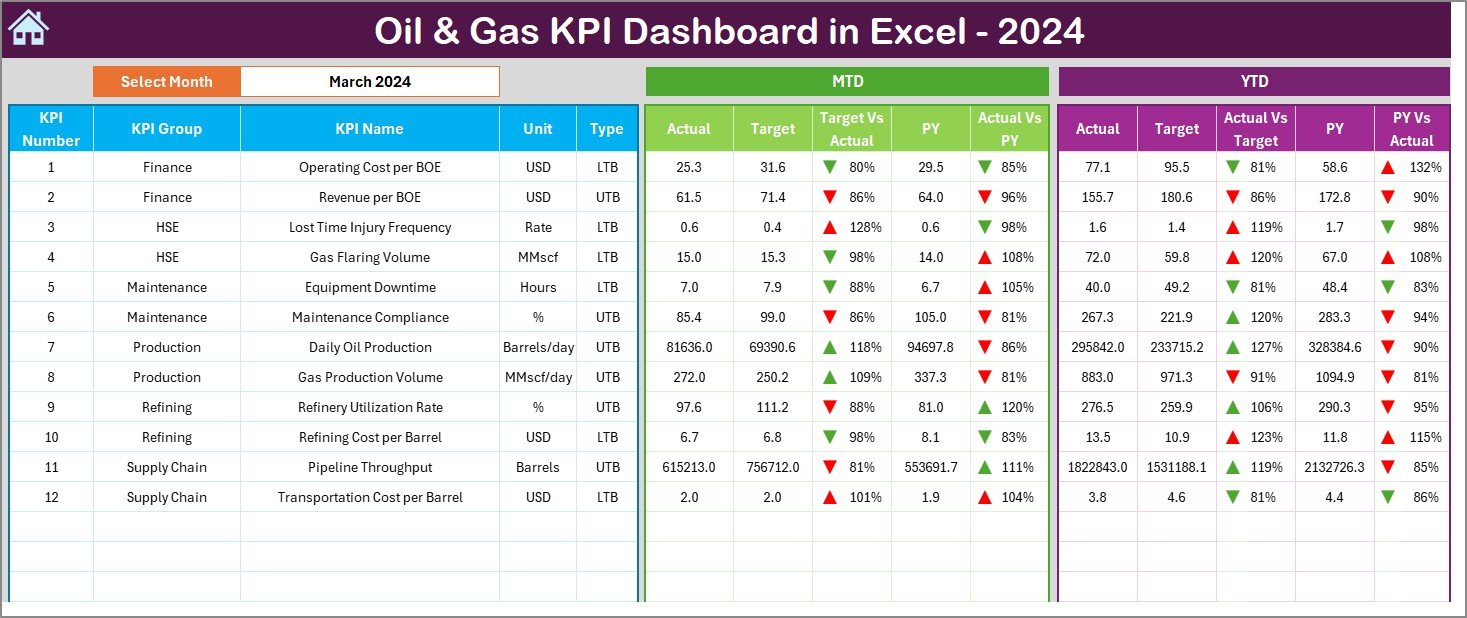
Dashboard Sheet Tab — The Main Performance View
The Dashboard sheet is the heart of the entire Excel file. It displays all major KPIs for the selected month and year.
What You Can Do on This Sheet
- Select the month from a drop-down in cell D3
- View real-time MTD (Month-to-Date) and YTD (Year-to-Date) performance
- Compare Actual vs Target easily
- Compare Actual vs Previous Year (PY) with visual indicators
- Track trends using conditional formatting arrows (Up/Down icons)
- Evaluate performance instantly without manual calculation
What You See on This Sheet
- MTD Actual, Target, Previous Year values
- YTD Actual, Target, Previous Year values
- Visual highlights to show if KPIs improve or decline
This page simplifies decision-making and helps managers act faster.
Click to buy Oil & Gas KPI Dashboard in Excel
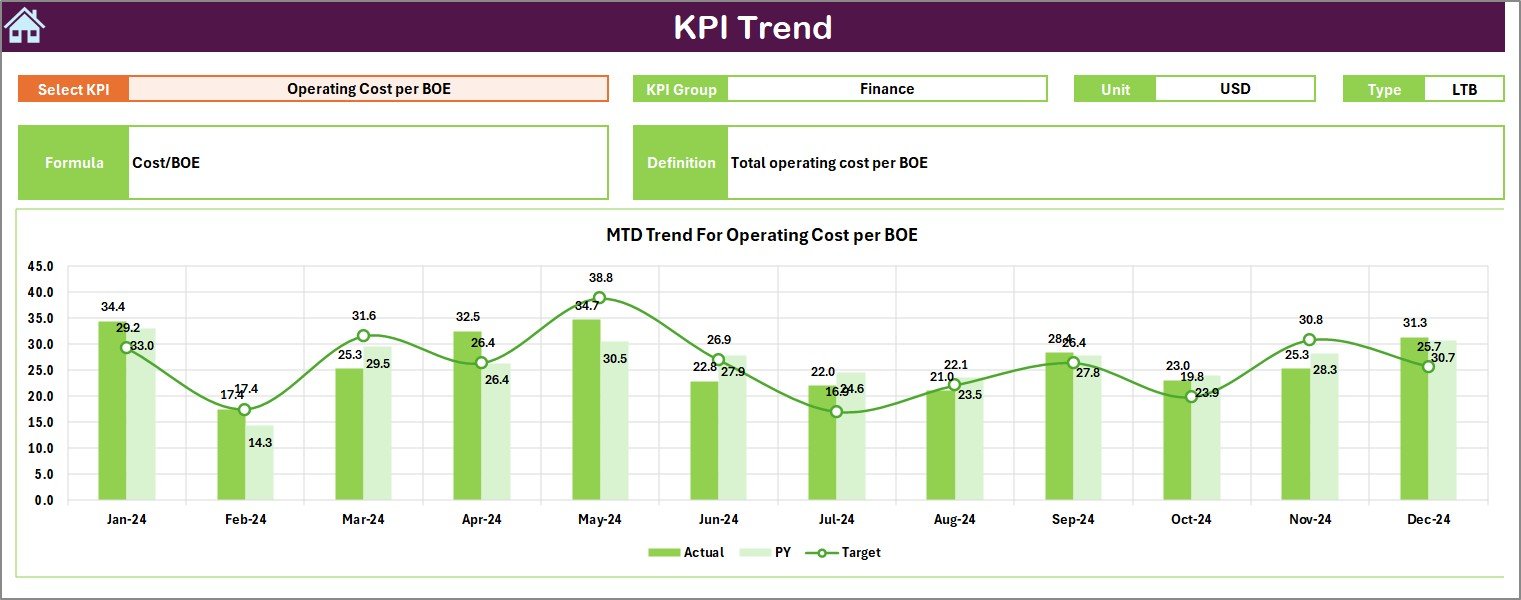
Trend Sheet Tab — Understand KPI Movements
The Trend Sheet allows deeper analysis of performance patterns over time.
What You Can Select
- Choose any KPI name from the drop-down in cell C3
What You Can View
- KPI Group
- KPI Unit
- KPI Type (UTB – Upper the Better or LTB – Lower the Better)
- KPI Formula
- KPI Definition
Additional Charts Included
The sheet contains detailed trend lines for:
- MTD Actual vs Target vs Previous Year
- YTD Actual vs Target vs Previous Year
This helps users compare performance and understand if numbers move in the right direction.
Click to buy Oil & Gas KPI Dashboard in Excel
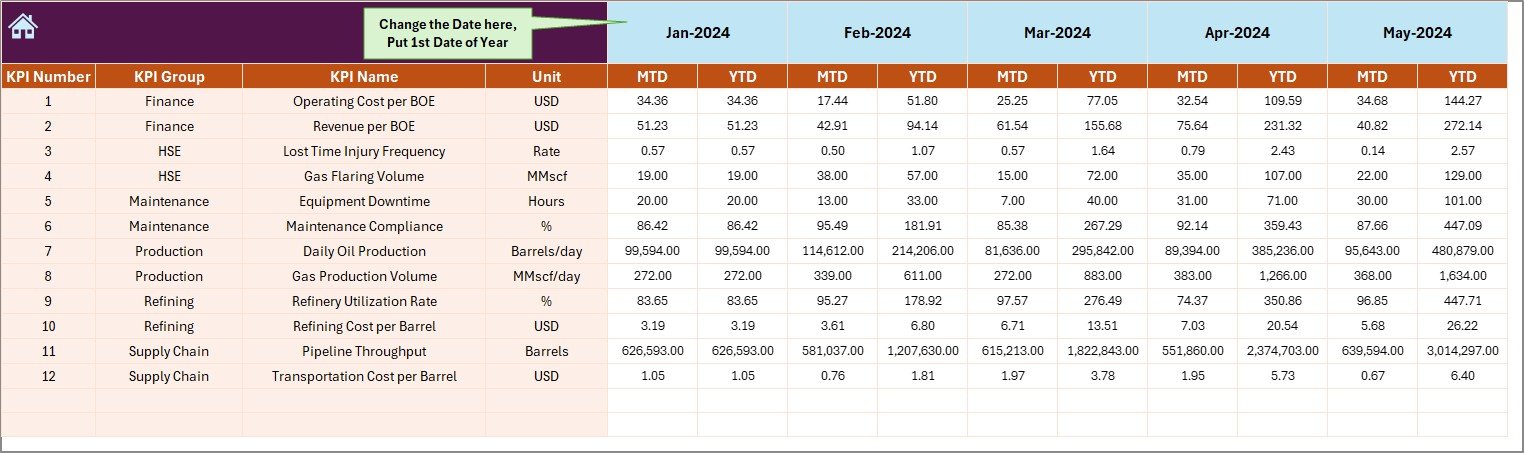
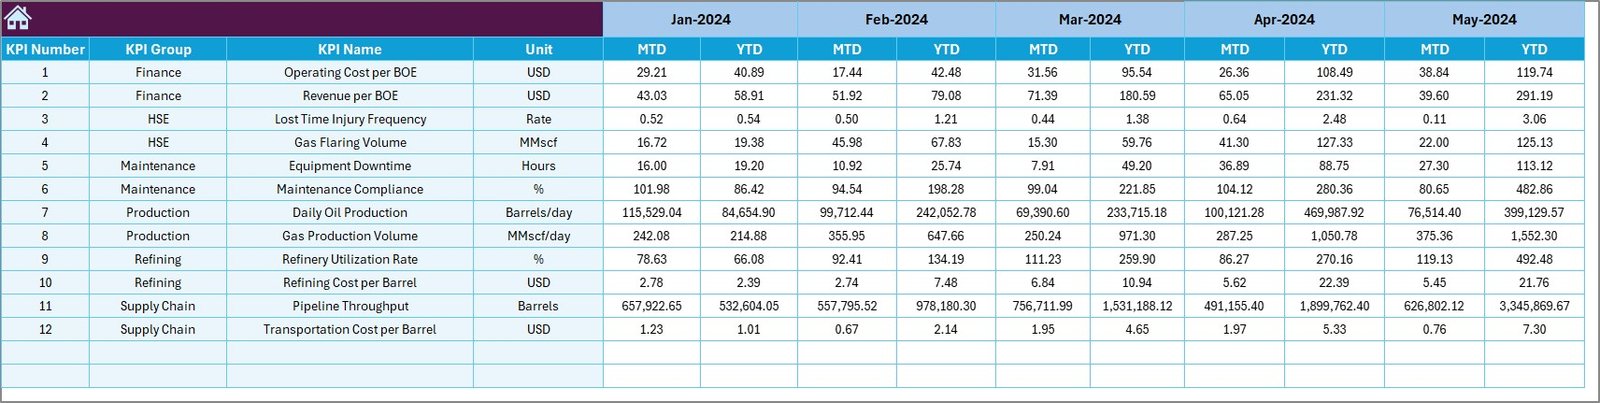
Actual Numbers Input Sheet — Enter Real Performance Data
In this sheet, you enter actual MTD and YTD numbers for each month.
You need to update:
- Month selection in cell E1
- Monthly actual performance data
- Year-to-date cumulative values
This input sheet ensures accuracy and consistency across all calculations.
Click to buy Oil & Gas KPI Dashboard in Excel
Target Sheet Tab — Set Monthly and Yearly Goals
Targets play a major role in performance evaluation. This sheet allows you to enter:
- MTD targets
- YTD targets
- Monthly KPI targets
- Yearly performance expectations
Teams can adjust targets whenever needed based on new strategy or operational changes.
Click to buy Oil & Gas KPI Dashboard in Excel
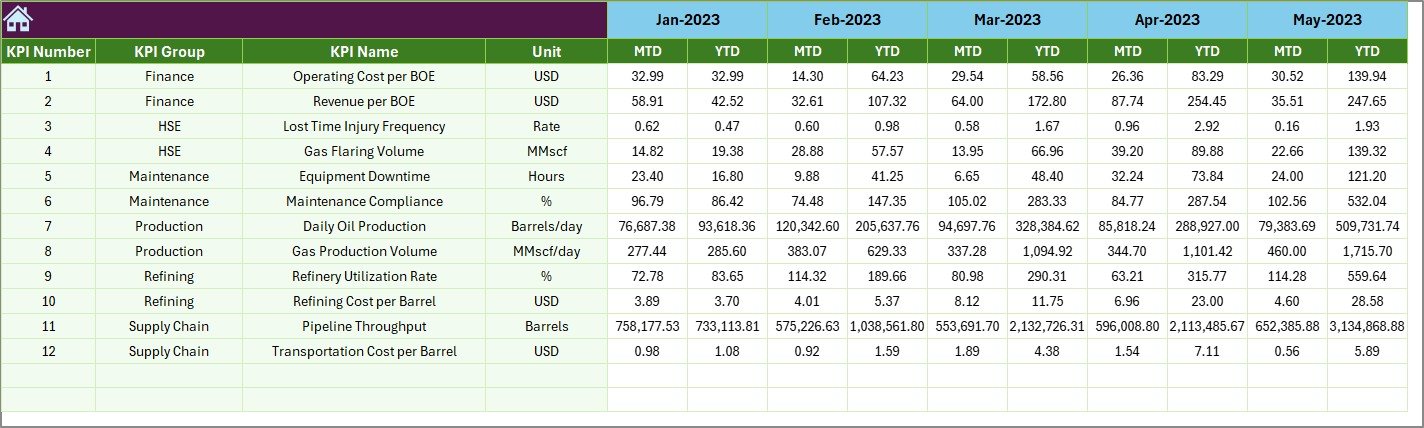
Previous Year Number Sheet — Compare Past & Present Performance
This sheet stores previous year’s performance values for all KPIs. You enter data in the same format as the current year.
With this information, the dashboard automatically calculates:
- Year-on-Year improvement
- Year-on-Year decline
- Long-term trends
- Historical performance patterns
Comparing numbers helps teams understand if they grow, slow down, or move off track.
Click to buy Oil & Gas KPI Dashboard in Excel
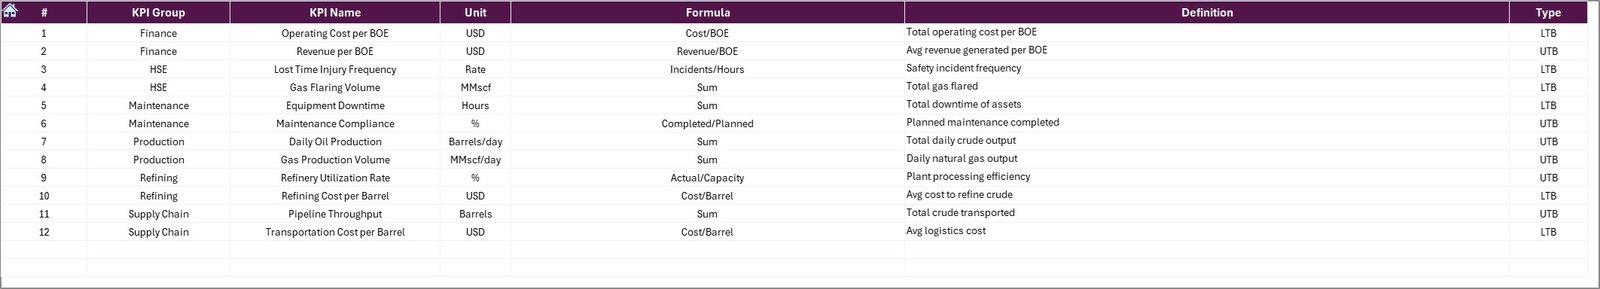
KPI Definition Sheet Tab — Maintain KPI Clarity
Every KPI must have a clear explanation so all users interpret it correctly. In this sheet, you can enter:
- KPI Name
- KPI Group
- KPI Unit
- KPI Formula
- KPI Definition
- KPI Type (UTB / LTB)
This sheet improves understanding and maintains standard measurement practices across departments.
Click to buy Oil & Gas KPI Dashboard in Excel
Important KPIs for the Oil & Gas Industry
To help teams get maximum value from the dashboard, here are some KPI categories you can track:
Production KPIs
- Daily Production Rate
- Well Productivity
- Refinery Utilization
- Extraction Efficiency
Operational KPIs
- Equipment Downtime
- Maintenance Cost
- Pipeline Integrity
- Gas Flaring Rate
Safety & Compliance KPIs
- Incident Rate
- Lost Time Injury Frequency (LTIFR)
- Environmental Compliance Score
- Hazard Reporting Rate
Financial KPIs
- Cost per Barrel
- Revenue per Barrel
- Operating Margin
- Exploration Cost Efficiency
Logistics & Transport KPIs
- Shipment Accuracy
- Average Delivery Time
- Fuel Loss Percentage
- Transport Cost Efficiency
How Does an Oil & Gas KPI Dashboard Help Teams?
A well-designed dashboard transforms raw numbers into beautiful visuals and meaningful insights.
Teams gain:
- Faster decision-making
- Accurate comparison between current and previous months
- Better control over cost and production
- Stronger compliance tracking
- Improved forecasting
- Clear trends and performance signals
Oil & gas leaders value dashboards because dashboards remove confusion and present data in a simple format.
Advantages of Oil & Gas KPI Dashboard in Excel
A powerful dashboard delivers many benefits. Here are the major ones.
- Easy to Use
Anyone can update the dashboard because Excel makes the process simple. You do not need advanced knowledge.
- Helps You Make Better Decisions
You see performance instantly. You understand gaps quickly. You take action at the right time.
- Reduces Reporting Time
Teams save hours of manual calculation. The dashboard updates with just one click.
- Improves Operational Efficiency
Companies reduce downtime, improve production, and strengthen safety by tracking the right KPIs.
- Increases Accountability
KPI visibility encourages teams to meet and exceed targets.
- Customizable for All Oil & Gas Functions
You can modify KPIs based on:
- Exploration
- Production
- Refining
- Safety
- Maintenance
- Finance
- Logistics
Best Practices for the Oil & Gas KPI Dashboard in Excel
Follow these practices to get maximum value from the dashboard.
- Define Clear KPI Goals
Teams must know what they want to measure and why. Keep all KPIs relevant to your operations.
- Update Data Every Month Without Delay
Timely updates ensure accurate reporting.
- Keep KPI Definitions Standardized
Use the KPI Definition sheet to maintain one common format for all departments.
- Use Conditional Formatting Smartly
Visual highlights help you understand performance quickly.
- Review Trends Before Taking Action
Do not react instantly to one month’s decline. Check MTD and YTD trends first.
- Set Realistic Targets
- Balance ambition with practicality. Targets must reflect real operational capability.
- Keep the Dashboard Clean
Avoid overcrowding. Use simple charts and clear layouts.
How to Build This Dashboard Step-by-Step
Although you receive a ready-to-use template, you may want to understand the structure. Here is how the dashboard works internally.
Step 1: Add KPI Names and Definitions
Enter all KPI information in the KPI Definition sheet.
Step 2: Add Current Year Actual Values
Update the Actual Input sheet each month.
Step 3: Add Target Values
Enter monthly targets in the Target sheet.
Step 4: Add Previous Year Values
Enter last year’s performance in the Previous Year sheet.
Step 5: Use Excel Formulas
The dashboard uses formulas like:
- SUM
- IF
- VLOOKUP / XLOOKUP
- INDEX-MATCH
- CONDITIONAL FORMATTING
- Charts
Step 6: Review the Dashboard
Once your data is complete, visit the Dashboard page and review the KPI results.
Conclusion
The Oil & Gas KPI Dashboard in Excel brings clarity, structure, and efficiency to a highly complex industry. It simplifies reporting, improves decisions, and supports teams across production, safety, finance, and logistics. With a clean layout, smart formulas, and user-friendly navigation, this dashboard becomes a complete performance management solution for oil and gas companies.
When teams track the right KPIs regularly, they reduce risk, boost efficiency, and find better ways to manage operations. This dashboard helps them achieve all of this with ease.
Frequently Asked Questions (FAQs)
- What is an Oil & Gas KPI Dashboard in Excel?
It is a performance tracking tool that helps oil & gas teams monitor key indicators like production, cost, safety, downtime, transport efficiency, and compliance using Excel.
- Who can use this dashboard?
Exploration teams, refinery managers, field operators, maintenance staff, finance teams, and leadership can all use this dashboard.
- Do I need advanced Excel skills?
No. You can update the entire dashboard using simple inputs without advanced knowledge.
- Can I add more KPIs?
Yes. You can edit the KPI Definition sheet and expand the dashboard anytime.
- Can I customize the layout?
Yes. You can change colors, charts, and formulas based on your company’s branding and needs.
Visit our YouTube channel to learn step-by-step video tutorials
Watch the step-by-step video tutorial:
Click to buy Oil & Gas KPI Dashboard in Excel