The Pharmaceutical Dashboard in Excel serves as a comprehensive tool designed for the pharmaceutical industry, providing critical insights into key metrics, including revenue, profit margins, sales, inventory levels, and expiry risks. This ready-to-use dashboard consolidates various aspects of the pharmaceutical business into one place, helping managers and decision-makers streamline their operations and make data-driven decisions.
In this article, we will explore the features and functionality of the Pharmaceutical Dashboard in Excel, how it can enhance your decision-making process, and best practices for optimizing its use.
What is a Pharmaceutical Dashboard in Excel?
A Pharmaceutical Dashboard in Excel is a tool designed to display key performance indicators (KPIs) relevant to the pharmaceutical industry. The dashboard pulls data from various sheets and provides a visual representation of business performance. It allows you to track sales, profit, inventory levels, and more, all in one place. The dashboard includes various charts, slicers, and data cards, making it easier to interpret complex data and identify trends.
Key Features of the Pharmaceutical Dashboard in Excel
Click to buy Pharmaceutical Dashboard in Excel
The Pharmaceutical Dashboard consists of multiple sheets, each focusing on a different aspect of your pharmaceutical operations. Let’s break down these sheets and their respective features:
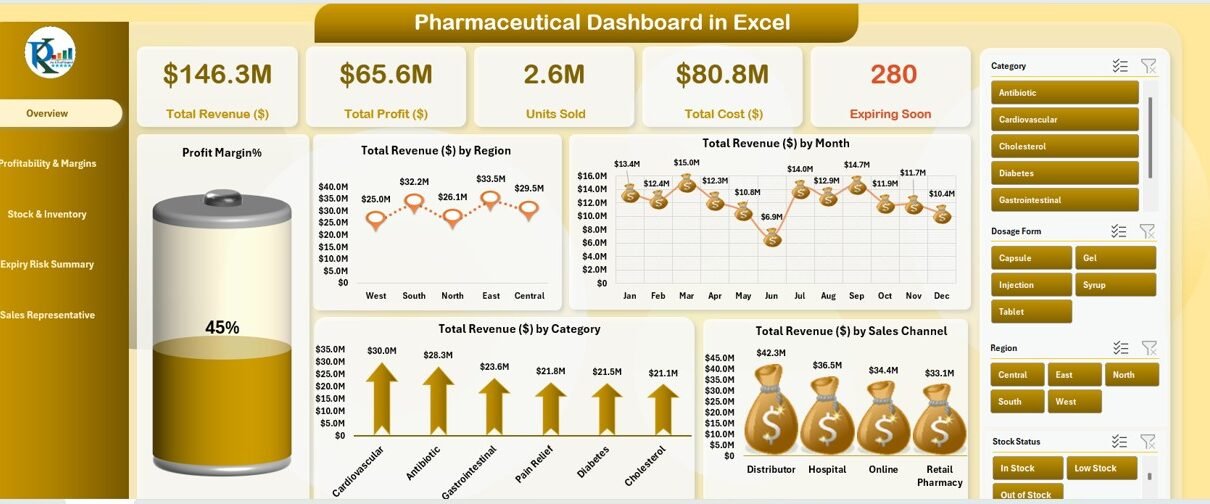
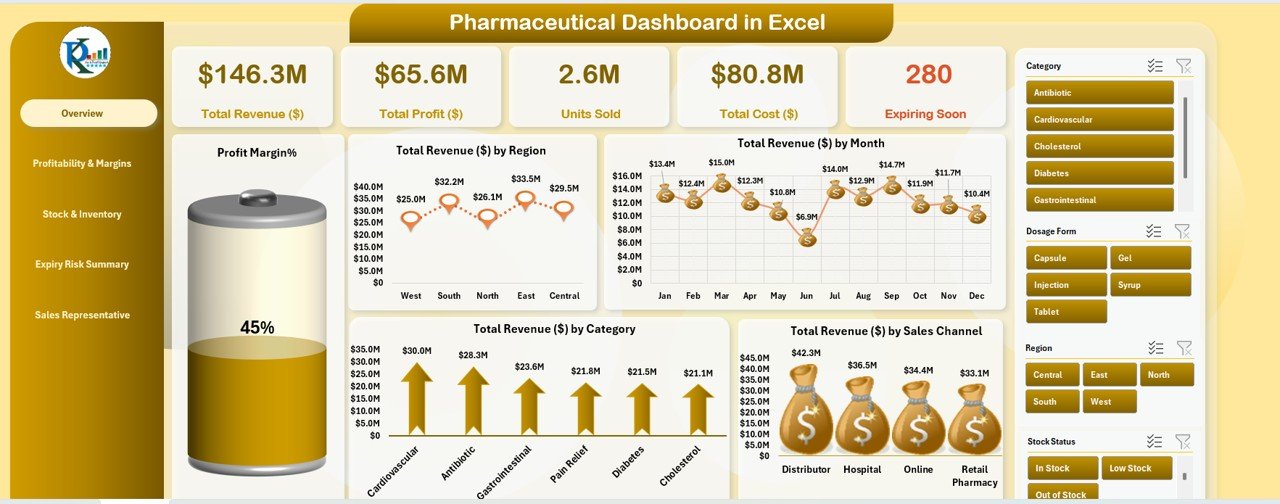
1. Overview Sheet Tab
The Overview Sheet Tab is the central hub of the dashboard, providing a snapshot of essential business data. The following elements are included:
Cards: These show important KPIs such as:
- Total Revenue ($)
- Total Profit ($)
- Units Sold
- Total Cost ($)
- Expiring Soon Products: Alerts for products that are nearing expiration.
Charts: These visual elements help to quickly understand trends and performance. The charts included are:
- Profit Margin (%): Displayed using a battery chart, this helps track profit margins over time.
- Total Revenue by Region: Shows how revenue is distributed across different regions.
- Total Revenue by Month: Highlights the seasonal trends in revenue.
- Total Revenue by Category: Breaks down revenue based on product categories.
- Total Revenue by Sales Channel: Shows how much revenue is generated from different sales channels.
Click to buy Pharmaceutical Dashboard in Excel
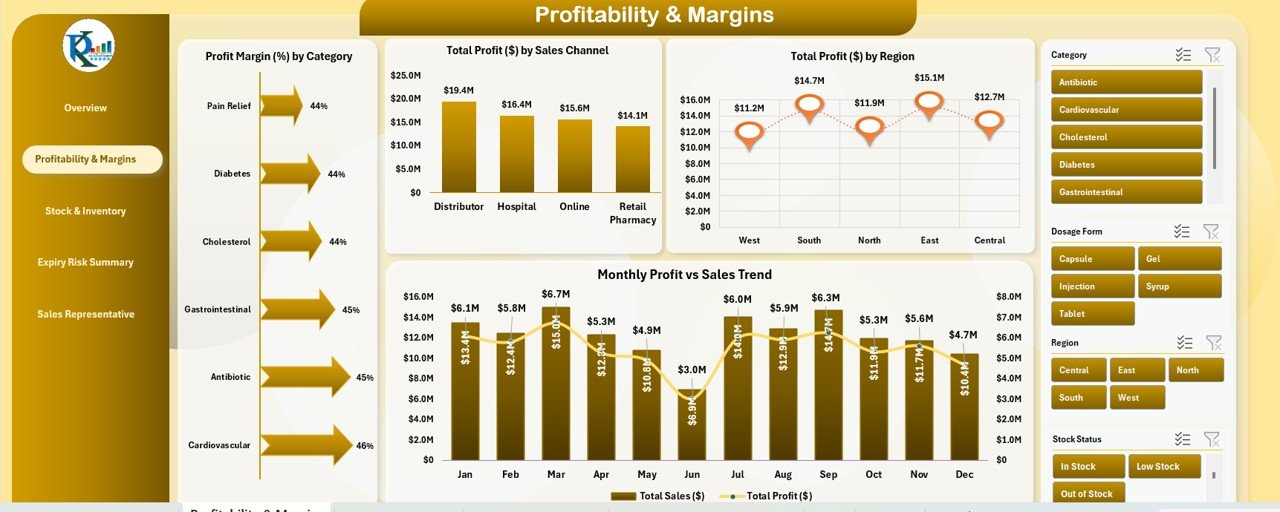
2. Profitability & Margins Sheet Tab
This sheet focuses on profitability and helps you evaluate the effectiveness of your sales strategies. It includes:
-
Profit Margin by Category: Displays profit margins for different product categories.
-
Total Profit by Sales Channel: Shows the total profit generated by each sales channel.
-
Total Profit by Region: A regional breakdown of profits.
-
Monthly Profit vs. Sales Trend: Visualizes the relationship between monthly profits and sales, helping you track growth and profitability.
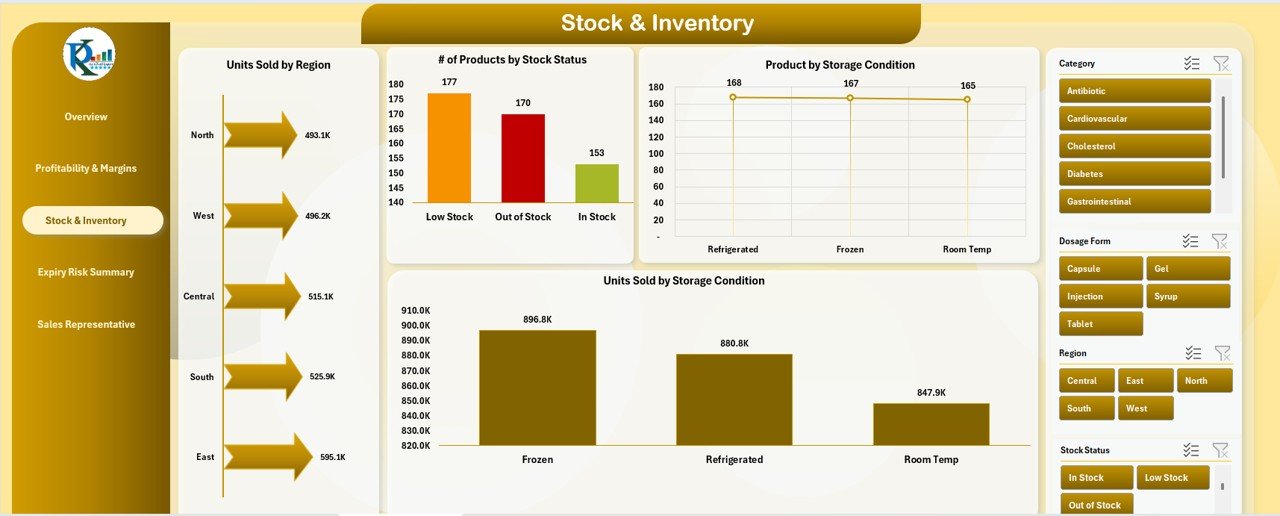
3. Stock & Inventory Sheet Tab
This sheet tracks inventory metrics and is critical for maintaining stock levels. It includes:
-
Units Sold by Region: Helps assess the sales performance across different regions.
-
Number of Products by Stock Status: Tracks how many products are in stock, out of stock, or on backorder.
-
Products by Storage Condition: Monitors product condition during storage.
-
Units Sold by Storage Condition: Shows sales based on how products are stored, helping to identify potential storage issues.
Click to buy Pharmaceutical Dashboard in Excel
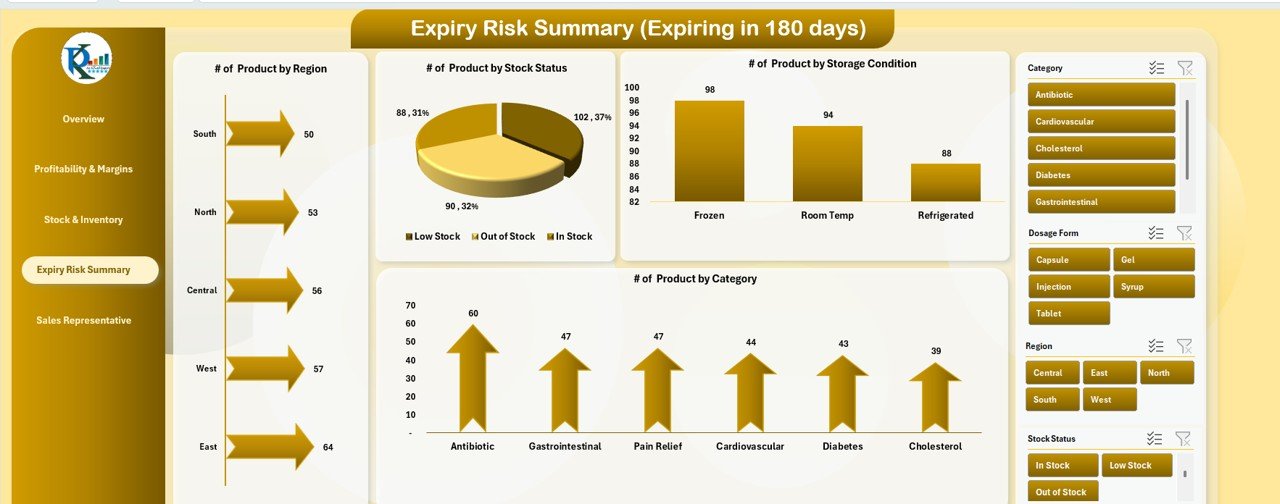
4. Expiry Risk Summary Sheet Tab
This sheet provides insights into products that are close to their expiry dates. It includes:
-
Number of Products by Region: Highlights the region-wise distribution of products nearing expiry.
-
Number of Products by Stock Status: Helps identify how many expired products are still in stock.
-
Number of Products by Storage Condition: Tracks the condition of products nearing expiry.
-
Number of Products by Category: Helps identify which categories have the most expired products.
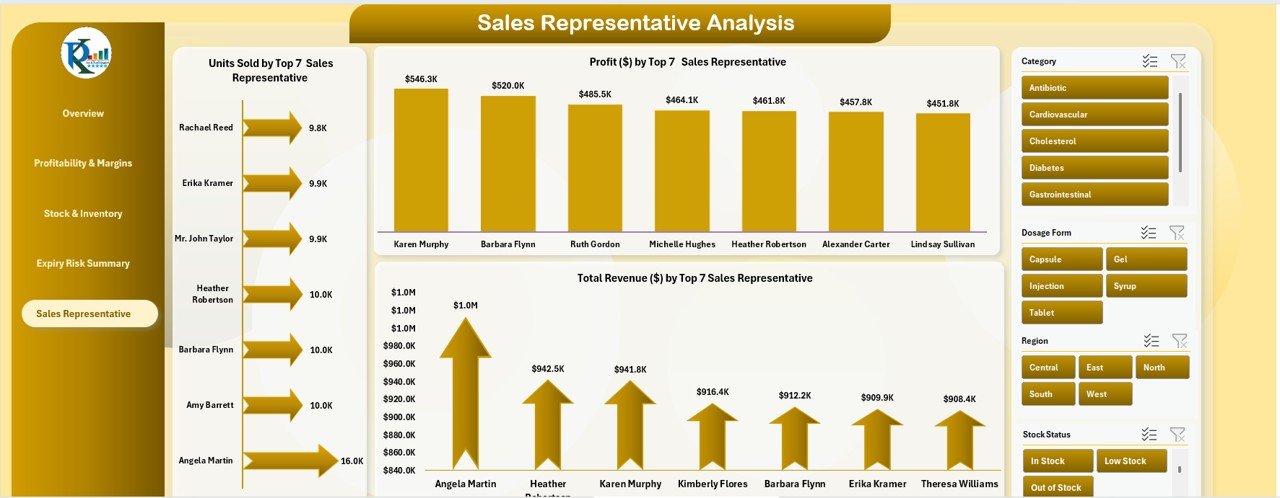
5. Sales Representative Analysis Sheet Tab
This sheet provides insights into individual sales representative performance. It includes:
-
Units Sold by Top 7 Sales Representatives: Displays the top 7 sales representatives based on units sold.
-
Profit by Top 7 Sales Representatives: Shows which sales representatives generate the most profit.
-
Total Revenue by Top 7 Sales Representatives: Tracks the total revenue generated by the leading sales representatives.
Click to buy Pharmaceutical Dashboard in Excel
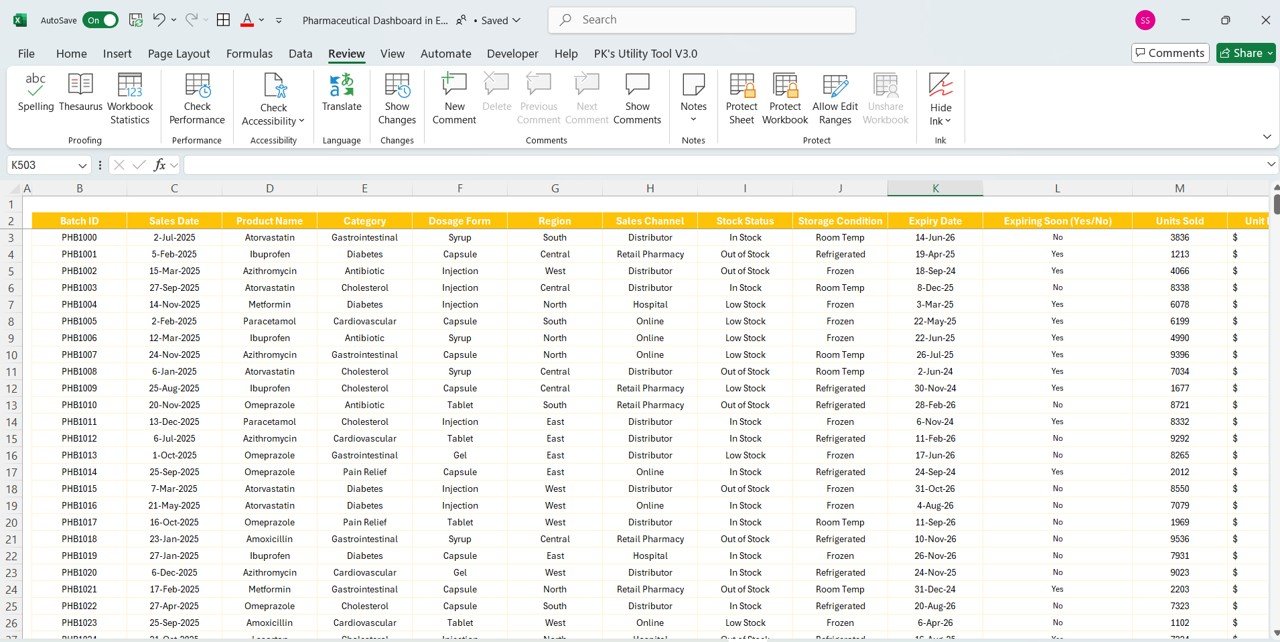
6. Data Sheet Tab
The Data Sheet serves as the input sheet where you enter sales and product information. This tab captures critical details like:
-
Batch ID: Unique identifier for each product batch.
-
Sales Date: Date of product sale.
-
Product Name: Name of the product sold.
-
Category: The category of the product (e.g., pain relief, antibiotics).
-
Dosage Form: Form of the product (e.g., tablet, syrup).
-
Region: Geographic region of the sale.
-
Sales Channel: Channel through which the product was sold (e.g., retail, online).
-
Stock Status: The current stock status of the product.
-
Storage Condition: The storage conditions of the product.
-
Expiry Date: Date when the product expires.
-
Expiring Soon (Yes/No): Indicates whether the product is close to expiring.
-
Units Sold: Number of units sold.
-
Unit Price: Price of one unit.
-
Production Cost: Cost to produce one unit.
-
Sales Representative: The salesperson responsible for the sale.
-
Total Sales: The total sales amount generated from this transaction.
-
Total Cost: The total cost incurred for this transaction.
-
Profit: The profit generated from the sale.
-
Month: Month in which the sale occurred.
Click to buy Pharmaceutical Dashboard in Excel
Advantages of Using the Pharmaceutical Dashboard in Excel
The Pharmaceutical Dashboard in Excel offers several key benefits that can help pharmaceutical businesses optimize their operations:
-
Centralized Data: All key metrics are available in one place, reducing the time spent searching for information and improving decision-making efficiency.
-
Enhanced Visualization: With charts, slicers, and data cards, users can easily interpret complex data and track trends over time.
-
Real-Time Monitoring: The dashboard provides real-time updates based on the latest data input, ensuring that you have the most up-to-date insights.
-
Improved Inventory Management: The inventory and expiry tracking features help prevent stockouts and ensure that products are stored and sold in optimal conditions.
-
Sales Performance Tracking: The dashboard allows businesses to monitor the performance of individual sales representatives, making it easier to identify top performers and areas for improvement.
Opportunities for Improvement in the Pharmaceutical Dashboard
While the Pharmaceutical Dashboard in Excel is a powerful tool, there are always opportunities to improve its functionality and usability:
-
Automated Data Import: Integrating automated data import features can save time by reducing the need for manual data entry.
-
Advanced Analytics: Adding predictive analytics could help forecast future sales, profit margins, and inventory needs.
-
Mobile Compatibility: Optimizing the dashboard for mobile devices could make it more accessible for on-the-go decision-making.
-
Integration with ERP Systems: Connecting the dashboard with existing Enterprise Resource Planning (ERP) systems can provide more seamless data flow and improve overall efficiency.
-
Customizable Dashboards: Allowing users to customize dashboard elements such as charts and KPIs could make it more adaptable to different business needs.
Best Practices for Using the Pharmaceutical Dashboard
Click to buy Pharmaceutical Dashboard in Excel
To get the most out of the Pharmaceutical Dashboard in Excel, follow these best practices:
-
Keep Data Updated: Ensure that the data input sheet is regularly updated with accurate sales and inventory data.
-
Utilize Slicers and Filters: Slicers and filters allow you to segment and analyze data more effectively. Use them to drill down into specific regions, categories, or timeframes.
-
Review Profitability Metrics Regularly: Track the profitability and margins frequently to identify areas where cost savings can be achieved.
-
Monitor Expiry Risks: Regularly check the Expiry Risk Summary Sheet to ensure that expired products are removed from inventory in a timely manner.
-
Train Staff: Provide training to employees on how to use the dashboard effectively so that everyone can benefit from its features.
Conclusion
The Pharmaceutical Dashboard in Excel is an indispensable tool for pharmaceutical businesses, providing essential insights into sales, inventory, profit margins, and expiry risks. By utilizing this dashboard, companies can streamline operations, improve profitability, and make informed decisions. Following best practices and continuously looking for opportunities to improve its functionality will help businesses maximize the value they derive from this powerful tool.
Frequently Asked Questions (FAQs)
Click to buy Pharmaceutical Dashboard in Excel
1. What is a Pharmaceutical Dashboard in Excel?
A Pharmaceutical Dashboard in Excel is a tool that helps pharmaceutical businesses track key performance indicators (KPIs) related to sales, inventory, profit, and expiry risks. It consolidates various aspects of the business into one place for easy analysis.
2. How can I use the Pharmaceutical Dashboard for inventory management?
The dashboard includes a Stock & Inventory sheet that tracks units sold by region, product stock status, and storage conditions. This helps you manage inventory effectively and identify products that are nearing expiry.
3. Can I customize the charts in the dashboard?
Yes, the dashboard includes several charts that can be customized to display data that’s most relevant to your business needs.
4. Is it easy to update the data in the dashboard?
Yes, the data sheet allows for easy manual entry of sales and inventory data. The dashboard will automatically update when the data sheet is updated.
5. How does the Pharmaceutical Dashboard help with sales performance tracking?
The Sales Representative Analysis sheet tracks units sold, profit, and total revenue by the top sales representatives, helping you evaluate individual performance and make necessary adjustments to your sales strategy.
Visit our YouTube channel to learn step-by-step video tutorials
Click to buy Pharmaceutical Dashboard in Excel